Ecg
Asking for Preferences
Asking for Preferences
Reading File
Finding Sources
Finding Sources
Reading File
Reading File
Reading File
Reading File
Reading File
Loading Image
Loading Image
Excellent content gathered. Here is a complete, well-organized answer.
ECG Findings in Myocardial Infarction (STEMI & NSTEMI)
The Underlying Mechanism
Three simultaneous electrical defects occur in infarcted myocardium, all producing the same net result - ST elevation in leads overlying the infarct:
| Defect in Infarcted Cells | Current Flow | ECG Change (leads over infarct) |
|---|---|---|
| Rapid repolarization (accelerated K+ channel opening) | Out of infarct | ST elevation |
| Decreased resting membrane potential (K+ loss) | Into infarct | TQ depression - recorded as ST elevation |
| Delayed depolarization | Out of infarct | ST elevation |
- Ganong's Review of Medical Physiology, 26th ed., p. 534
Leads on the opposite side of the heart show reciprocal ST depression.
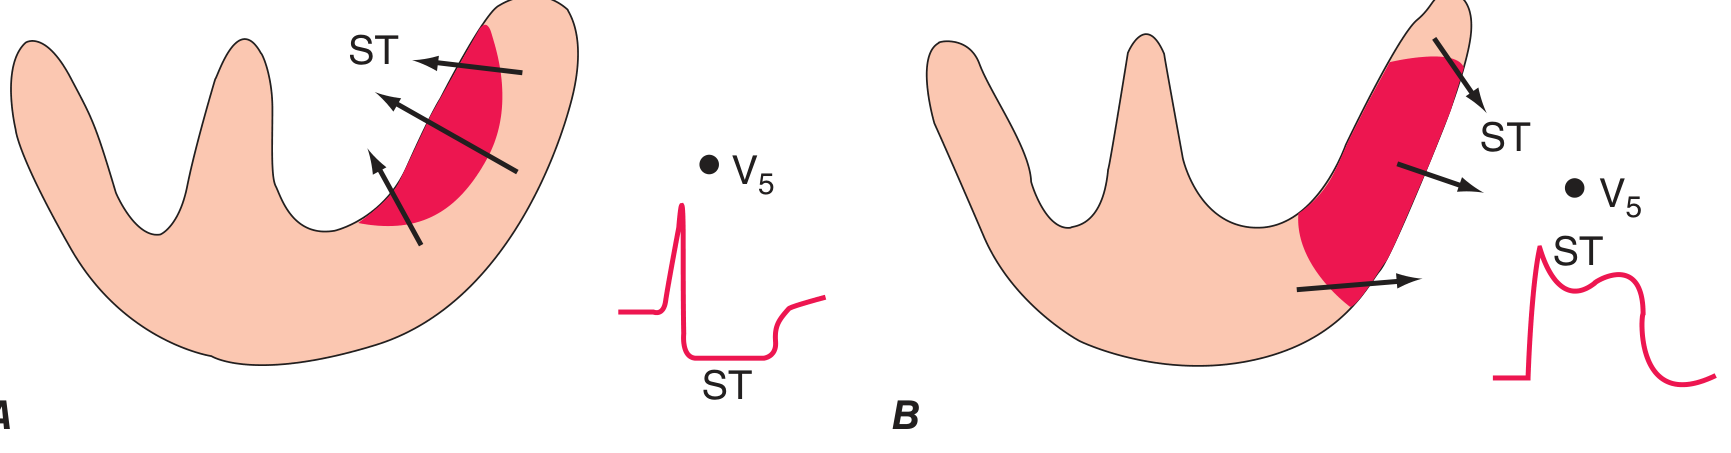
Current of Injury: Subendocardial vs. Transmural
-
Panel A (subendocardial ischemia / NSTEMI): The ST vector points inward toward the ventricular cavity. Overlying leads show ST depression.
-
Panel B (transmural ischemia / STEMI): The ST vector points outward (epicardial). Overlying leads show ST elevation.
-
Harrison's Principles of Internal Medicine, 22E, p. 1916
Temporal Evolution of ECG Changes in STEMI
The changes evolve in a predictable sequence:
- Minutes - Hours (hyperacute phase): Tall, peaked hyperacute T waves - often the very first sign. Then ST elevation develops.
- Hours - Days: ST elevation with formation of Q waves. T waves may start to invert.
- Days - Weeks: ST normalizes. T-wave inversions persist. Q waves deepen.
- Weeks - Months: Q waves may persist permanently (scar). T waves may normalize or remain inverted.
Note: Reversible transmural ischemia (e.g., Prinzmetal/vasospastic angina) can cause transient ST elevation without Q wave formation.
STEMI: Localization by Leads
| Territory | ECG Leads with ST Elevation |
|---|---|
| Anteroseptal | V1, V2, (V3) |
| Anterior | V1, V2, V3, V4 |
| Anterolateral | V1-V6, I, aVL |
| Lateral | I, aVL |
| Inferior | II, III, aVF |
| Inferolateral | II, III, aVF, V5, V6 |
| True posterior | Tall R wave in V1-V2, R/S ≥ 1, ST depression V1-V3 (mirror image) |
| Right ventricular | ST elevation II, III, aVF + ST elevation in right-sided leads V3R-V6R |
- Tintinalli's Emergency Medicine, p. 378
Tip: For inferior STEMI, always obtain a right-sided ECG (V3R-V6R) to rule out RV infarction, which increases morbidity significantly and changes management (avoid nitrates, give fluids).
Identifying the Culprit Vessel
| ECG Pattern | Likely Culprit Artery |
|---|---|
| ST elevation III > II + ST depression in I, aVL | Right coronary artery (RCA) |
| Above + ST elevation V1 or V4R | Proximal RCA (with RV infarction) |
| Inferior MI + ST elevation in I, aVL, V5/V6 | Left circumflex (LCx) |
| ST elevation aVR > V1 | Left main or proximal LAD |
| ST elevation V1-V4 + absence of above inferior pattern | LAD (distal) |
- Tintinalli's Emergency Medicine, p. 378-379
NSTEMI / Unstable Angina: ECG Findings
- Diagnosis of NSTEMI depends primarily on elevated troponin + compatible symptoms; the ECG may show changes but does NOT meet STEMI criteria.
- Common findings:
- ST depression (subendocardial ischemia)
- T-wave inversions (may be deep and widespread)
- Non-specific ST-T changes
- ECG may be completely normal in up to 20% of NSTEMIs
- Tintinalli's Emergency Medicine, p. 378
Wellens T-Wave Sign (High-Risk NSTEMI Pattern)
Deep symmetric T-wave inversions in V1-V4 (and sometimes I, aVL) suggest critical proximal LAD stenosis. This is the Wellens sign - patient may be pain-free at the time of ECG but is at high risk for massive anterior MI. Do not stress test these patients.
- Harrison's Principles of Internal Medicine, 22E, p. 1916
Q Waves: What They Mean
- Pathological Q wave: ≥ 0.04 s wide and ≥ 25% of R-wave height - indicates myocardial necrosis (scar).
- Old teaching: Q waves = transmural; no Q waves = subendocardial. This is now known to be unreliable - transmural infarcts can occur without Q waves, and NSTEMIs can produce Q waves.
- More accurate classification: Q-wave MI vs. Non-Q-wave MI
- Harrison's Principles of Internal Medicine, 22E
Key Mimics to Exclude (STEMI Mimics)
| Condition | Distinguishing Feature |
|---|---|
| Left bundle branch block (LBBB) | New LBBB can mimic STEMI (Sgarbossa criteria help) |
| Pericarditis | Diffuse saddle-shaped ST elevation, PR depression, no reciprocal changes |
| Brugada pattern | ST elevation V1-V2 with RBBB morphology, no ischemic context |
| Benign early repolarization | ST elevation V2-V5, J-point notching, young patient, stable |
| LVH with strain | ST depression/T inversion in lateral leads, no chest pain |
Summary mnemonic - STEMI evolution: "HyperT → STE → Q + Tinv → Q scar"
Ihd
Asking for Preferences
Finding Sources
Finding Sources
Finding Sources
Finding Sources
Finding Sources
Reading File
Reading File
Reading File
Reading File
Loading Image
Loading Image
Finding Sources
I have everything needed for a thorough answer. Here it is:
Ischaemic Heart Disease (IHD) - Overview & Pathophysiology
What is IHD?
IHD (also called Coronary Artery Disease / CAD) is a condition in which myocardial oxygen demand exceeds supply, most commonly due to atherosclerotic narrowing of the coronary arteries. It is the leading cause of death worldwide - myocardial infarction alone accounts for roughly one-quarter of all deaths in Western nations.
- Robbins & Kumar Basic Pathology, p. 314
The Central Concept: Supply vs. Demand Mismatch
| Factor | What Happens in IHD |
|---|---|
| O2 supply | Reduced - atherosclerotic stenosis limits coronary blood flow |
| O2 demand | Normal or increased - heart still needs to pump |
| Net result | Myocardial ischaemia → angina or infarction |
The myocardium is unique in that it extracts nearly all available O2 from coronary blood even at rest, so it cannot compensate by extracting more - the only way to increase supply is to increase coronary flow. Stenosis blocks this ability.
Stage 1 - Endothelial Dysfunction (The Trigger)
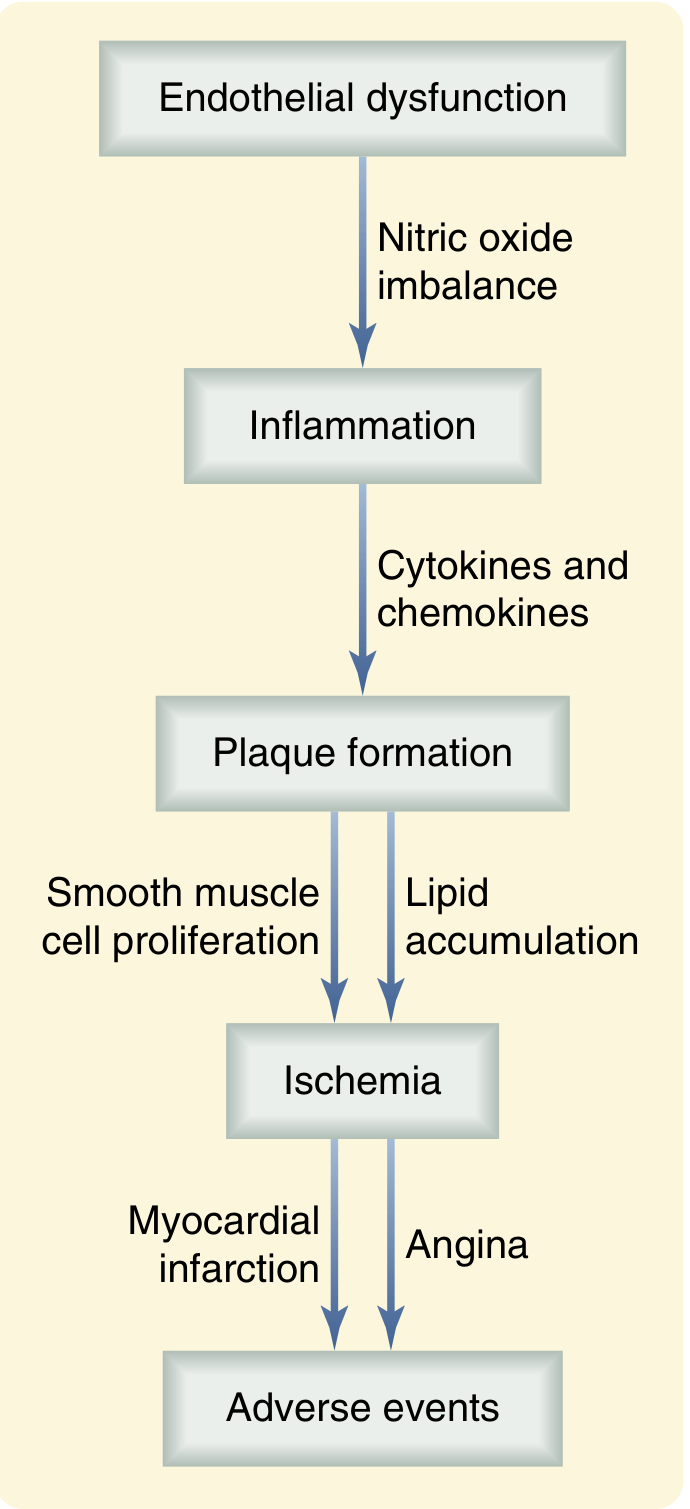
The process begins with injury to the vascular endothelium, driven by risk factors such as:
- Hyperlipidaemia (elevated LDL)
- Hypertension
- Cigarette smoking
- Diabetes mellitus
Endothelial cells normally produce nitric oxide (NO), a potent vasodilator that maintains vascular tone and inhibits platelet aggregation. Injury reduces bioavailable NO, causing:
-
Vasoconstriction
-
Pro-inflammatory signalling
-
Increased vascular permeability (allows LDL to enter the intima)
-
Sabiston Textbook of Surgery, p. 2484
Stage 2 - Inflammation & Foam Cell Formation
Once LDL enters the intima, it is oxidised to oxLDL, which:
- Triggers release of adhesion molecules - VCAM-1 and ICAM-1 - on the endothelium
- Recruits monocytes and T lymphocytes from the bloodstream
- Monocytes differentiate into macrophages, which engulf oxLDL via scavenger receptors
- Lipid-laden macrophages become foam cells - the initial visible lesion, called a fatty streak
T cells activated in this environment release TNF-α, IL-1β, IL-6, perpetuating the inflammatory cycle.
Stage 3 - Plaque Formation (Atheroma)
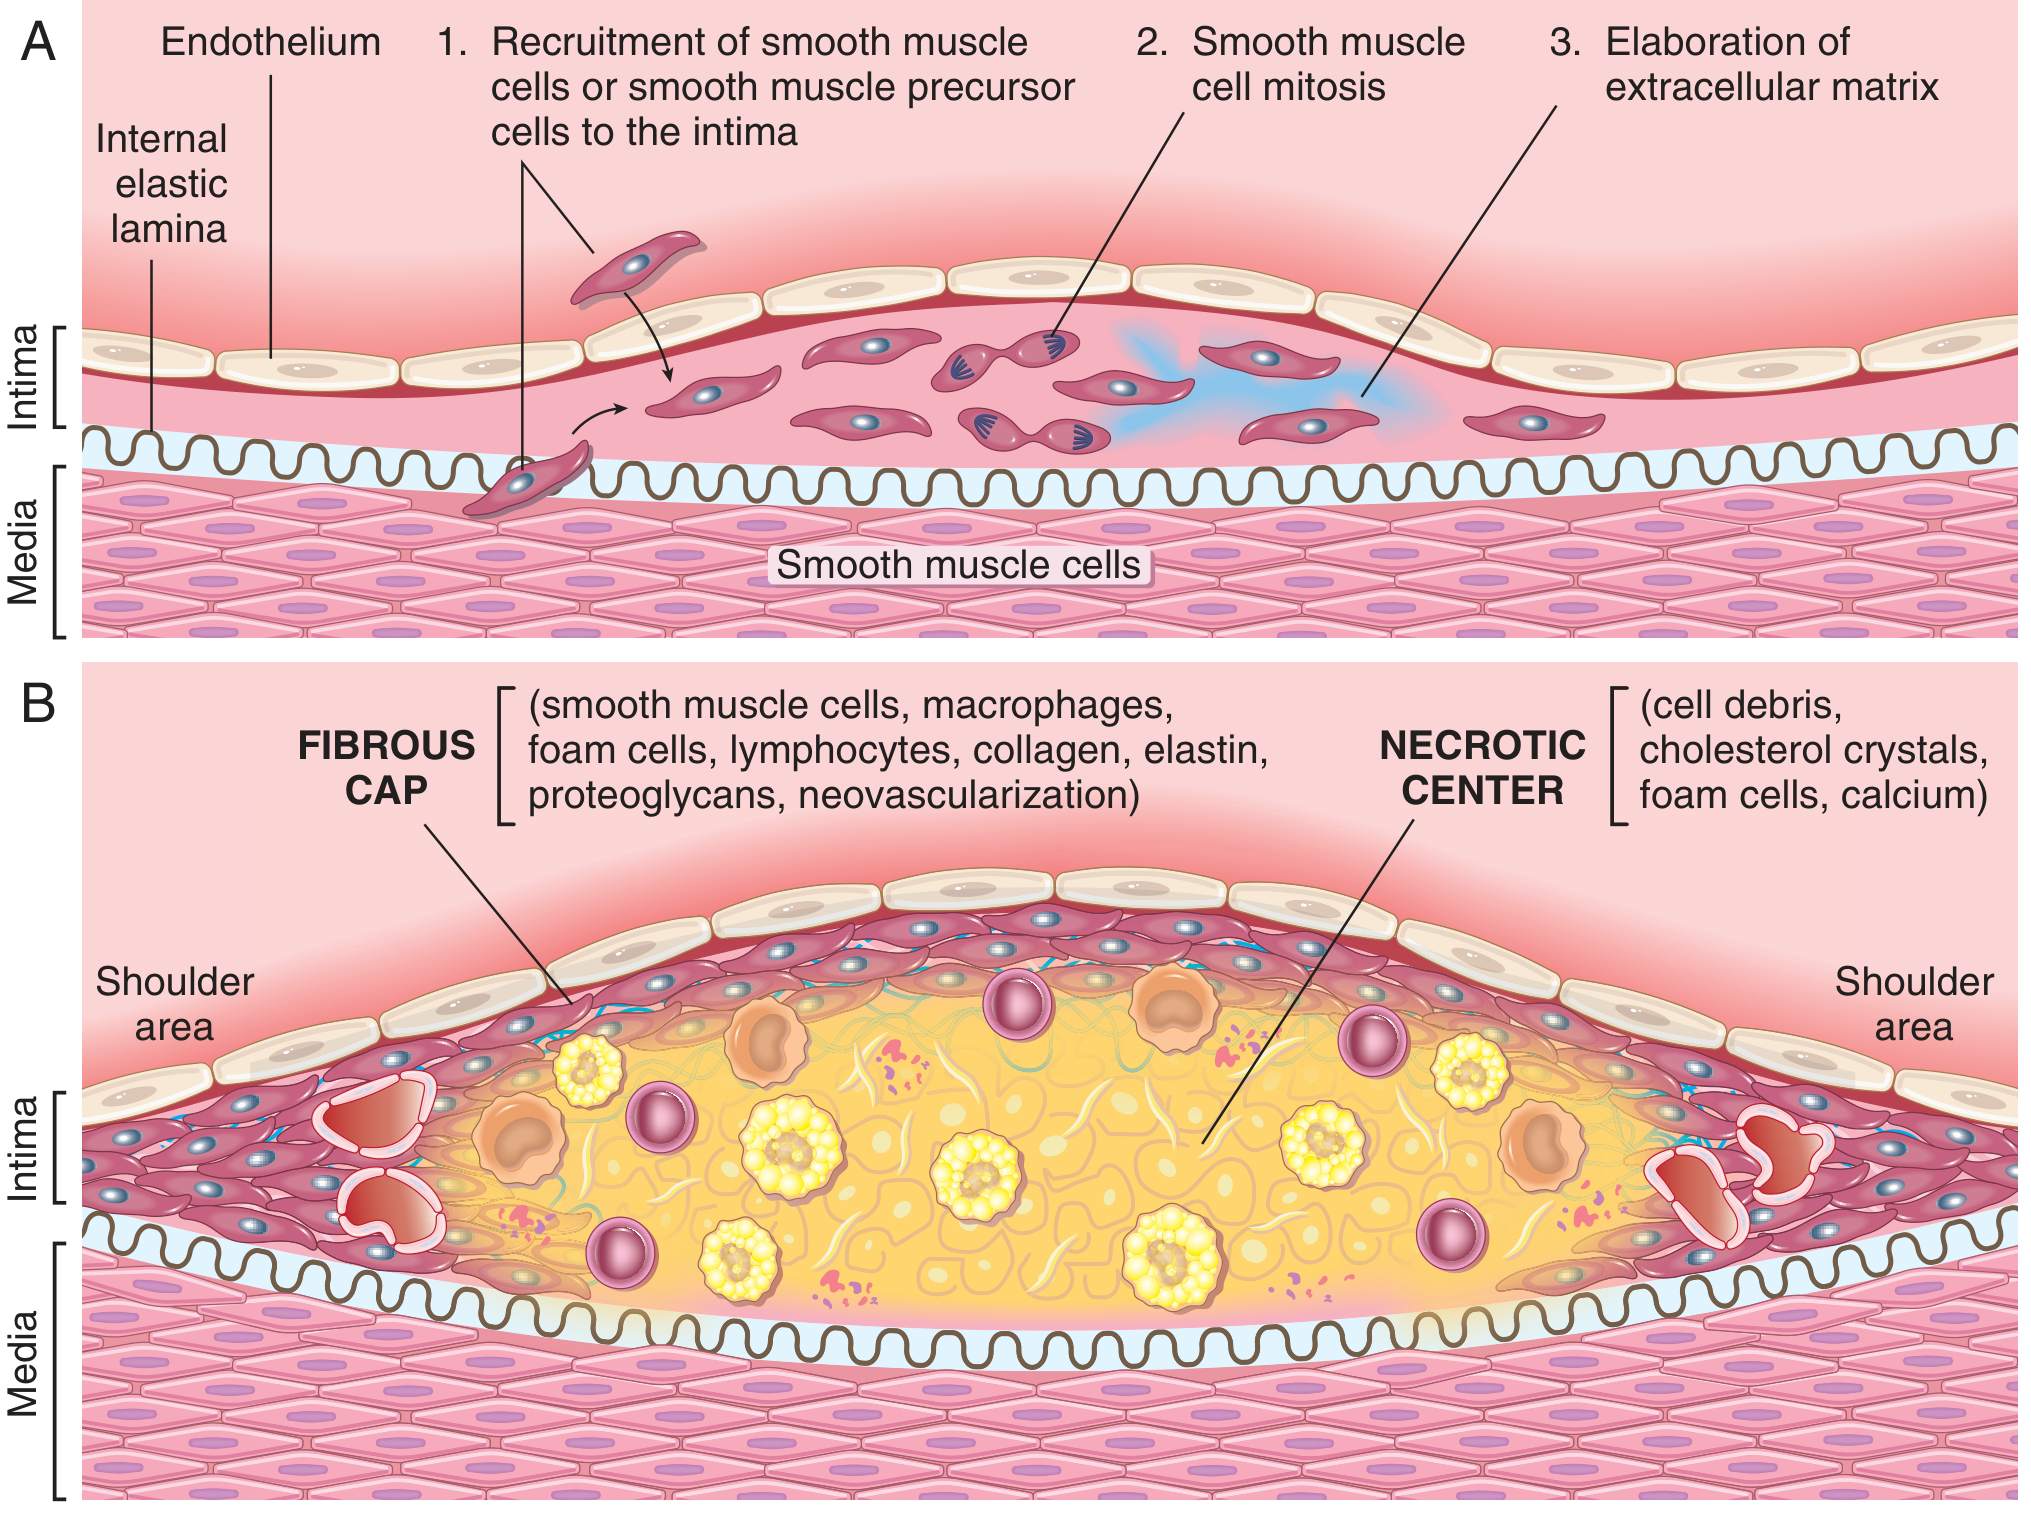
With persistent injury, smooth muscle cells (SMCs) migrate from the media into the intima, driven by cytokines and growth factors. These SMCs then:
- Proliferate
- Synthesise collagen and proteoglycans (extracellular matrix)
- Form a fibrous cap over the accumulated lipid and necrotic debris
The mature atheromatous plaque has two key structural components:
- Fibrous cap - SMCs, macrophages, foam cells, lymphocytes, collagen, elastin
- Necrotic (lipid) core - cell debris, cholesterol crystals, foam cells, calcium
The shoulder areas of the plaque (junction between plaque and normal wall) are the most structurally vulnerable - richest in macrophages and most prone to rupture.
- Robbins & Kumar Basic Pathology, p. 314
Stage 4 - Plaque Instability and Acute Coronary Syndromes
Plaque stability depends on the balance between fibrous cap synthesis and degradation. MMPs (matrix metalloproteinases) secreted by activated macrophages degrade the fibrous cap. Three mechanisms can trigger ACS:
| Mechanism | What Happens | Typical Presentation |
|---|---|---|
| Plaque rupture (most common, ~75%) | Fibrous cap tears, exposing lipid core to blood → thrombus | STEMI (complete occlusion) |
| Plaque erosion (~25%) | Superficial endothelial loss, no frank rupture | NSTEMI, more common in women/younger patients |
| Calcified nodule (rare) | Hard calcified deposits breach the cap → sudden occlusion | Variable |
- Sabiston Textbook of Surgery, p. 2485
Risk Factors
| Non-Modifiable | Modifiable |
|---|---|
| Family history (strongest independent factor) | Hyperlipidaemia |
| Increasing age | Hypertension |
| Male sex | Cigarette smoking |
| Genetic disorders (e.g. familial hypercholesterolaemia) | Diabetes mellitus |
| Obesity, sedentary lifestyle | |
| Inflammation (elevated hsCRP) |
Risk factors are multiplicative, not additive. Three simultaneous factors (hyperlipidaemia + hypertension + smoking) increase MI risk 7-fold.
- Robbins & Kumar Basic Pathology, p. 315
Spectrum of Clinical Presentations
Atherosclerosis produces a spectrum of disease depending on how much and how fast the artery is occluded:
Stable Angina → Unstable Angina → NSTEMI → STEMI → Sudden Cardiac Death
(chronic (plaque (partial (complete
fixed stenosis) destabilising) occlusion) occlusion)
- Stable angina: Fixed stenosis (>70% lumen reduction) - chest pain only on exertion, relieved by rest/nitrates
- Unstable angina: Plaque disruption + partial thrombus - pain at rest or minimal exertion, troponin normal
- NSTEMI: Same as UA but with myocardial necrosis (troponin elevated), subendocardial
- STEMI: Complete occlusion, transmural infarction, ST elevation on ECG
- Sudden cardiac death: Lethal arrhythmia (VF) from acute ischaemia or scar-related re-entry
Key Molecular Summary
Risk factors
↓
Endothelial injury → ↓ Nitric Oxide → Vasoconstriction + inflammation
↓
LDL enters intima → oxLDL → Monocyte recruitment → Foam cells → Fatty streak
↓
SMC migration + ECM synthesis → Fibrous cap + Lipid core = Atheroma
↓
Plaque grows → Luminal stenosis → Stable angina (demand ischaemia)
↓
Plaque rupture/erosion → Thrombosis → ACS (supply failure)
- Sabiston Textbook of Surgery; Robbins & Kumar Basic Pathology
Ihd ecg
Finding Sources
Finding Sources
Reading File
Reading File
Reading File
Loading Image
Loading Image
Reading File
Loading Image
Loading Image
Excellent - rich textbook images and content captured. Here is the complete structured answer:
ECG Findings in Ischaemic Heart Disease (IHD) - Full Spectrum
The ECG in IHD varies based on where the patient sits on the ischaemia spectrum - from normal at rest in stable disease, through dynamic changes during angina, all the way to STEMI with Q waves.
1. Stable Angina / Chronic IHD - Resting ECG
The resting ECG can be completely normal even with severe coronary stenosis. When abnormal, look for:
| Finding | Significance |
|---|---|
| ST depression (focal) | Fixed subendocardial ischaemia |
| T-wave inversions | Chronic ischaemic change, old territory |
| Pathological Q waves | Evidence of previous MI (scar) |
| LBBB or left anterior fascicular block | Common conduction disturbance from IHD |
| Ventricular ectopics (VPBs) | Low sensitivity/specificity for CAD |
Key point: A normal resting ECG does NOT exclude significant CAD. The ECG becomes abnormal in ≥50% of patients with normal resting ECGs only during stress or a spontaneous anginal episode.
- Goldman-Cecil Medicine, p. 1736
2. During an Anginal Episode (Dynamic Changes)
The most important feature is dynamic (i.e., it appears with symptoms and resolves with rest/nitrates):
- ST depression - most common finding; represents subendocardial ischaemia
- Transient ST elevation - rare in stable angina; more typical of Prinzmetal (vasospastic) angina
- Pseudonormalization - a previously inverted T wave becomes "normal" during ischaemia; a subtle but important sign of acute ischaemia
3. NSTEMI / Unstable Angina - ECG Changes
ST Depression (Subendocardial Ischaemia)
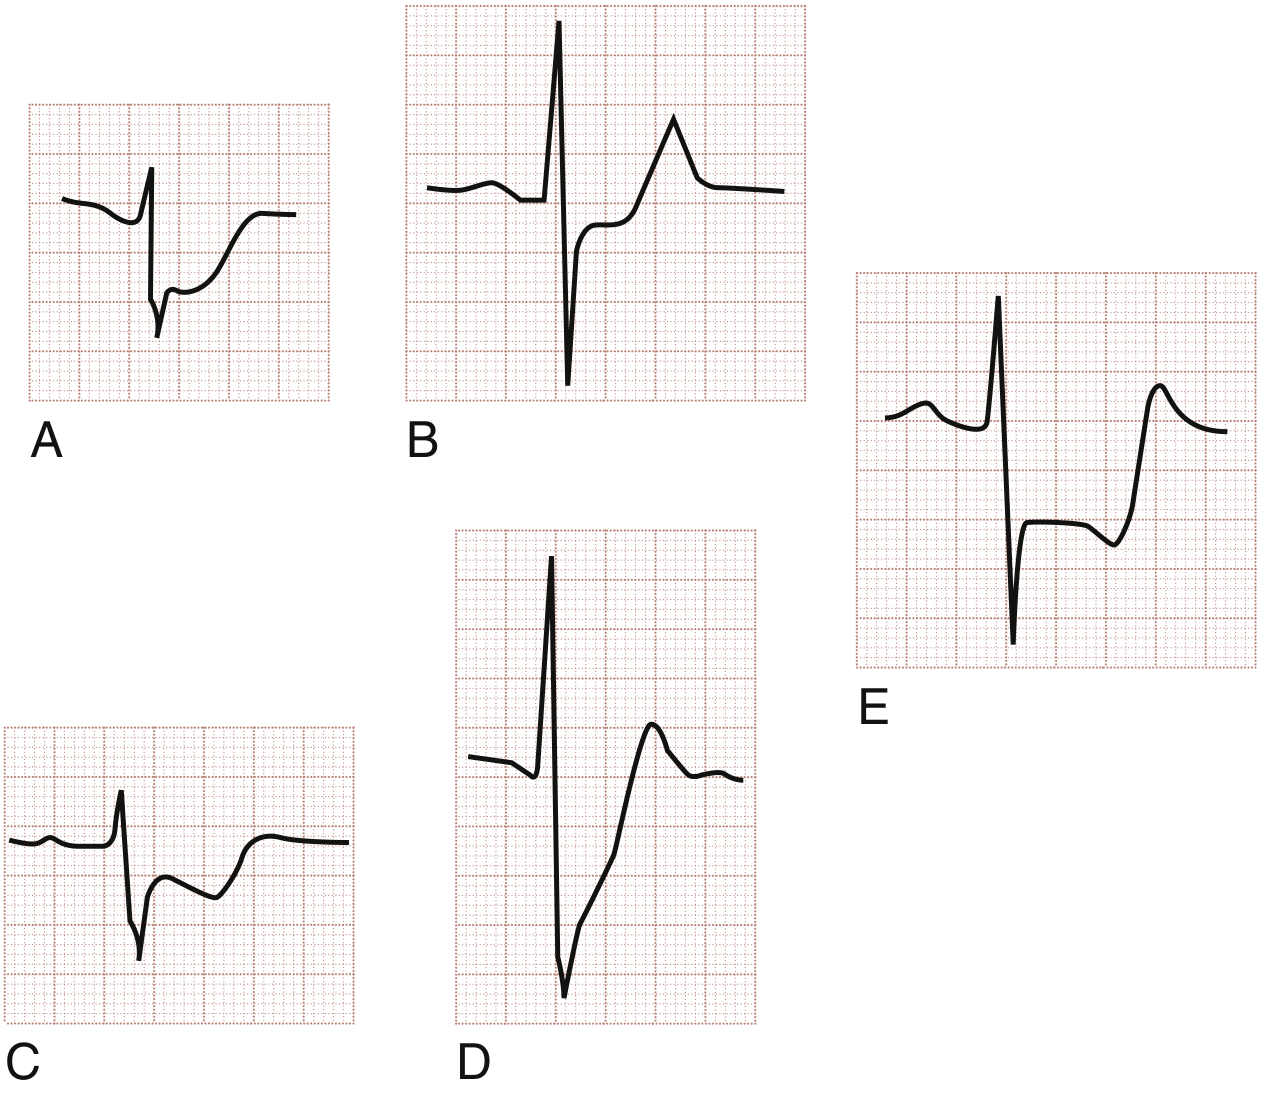
Three morphologies of ST depression in ACS:
- (A) Horizontal ST depression - most specific for ischaemia (e.g., unstable angina)
- (B) Horizontal ST depression - NSTEMI pattern
- (C) Downsloping ST depression - high specificity for ischaemia
- (D) Upsloping ST depression - less specific but can occur in ischaemia
- (E) Reciprocal ST depression - horizontal STD in a remote lead (e.g., inferior lead depression with anterior STEMI)
The most ischaemic patterns are horizontal and downsloping. Upsloping is the least specific.
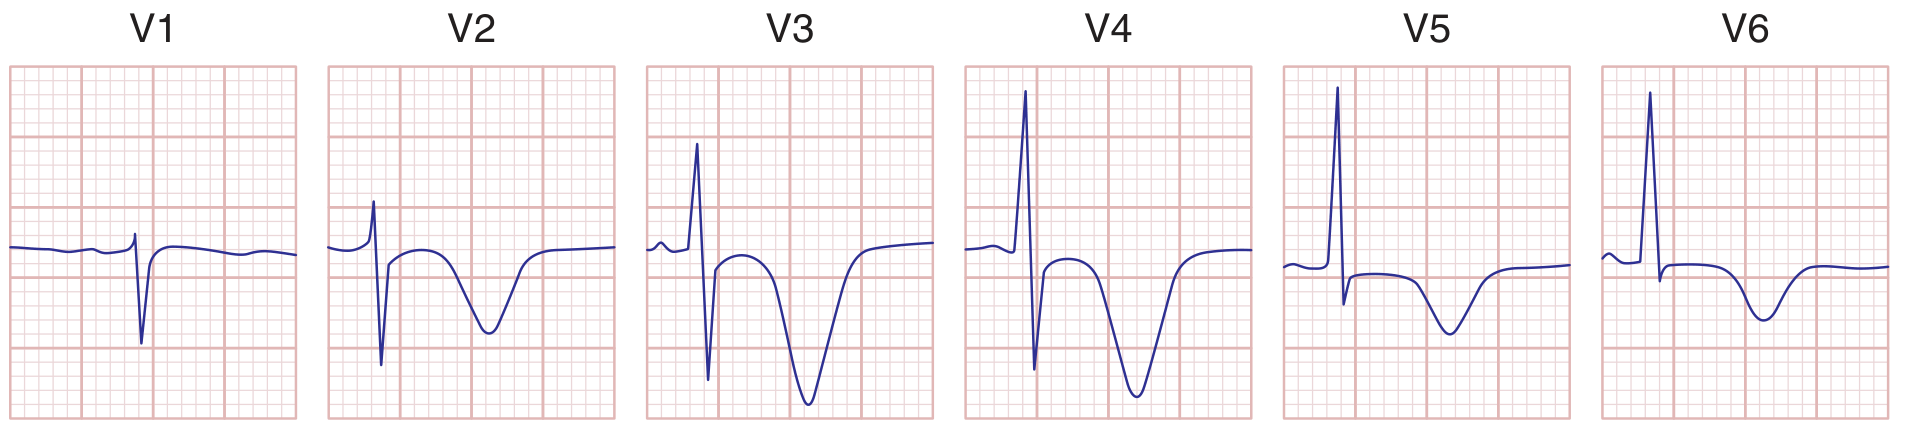
T-Wave Inversions
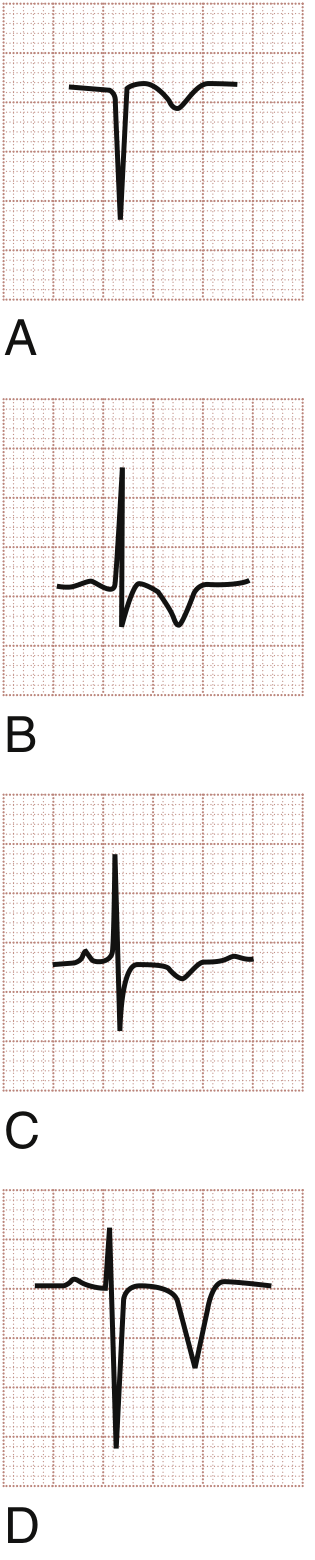
- (A & B) T-wave inversions in ACS - narrow, symmetrical
- (C) T-wave inversion in NSTEMI
- (D) Deep symmetrical T-wave inversions - Wellens syndrome (proximal LAD stenosis)
Classic ACS T-wave inversions are narrow, symmetrical, with an isoelectric preceding ST segment.
- Rosen's Emergency Medicine, p. 1001
Distinction between UA and NSTEMI: Both may show identical ECG changes (or even a normal ECG). The difference is made by serial troponins - elevated in NSTEMI, normal in UA.
4. STEMI - Hyperacute Phase
Hyperacute T waves (earliest sign - minutes after occlusion)
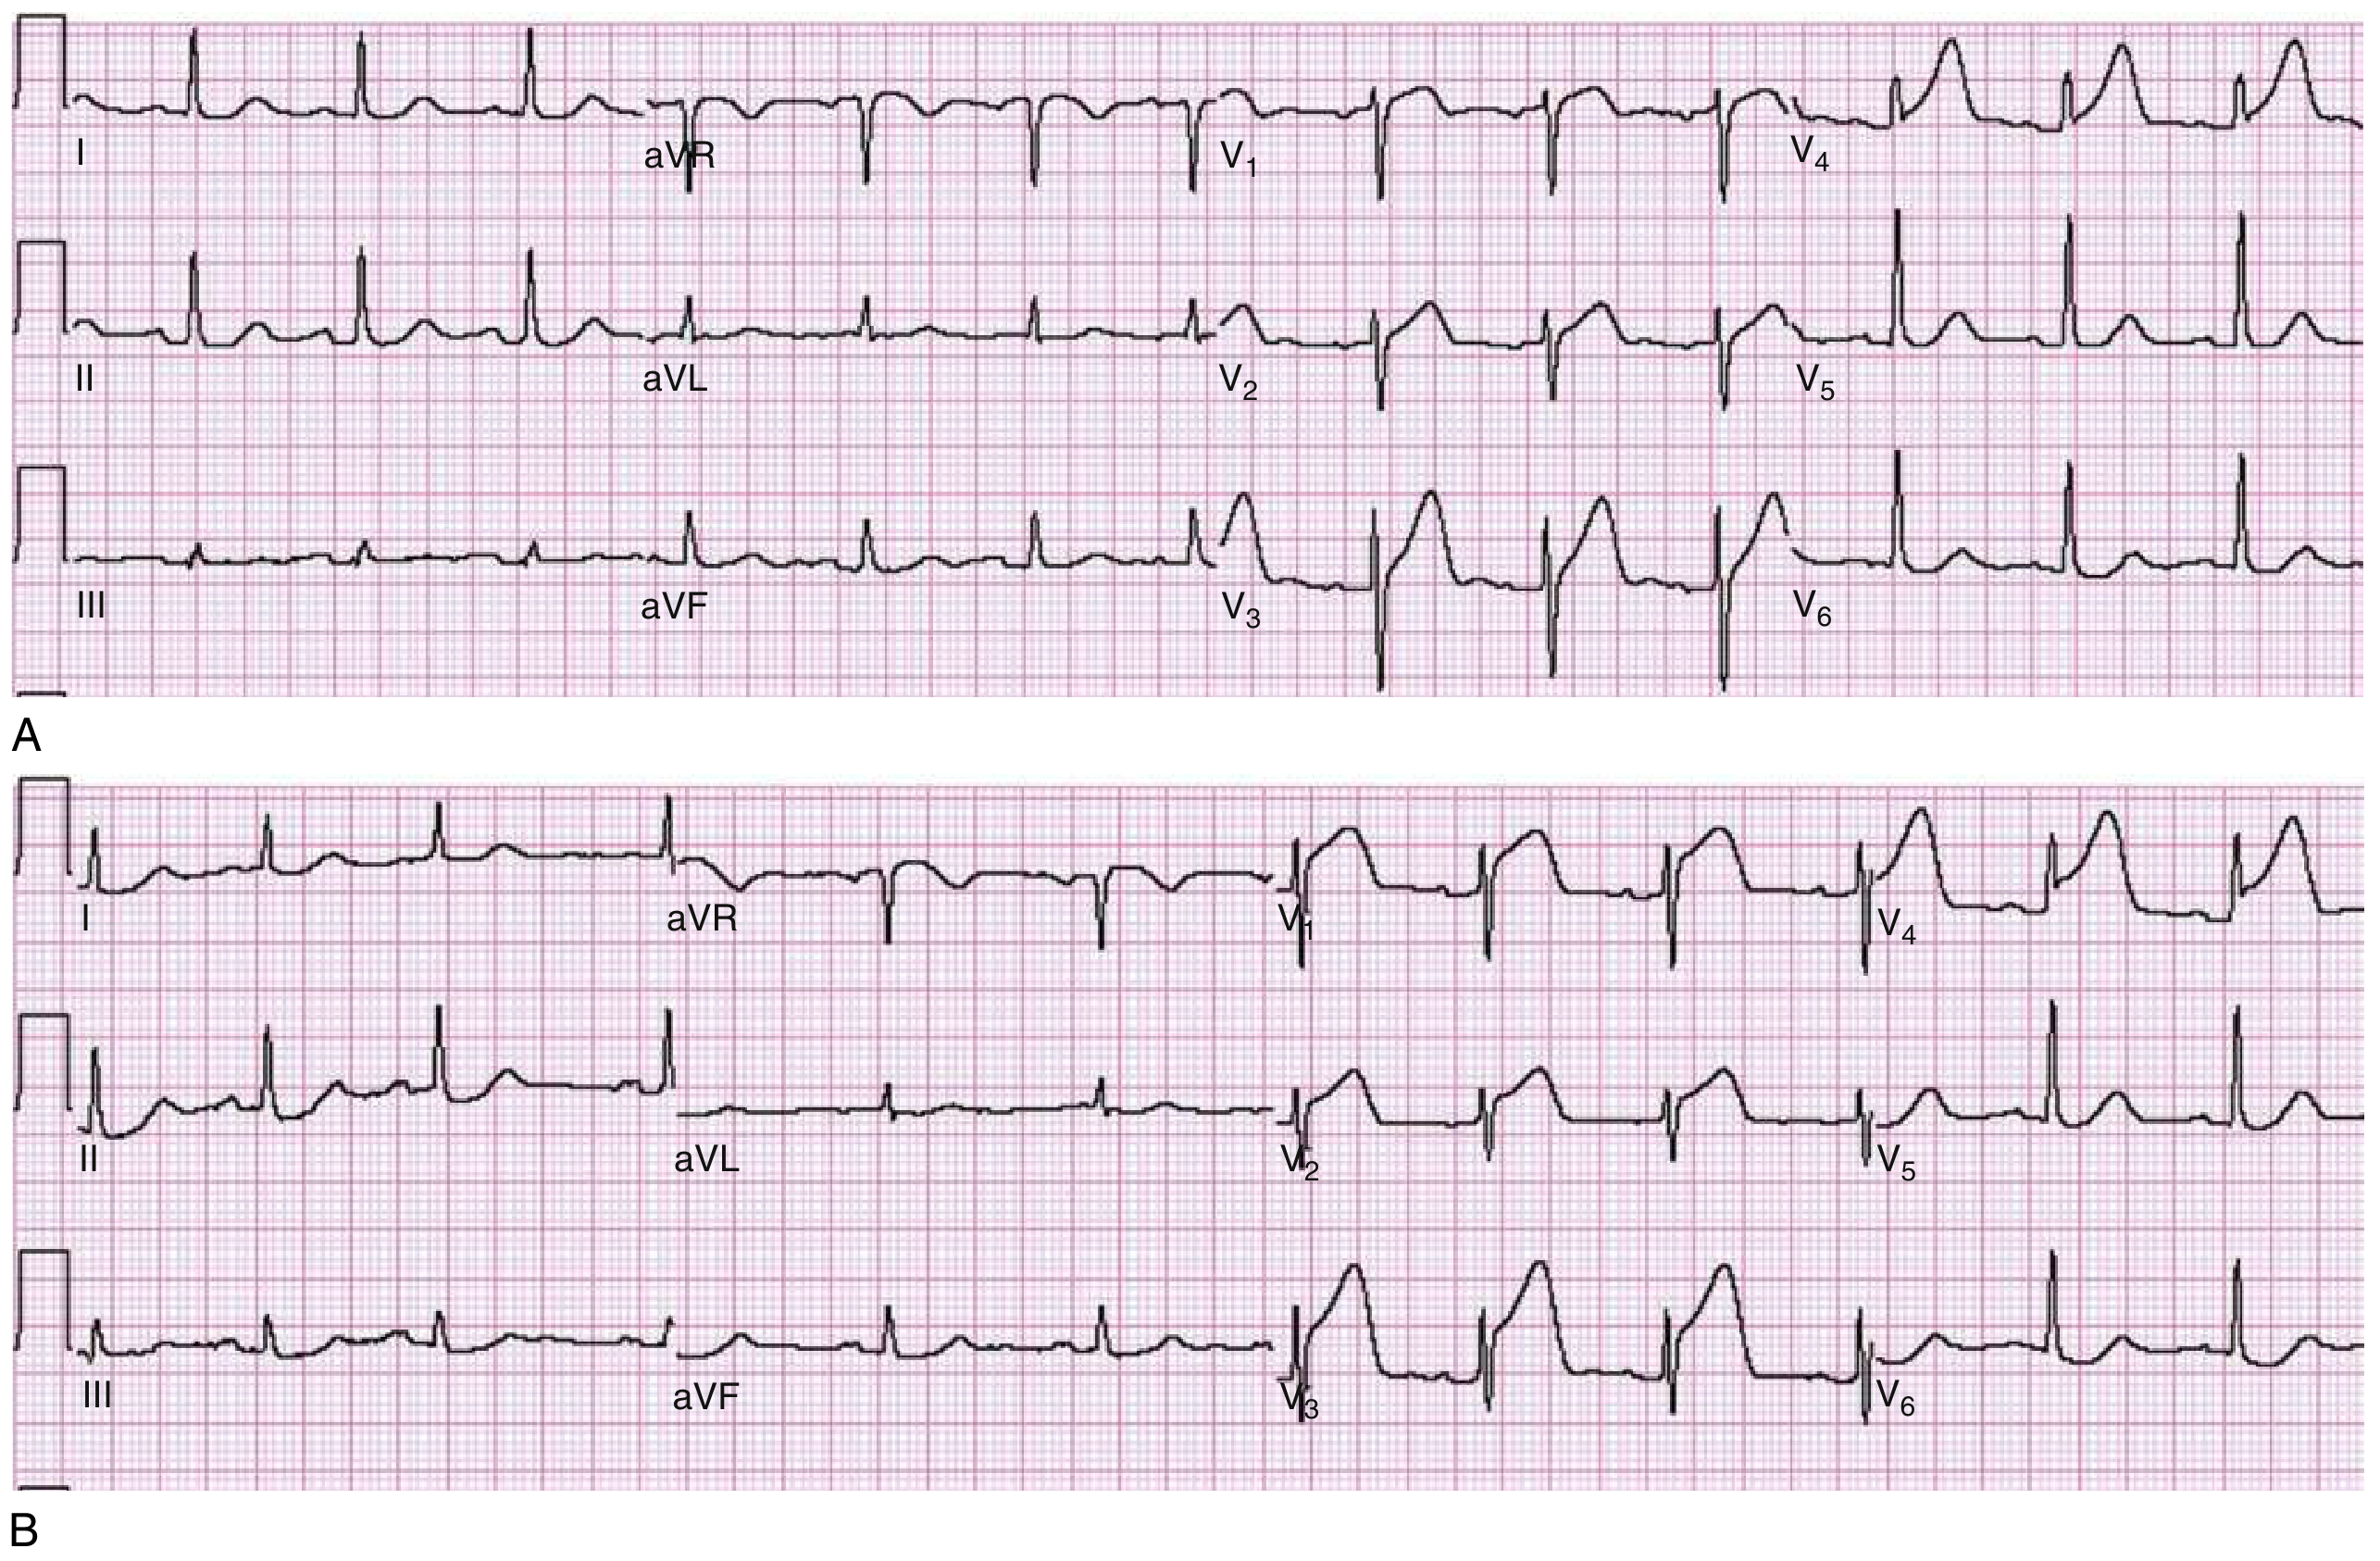
- Panel A: Broad, tall, peaked T waves in V3 and V4 - the hyperacute T waves of early STEMI. ST segment just beginning to rise in V3/V4.
- Panel B: Same patient 30 minutes later - now prominent ST elevation in V1-V4 (fully evolved STEMI).
Hyperacute T waves are broad-based and asymmetric (unlike hyperkalaemia T waves which are narrow and peaked).
5. STEMI - Full Evolution
| Time | ECG Change |
|---|---|
| Minutes | Hyperacute (tall, broad) T waves |
| Hours | ST elevation (convex/tombstone morphology) |
| Hours - Days | Q wave formation + T wave inversion begins |
| Days - Weeks | ST normalises; deep T inversions; Q waves persist |
| Months - permanent | Q waves (scar); T waves may normalise |
ST Elevation Morphology
ST elevation in STEMI is typically flat or convex upward (tombstone/domed). In contrast, benign causes of STE (pericarditis, early repolarisation) tend to show concave (smiley-face) ST elevation - though this is a guideline, not a rule.
STEMI Localisation
| Territory | Leads with STE | Culprit Artery |
|---|---|---|
| Anteroseptal | V1, V2 (±V3) | Proximal LAD |
| Anterior | V1-V4 | LAD |
| Anterolateral | V1-V6, I, aVL | Proximal LAD |
| Lateral | I, aVL | LCx or diagonal |
| Inferior | II, III, aVF | RCA (most) or LCx |
| Posterior | ST depression V1-V3 + tall R in V1 | LCx or RCA |
| Right ventricular | II, III, aVF + V3R-V6R | Proximal RCA |
6. Wellens Syndrome (High-Risk NSTEMI Pattern)
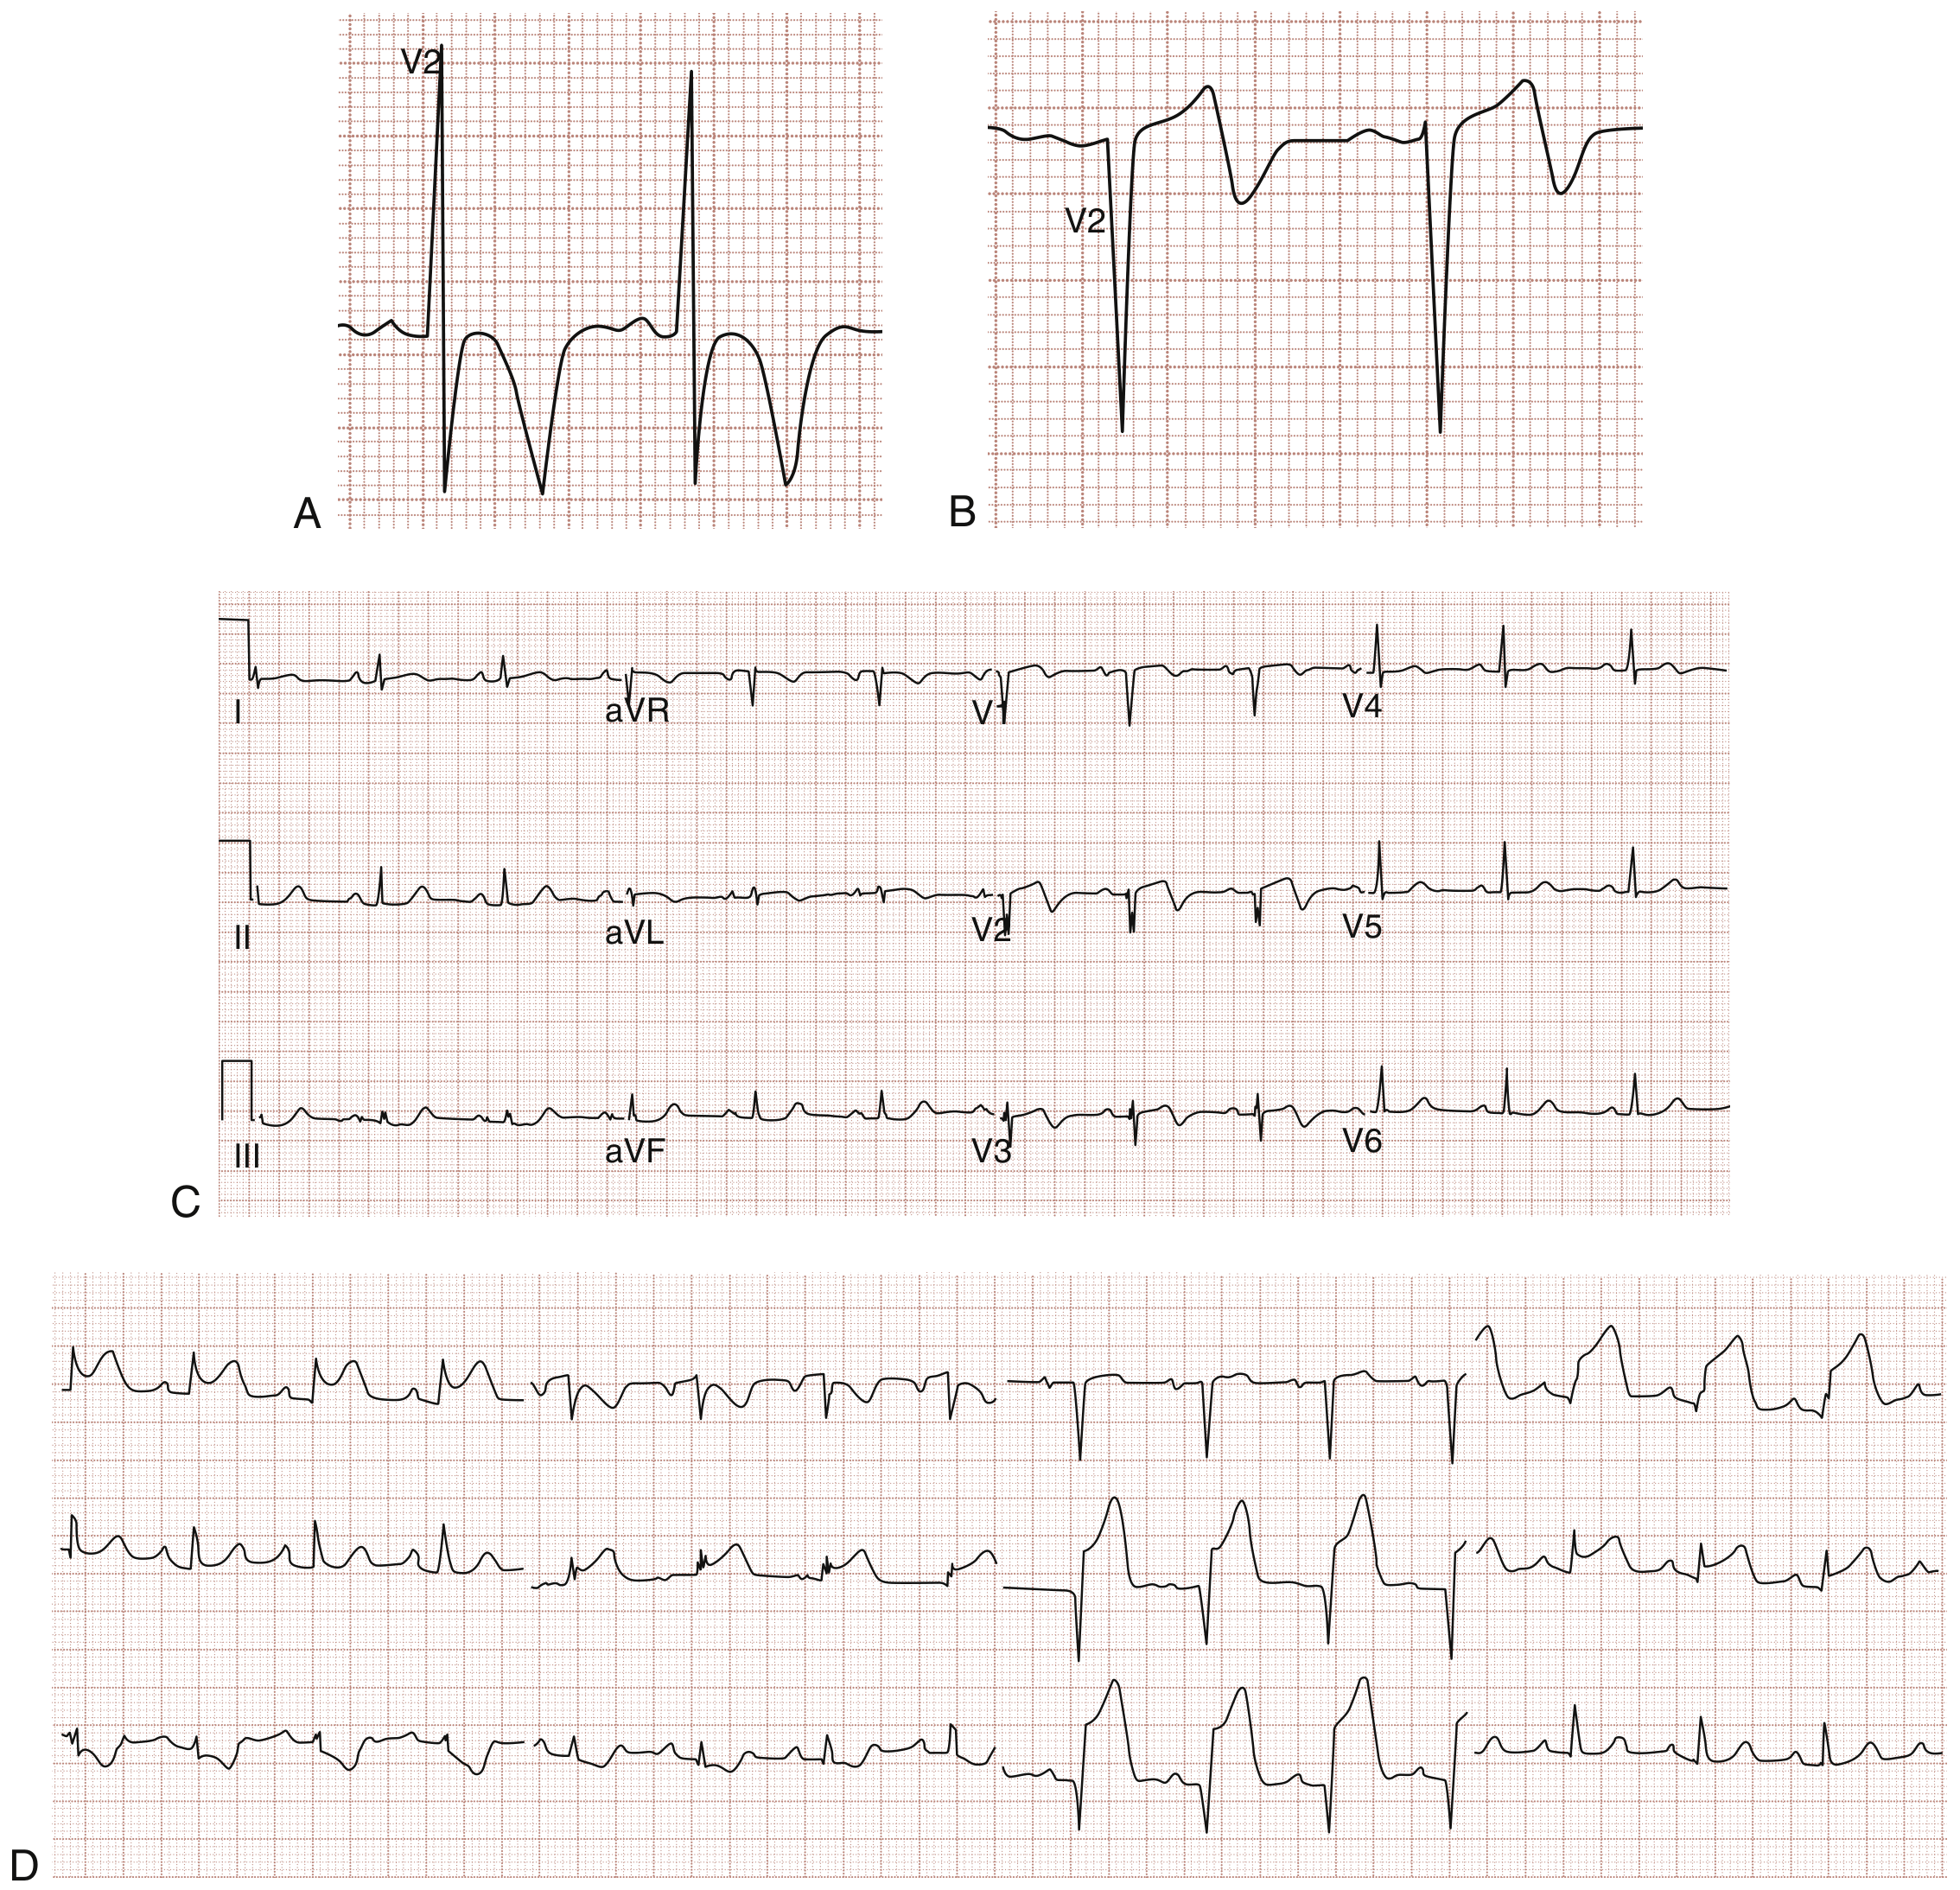
- Type I (75%): Deeply inverted symmetrical T waves in V2/V3 (panel A, B)
- Type II (25%): Biphasic T waves in V2/V3 (panels C, D)
The patient is often pain-free at the time of ECG. This pattern indicates critical proximal LAD stenosis and carries a high risk of imminent anterior STEMI if not revascularised. Do not perform stress testing - it can precipitate complete occlusion.
- Rosen's Emergency Medicine, p. 1002
7. Q Waves - Marker of Necrosis
- Pathological Q wave: ≥ 0.04 sec (1 small box) wide AND ≥ 25% of R-wave amplitude in the same lead
- First appear at 1 hour post-MI but usually complete by 8-12 hours
- Presence of Q waves + STE does not mean reperfusion is too late - always treat STEMI urgently
- Can regress over months, especially after successful reperfusion
8. Reciprocal Changes in STEMI
Reciprocal ST depression in leads opposite to the infarct territory indicates:
- More extensive infarction
- More severe underlying CAD
- Greater haemodynamic compromise
- Higher mortality
Example: Inferior STEMI (STE in II, III, aVF) → reciprocal ST depression in aVL (classically ≥1 mm depression in aVL is very specific for inferior STEMI).
Summary Table - IHD ECG by Syndrome
| Syndrome | Resting ECG | During Episode | Key Feature |
|---|---|---|---|
| Stable angina | Normal or non-specific ST-T | ST depression / T inversion | Dynamic, resolves with rest |
| Prinzmetal angina | Usually normal | Transient ST elevation | Resolves completely, no Q waves |
| Unstable angina | Normal, ST depression, or T inversion | Worsening | Normal troponin |
| NSTEMI | ST depression ± T inversion | Same | Elevated troponin |
| STEMI | Hyperacute T → STE → Q waves | Ongoing | Convex STE ≥1 mm in ≥2 contiguous leads |
| Old MI | Persistent Q waves, T inversions | Stable | Scar; no acute change |
- Rosen's Emergency Medicine; Goldman-Cecil Medicine
This is a shared conversation. Sign in to Orris to start your own chat.