Ecg
Reading File
Asking for Preferences
Asking for Preferences
Finding Sources
Finding Sources
Finding Sources
Finding Sources
Reading File
Reading File
Reading File
Finding Sources
Loading Image
Loading Image
Loading Image
Here is a comprehensive guide to ECG changes in Myocardial Infarction (STEMI/NSTEMI), drawn from Harrison's Principles of Internal Medicine (22nd ed.) and Goldman-Cecil Medicine.
ECG Changes in Myocardial Infarction
The Underlying Mechanism
Acute ischemia causes a current of injury - a voltage gradient between normal and ischemic myocardial zones that manifests as ST-segment deviation on the surface ECG.
Diagram - Current of Injury:
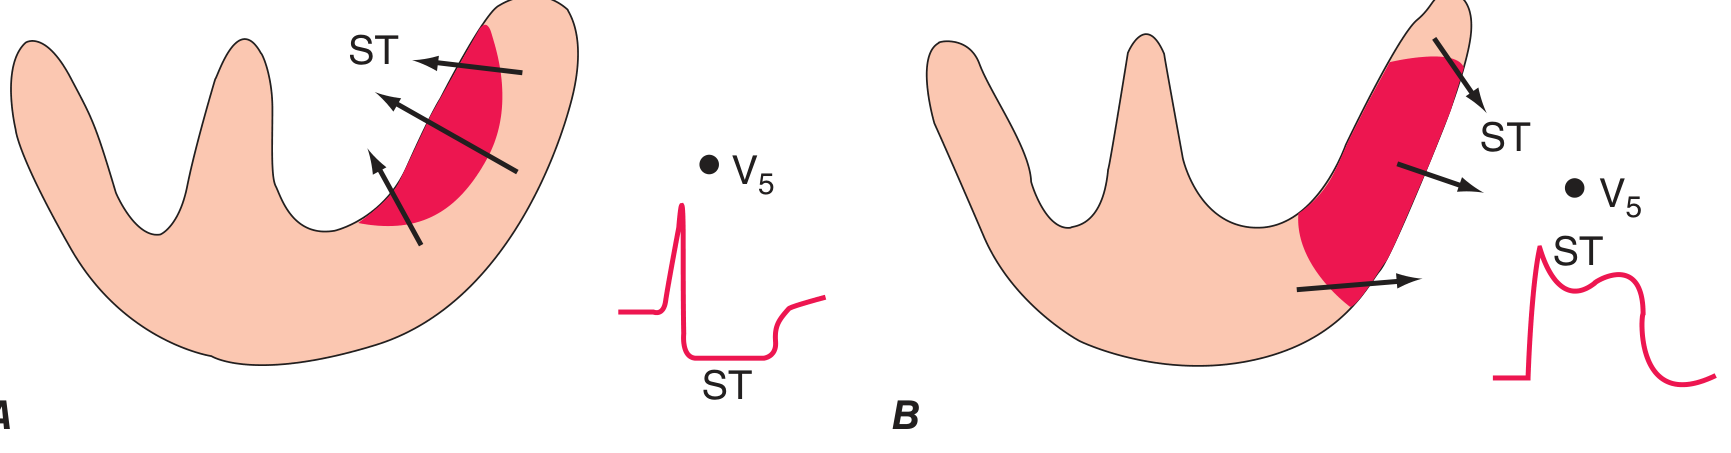
- A (Subendocardial ischemia): ST vector directed inward → overlying leads show ST depression
- B (Transmural/epicardial ischemia): ST vector directed outward → overlying leads show ST elevation
STEMI - ECG Sequence of Changes
The ECG evolves in a predictable sequence:
| Time | ECG Finding |
|---|---|
| Minutes (earliest) | Hyperacute T waves - tall, broad, peaked T waves |
| Hours | ST elevation in leads overlying the infarcted zone |
| Hours - Days | T-wave inversions develop in same leads |
| Hours - Days | Q waves form (indicates transmural necrosis) |
| Weeks - months | ST returns to baseline; Q waves may persist permanently |
Lead Localization of Infarct Territory
| Leads with ST elevation | Territory | Artery |
|---|---|---|
| V1-V4 | Anterior/septal | LAD |
| V4-V6, I, aVL | Lateral | LCx or diagonal |
| II, III, aVF | Inferior | RCA (or LCx) |
| V1-V3 (ST depression = reciprocal) | Posterior | RCA or LCx |
| Right-sided leads (V3R-V4R) | Right ventricle | Proximal RCA |
ECG Sequence - Anterior STEMI (top row = acute, bottom row = evolving):
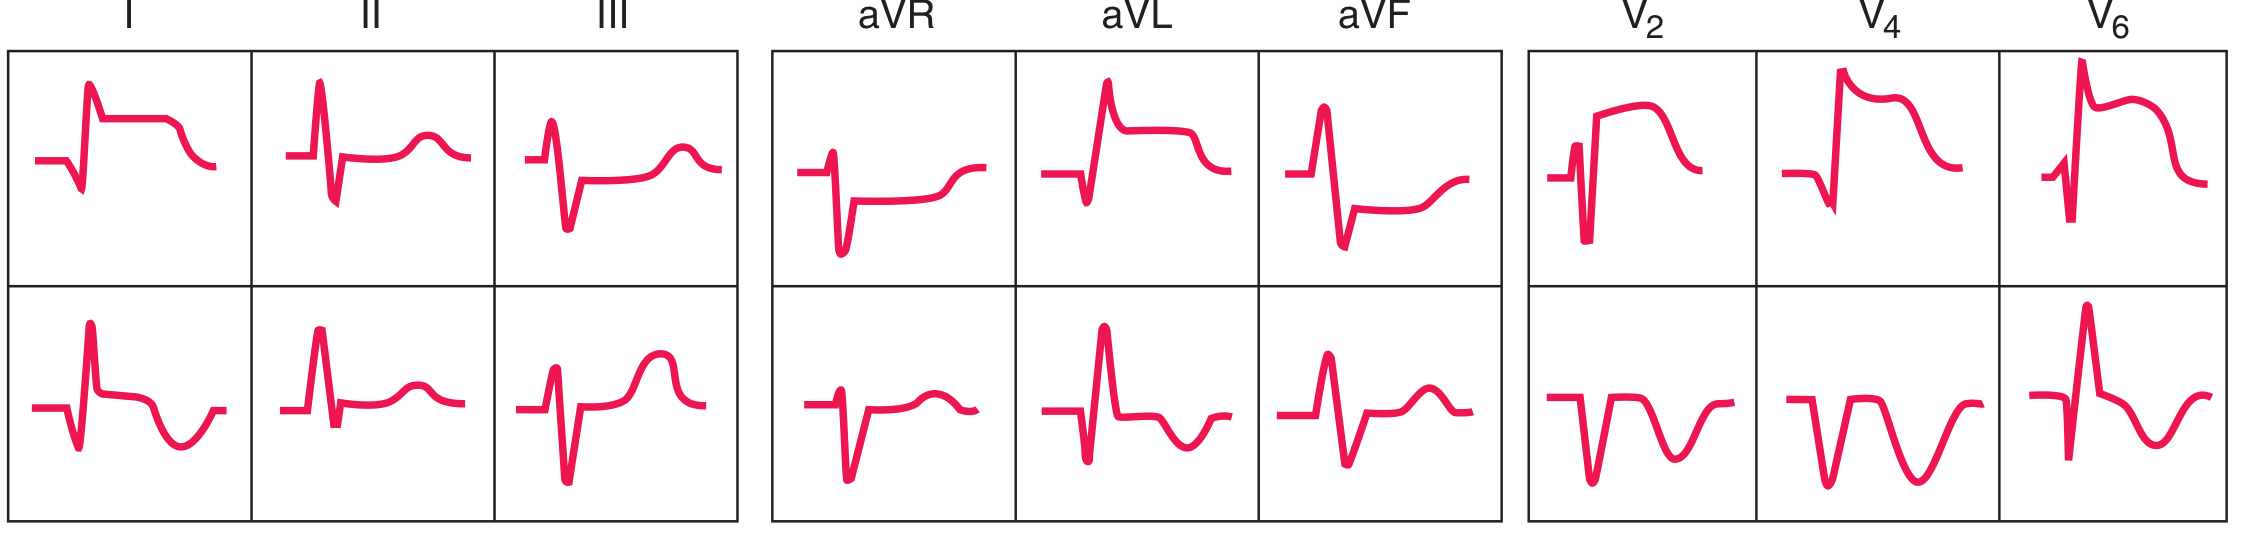
Acute anterior STEMI shows ST elevation in leads I, aVL, V2, V4, V6 with reciprocal ST depression in leads II, III, aVF. In the evolving phase, deep Q waves and T-wave inversions develop in the precordial leads.
ECG Sequence - Inferior STEMI (top row = acute, bottom row = evolving):
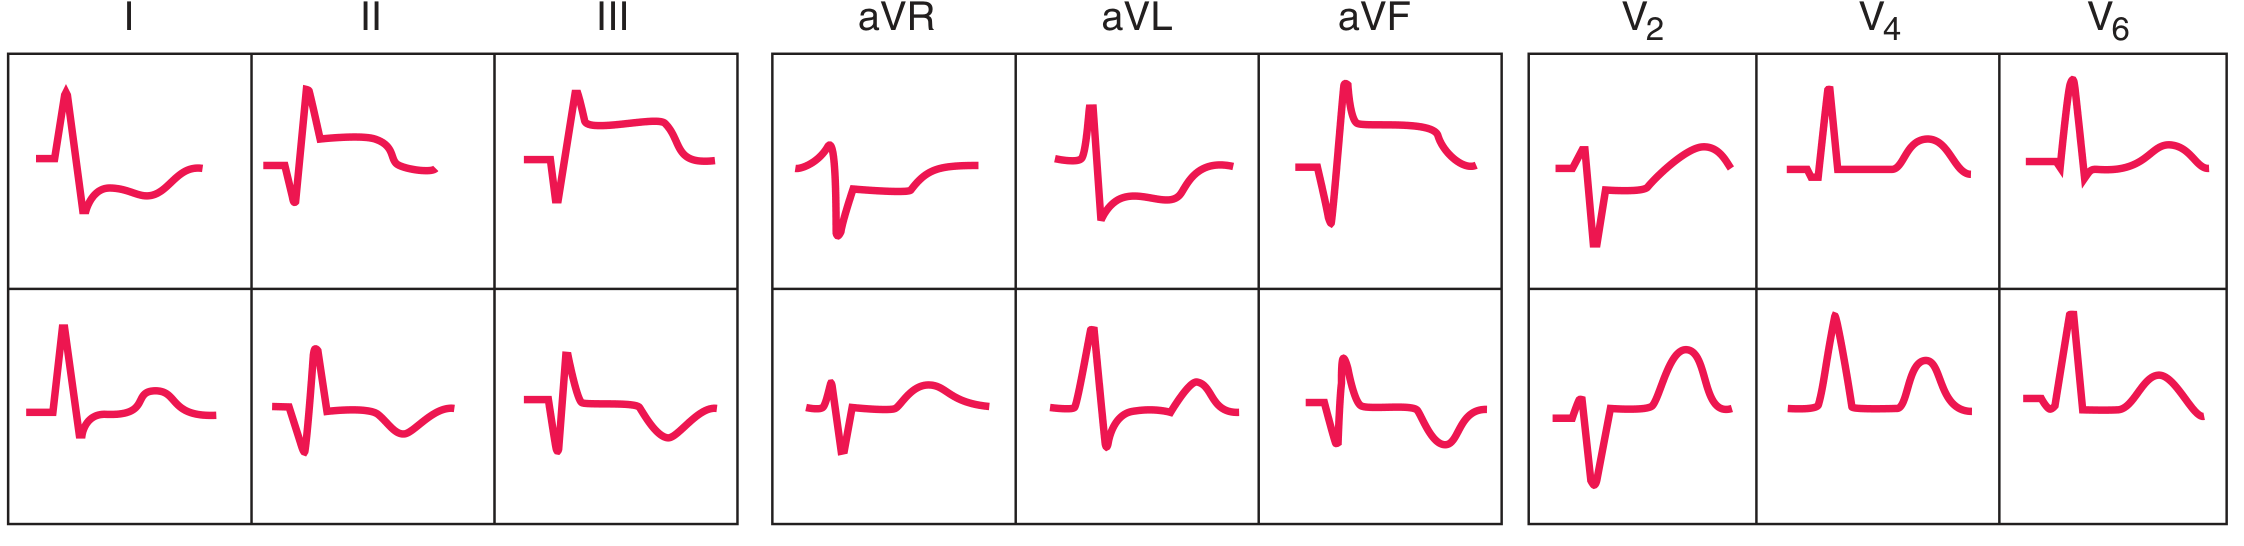
Acute inferior STEMI shows ST elevation in II, III, aVF with reciprocal ST depression in the precordial leads (V1-V6).
Reciprocal Changes
Reciprocal ST depression in leads opposite the infarct zone is an important clue:
- Anterior STEMI → reciprocal ST depression in II, III, aVF
- Inferior STEMI → reciprocal ST depression in V1-V6
- Posterior MI → ST depression in V1-V3 is itself the "equivalent" of ST elevation (no direct overlying leads)
NSTEMI / Non-ST Elevation ACS
- ECG shows ST depression and/or T-wave inversions (no ST elevation)
- Indicates subendocardial ischemia with incomplete coronary occlusion
- A minority of NSTEMI patients eventually develop Q waves ("non-Q-wave MI")
- ST depression in multiple leads with ST elevation only in aVR suggests left main or proximal LAD occlusion
Q Waves
- Pathological Q waves develop when transmural necrosis destroys depolarization forces
- Indicate established (old) MI if seen without acute ST changes
- Loss of posterior/lateral forces may show as reciprocal tall R waves in V1-V2 (posterior MI)
- Important: Q waves can also occur in non-MI conditions - LVH, LBBB, hypertrophic cardiomyopathy, WPW
Key Differential Diagnoses for ST Elevation
Other causes of ST elevation that must be distinguished from STEMI:
- Acute pericarditis (diffuse ST elevation, saddle-shaped, ST elevation in all leads except aVR)
- Left bundle branch block (LBBB)
- Left ventricular hypertrophy
- Brugada pattern (V1-V3)
- Takotsubo syndrome
- Early repolarization (benign variant)
- Acute pulmonary embolism
- Hyperkalemia / hypercalcemia
Key clinical pearl: STEMI is defined by ST elevation in 2 or more contiguous leads (≥2 mm in V1-V3, ≥1 mm elsewhere) and requires emergency reperfusion (primary PCI or thrombolytics) - the ECG is the gating criterion for this decision.
Sources: Harrison's Principles of Internal Medicine, 22nd ed., Ch. 247; Goldman-Cecil Medicine, Ch. 56
Ecg diagram explain with different cases on ECG paper
Finding Sources
Finding Sources
Finding Sources
Finding Sources
Finding Sources
Finding Sources
Reading File
Reading File
Loading Image
Loading Image
Finding Sources
Reading File
Finding Sources
Loading Image
Reading File
Loading Image
Loading Image
Reading File
Finding Sources
Loading Image
Finding Sources
That covers 8 clinical cases with ECG paper diagrams and explanations. Here's a quick summary of what was covered:
| Case | Condition | Key ECG Finding |
|---|---|---|
| 1 | Normal Sinus Rhythm | Regular P-QRS-T, rate 60-100, PR 0.12-0.20 sec |
| 2 | Anterior STEMI | ST elevation V1-V4, reciprocal depression in II, III, aVF |
| 3 | Posterior MI | ST depression V1-V3, tall R waves (mirror image) |
| 4 | MI Evolution Over Time | Normal → ST elevation → T inversion → Q wave |
| 5 | Atrial Fibrillation | No P waves, irregularly irregular QRS |
| 6 | Heart Blocks (1st/2nd/3rd) | PR changes → dropped QRS → complete dissociation |
| 7 | Hyperkalemia | Peaked T → no P → wide QRS → sine wave |
| 8 | Current of Injury (mechanism) | Subendocardial = ST depression; Transmural = ST elevation |
Would you like me to go deeper on any specific case - for example, how to calculate the cardiac axis, bundle branch blocks (LBBB/RBBB), or a specific arrhythmia like VT/VF?
This is a shared conversation. Sign in to Orris to start your own chat.