
Mechanism of pcm contraindications dose indications how temp increase body in easy way detail
paracetamol PCM mechanism of action antipyretic analgesic COX inhibition
paracetamol acetaminophen mechanism of action fever prostaglandin hypothalamus diagram
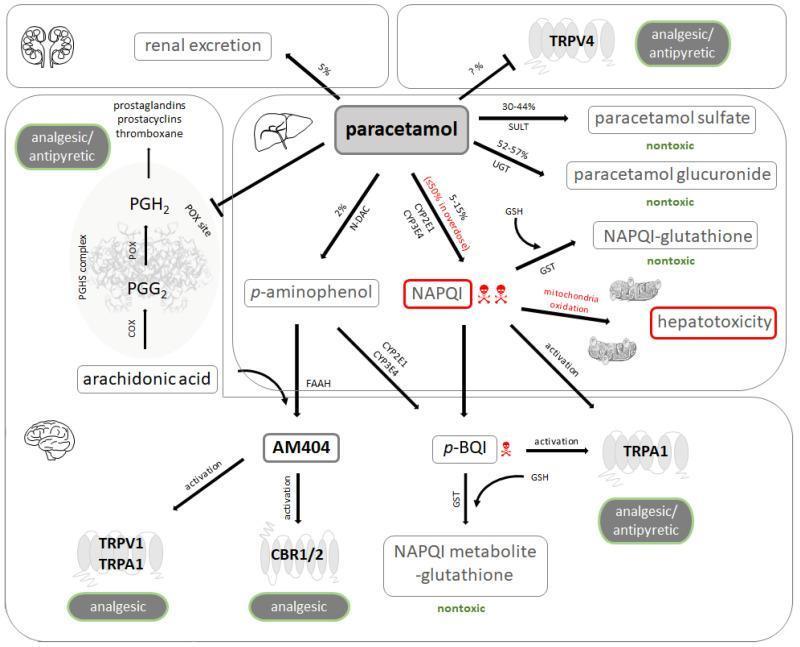
A comprehensive pharmacology and pathophysiology diagram illustrating the metabolic pathways and mechanism of action of paracetamol (acetaminophen). The schematic details three primary metabolic routes in the liver: glucuronidation (via UGT) and sulfation (via SULT) producing nontoxic metabolites for renal excretion, and a cytochrome P450-mediated pathway (CYP2E1, CYP3A4) forming the toxic intermediate N-acetyl-p-benzoquinone-imine (NAPQI). It depicts the detoxification of NAPQI by glutathione (GSH) and the adverse effects of excessive NAPQI, including mitochondrial oxidation and hepatotoxicity. The diagram also shows the N-deacetylation of paracetamol to p-aminophenol, leading to the formation of AM404, which activates TRPV1, TRPA1, and CBR1/2 receptors to provide analgesia. Furthermore, it illustrates the inhibition of the prostaglandin endoperoxide H synthase (PGHS) complex at the peroxidase (POX) site, preventing the conversion of PGG2 to PGH2, thereby explaining the drug's antipyretic and analgesic effects. Target receptors such as TRPV4 are also noted as potential sites of pharmacological interaction.
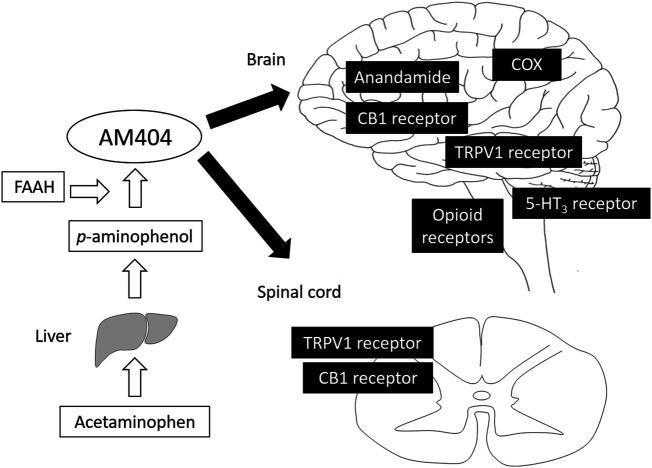
A pathophysiology diagram illustrating the central analgesic mechanisms of acetaminophen (paracetamol). The schematic outlines a metabolic pathway starting from the liver, where acetaminophen is converted into p-aminophenol. In the presence of the enzyme fatty acid amide hydrolase (FAAH), p-aminophenol is further metabolized into the active compound AM404 (N-acylphenolamine). The diagram demonstrates that AM404 acts on both the brain and the spinal cord through several neurotransmitter systems and receptors. In the brain, AM404 is shown to interact with cyclooxygenase (COX), anandamide, cannabinoid 1 (CB1) receptors, transient receptor potential vanilloid 1 (TRPV1) receptors, opioid receptors, and 5-HT3 receptors. In the spinal cord cross-section, the mechanism focuses on interactions with TRPV1 and CB1 receptors. The visual uses anatomical illustrations of the liver, brain, and spinal cord linked by arrows to signify the metabolic progression and central site of action, highlighting the drug's complex pharmacodynamics beyond simple COX inhibition.
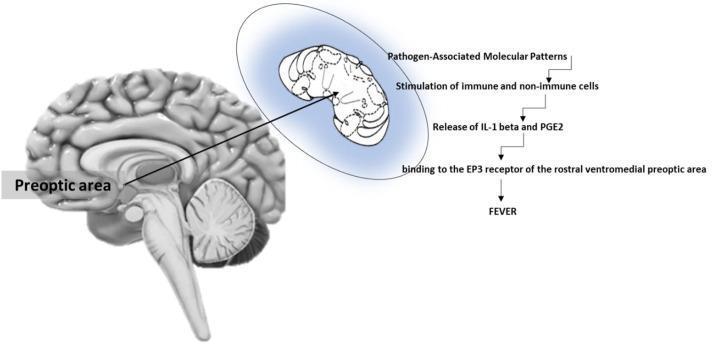
This medical illustration depicts the pathophysiology of fever induction at the brain level. On the left, a sagittal view of the human brain identifies the preoptic area (POA) within the hypothalamus, positioned anterior to the brainstem. An inset zoom highlights the rostral ventromedial preoptic area (rvmPOA) as the specific target for pyrogenic mediators. To the right, a sequential flowchart outlines the molecular mechanism: 1) Exposure to Pathogen-Associated Molecular Patterns (PAMPs); 2) Stimulation of immune and non-immune cells; 3) Release of pro-inflammatory cytokines, specifically Interleukin-1 beta (IL-1 beta), and Prostaglandin E2 (PGE2); 4) Binding of PGE2 to EP3 receptors in the rvmPOA. This signaling cascade leads to the clinical manifestation of fever. The diagram serves as an educational summary of the endocrine and neural pathways involved in thermoregulation and the systemic inflammatory response, highlighting the critical role of the hypothalamus and EP3 receptor signaling in pyrogenesis.
Paracetamol (PCM / Acetaminophen) - Complete Guide
🔬 What is PCM?
- Analgesic (pain reliever) + Antipyretic (fever reducer)
- Does NOT have anti-inflammatory activity (unlike NSAIDs)
- Chemical formula: C₈H₉NO₂
🔥 How Does Fever Occur? (Easy Explanation First)
Infection/Injury
      ↓
Immune cells release pyrogens (IL-1β, TNF, IL-6)
      ↓
These reach the hypothalamus (preoptic area)
      ↓
Hypothalamus activates COX-2 enzyme
      ↓
COX-2 makes Prostaglandin E2 (PGE2)
      ↓
PGE2 binds EP3 receptors in hypothalamus
      ↓
Thermostat is SET HIGHER (e.g., from 37°C to 39°C)
      ↓
Body responds: shivering, vasoconstriction → Temperature RISES
⚙️ Mechanism of Action of PCM
1. COX Inhibition (Primary - but unique mechanism)
- PCM inhibits COX enzymes (both COX-1 and COX-2) but differently from NSAIDs
- NSAIDs block the active site of COX
- PCM acts on the peroxidase (POX) site as a reducing co-substrate
- This reduces PGE2 synthesis → hypothalamus thermostat resets back to normal → fever drops
- The inhibition is tissue/cell-type dependent: works in brain/vascular endothelium, NOT in platelets or activated macrophages (explains why it has no anti-inflammatory effect)
2. AM404 Metabolite Pathway
- PCM → metabolized in liver → p-aminophenol → in brain (with FAAH enzyme) → AM404
- AM404 activates:
- CB1 receptors (cannabinoid) → pain relief
- TRPV1 channels → analgesia
- Reduces COX-1 expression and PGE2 production
3. NAPQI Metabolite
- Another metabolite is NAPQI (N-acetyl-p-benzoquinone imine)
- May also activate TRPA1 channels → analgesic effect
- BUT NAPQI is hepatotoxic in excess (key concern in overdose)
4. Serotonergic Pathway
- PCM potentiates the descending serotonergic inhibitory pathway in the spinal cord → reduces pain signal transmission
How PCM Reduces Fever (Simple Flow)
PCM taken orally
      ↓
Crosses blood-brain barrier
      ↓
Inhibits COX enzyme in hypothalamus
      ↓
Less PGE2 produced
      ↓
EP3 receptors no longer stimulated
      ↓
Hypothalamic thermostat resets to 37°C
      ↓
Vasodilation + sweating → Heat lost → Fever breaks
💊 Indications
| Condition | Notes |
|---|---|
| Fever (pyrexia) | First-line antipyretic for all ages |
| Mild to moderate pain | Headache, toothache, myalgia, arthralgia |
| Post-operative pain | Used IV or oral |
| Dysmenorrhea | Menstrual pain |
| Cold & flu symptoms | Combined with antihistamines/decongestants |
| Cancer pain | WHO analgesic ladder - Step 1 |
| Osteoarthritis | Mild/moderate joint pain |
| Pediatric fever & pain | Preferred over aspirin (no Reye's syndrome risk) |
📏 Dose
| Patient | Standard Dose | Frequency | Max Daily Dose |
|---|---|---|---|
| Adults | 500 mg - 1000 mg | Every 4-6 hours | 4 g/day |
| Children (6-12 yrs) | 250-500 mg | Every 4-6 hours | Based on weight |
| Children (<6 yrs) | 10-15 mg/kg/dose | Every 4-6 hours | 60 mg/kg/day |
| Elderly / Liver disease | 500 mg | Every 6-8 hours | 2 g/day (reduced) |
| IV (hospital) | 1 g | Every 6 hours | 4 g/day |
Fatal dose: Ingestion of 20 tablets of 500 mg (= 10g) is usually fatal within 3-5 days due to liver failure. - [Parikh's Textbook of Forensic Medicine, p. 714]
⛔ Contraindications
| Contraindication | Reason |
|---|---|
| Severe hepatic (liver) impairment | PCM is metabolized by liver; NAPQI accumulates → hepatotoxicity |
| Active liver disease | Same reason - cannot safely detoxify NAPQI |
| Severe renal impairment | Metabolites accumulate |
| Hypersensitivity to paracetamol | Allergic reactions (rare) |
| Chronic alcohol use / alcoholism | CYP2E1 is induced → more NAPQI produced → liver damage even at normal doses |
| G6PD deficiency | Risk of hemolytic anemia |
| Severe malnutrition / low glutathione | Cannot neutralize NAPQI |
⚠️ Important Precautions
- Alcohol users: Even therapeutic doses can cause hepatotoxicity if used with alcohol
- Multiple PCM products: Many OTC cold/flu medications contain PCM - accidental overdose is common
- Warfarin: PCM potentiates anticoagulant effect of warfarin - monitor INR
- Fasting patients: Low glutathione levels increase NAPQI toxicity risk
- Pregnancy: Generally considered safe (Category B), but prolonged high-dose use linked to adverse outcomes in some studies
☠️ Toxicity / Overdose
| Stage | Time | Features |
|---|---|---|
| Stage 1 - GI | 0-24 hrs | Nausea, vomiting - deceptively mild, patient appears fine |
| Stage 2 - Latent | 24-72 hrs | Anorexia, epigastric pain, liver enzymes rise, patient relatively pain-free |
| Stage 3 - Liver failure | 3-5 days | Fulminant hepatic failure, GI hemorrhage, cerebral edema, renal tubular necrosis, cardiomyopathy |
- Normal dose: NAPQI is neutralized by glutathione (GSH) in the liver
- Overdose: Glutathione stores depleted → NAPQI accumulates → centrilobular hepatic necrosis
🧪 Metabolism Summary
                    ← 60% Glucuronidation → nontoxic
PCM
                    ← 30% Sulfation → nontoxic

                    ← 10% via CYP2E1/CYP3A4 → NAPQI
                                    ↓
                    Glutathione present → safe products excreted
                    Glutathione depleted → LIVER DAMAGE ☠️
Key Differentiator from NSAIDs
| Feature | PCM | NSAIDs (e.g., Ibuprofen) |
|---|---|---|
| Analgesic | ✅ | ✅ |
| Antipyretic | ✅ | ✅ |
| Anti-inflammatory | ❌ | ✅ |
| GI ulcers risk | ❌ (low) | ✅ |
| Platelet inhibition | ❌ | ✅ |
| Renal prostaglandins | Minimal effect | Inhibits |
| Liver toxicity (overdose) | ✅ major concern | Less so |
- Firestein & Kelley's Textbook of Rheumatology, p. 1176-1180
- Parikh's Textbook of Medical Jurisprudence Forensic Medicine and Toxicology, p. 714
- Ayoub SS (2021): Paracetamol - a familiar drug with an unexplained mechanism of action - Temperature journal review
Mechanism of phenytoin how seizurs cause contraindications indicates how munch to give how munch dilute
phenytoin mechanism of action sodium channel seizure dose dilution IV administration
phenytoin sodium channel mechanism action potential seizure neuron diagram
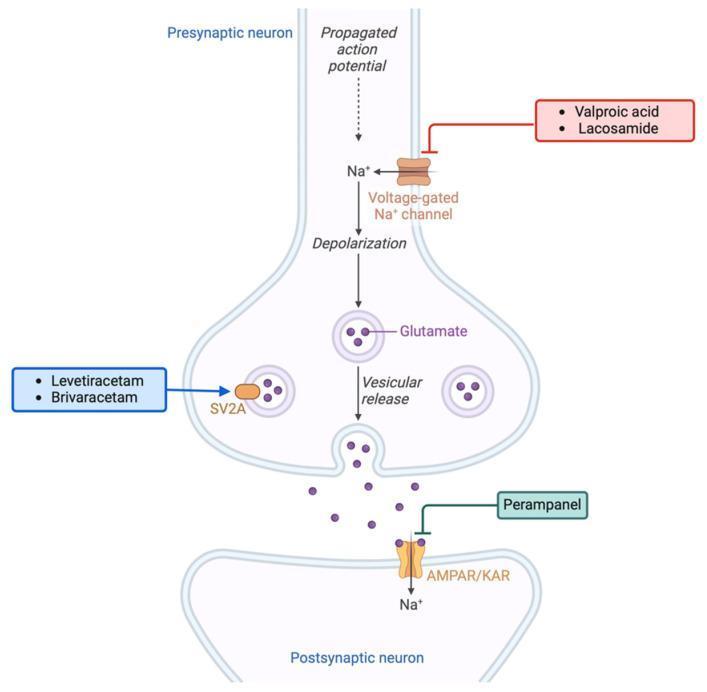
This pathophysiology diagram illustrates the excitatory glutamatergic synapse and the mechanism of action of various antiseizure medications (ASMs). The presynaptic neuron shows a propagated action potential leading to sodium (Na+) influx via voltage-gated Na+ channels and subsequent depolarization. This triggers the vesicular release of glutamate into the synaptic cleft. On the postsynaptic neuron, glutamate binds to AMPA/kainate receptors (AMPA/KAR), resulting in further Na+ influx. The diagram highlights three pharmacological intervention points: (1) Valproic acid and Lacosamide inhibiting voltage-gated Na+ channels; (2) Levetiracetam and Brivaracetam targeting the Synaptic Vesicle Protein 2A (SV2A) to modulate vesicular release; and (3) Perampanel acting as an antagonist at the postsynaptic AMPA/KAR receptors. This visual summary explains how these medications regulate neuronal hyperexcitability, which is clinically relevant in both epilepsy management and the treatment of peritumoral hyperexcitability in glioma patients.
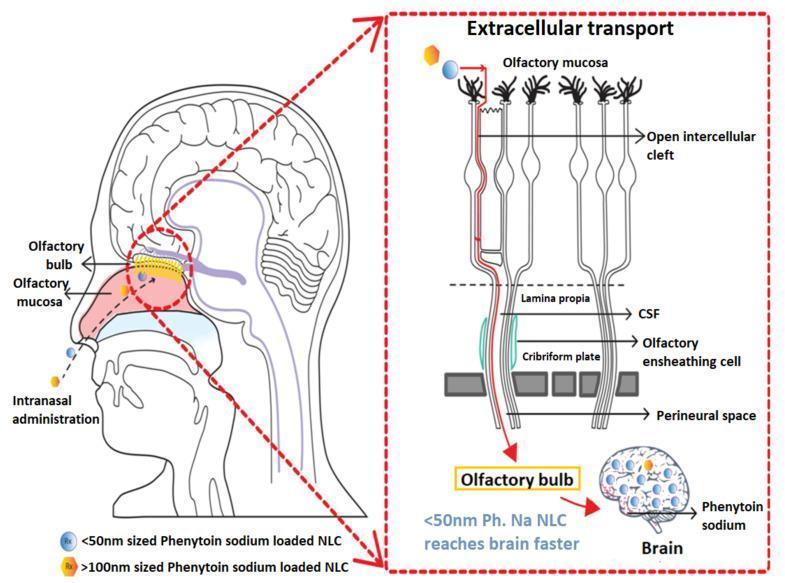
A medical schematic diagram illustrating the direct nose-to-brain delivery of phenytoin sodium loaded Nanostructured Lipid Carriers (NLCs) via the olfactory epithelial pathway. The illustration is divided into a sagittal anatomical view of the human head and a detailed inset of the cellular transport mechanism. The primary anatomical view shows the route of intranasal administration with NLCs depositing on the olfactory mucosa. The inset highlights the extracellular transport mechanism through the olfactory epithelium. It depicts NLCs of different sizes (<50nm and >100nm) moving through open intercellular clefts in the olfactory mucosa, traversing the lamina propria, and crossing the cribriform plate. The diagram shows the particles being transported through the perineural space and along olfactory ensheathing cells to reach the olfactory bulb and eventually the brain. Annotations specify that the smaller <50nm phenytoin sodium NLCs reach the brain faster than larger particles. This educational visual explains the pathophysiology and pharmacology of bypass-blood-brain-barrier drug delivery systems for acute seizure management.
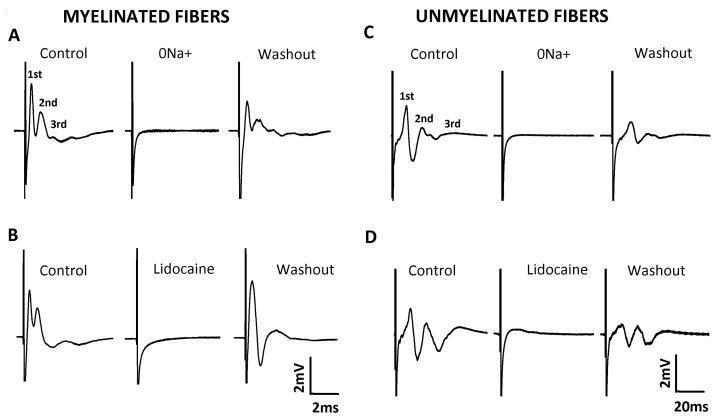
This physiological diagram illustrates extracellular recordings of compound action potentials (CAPs) from myelinated and unmyelinated nerve fibers, categorized into four panels (A-D). Panels A and B display CAP traces for myelinated fibers, characterized by high conduction velocities (scale bar: 2 ms). Panels C and D show unmyelinated fibers with slower conduction (scale bar: 20 ms). In the 'Control' conditions, three distinct components (1st, 2nd, and 3rd) are identified, representing different fiber populations. The experiment demonstrates the sodium-dependency of these potentials: removing extracellular sodium (0Na+) in panels A and C or applying the local anesthetic Lidocaine (1 mM) in panels B and D results in the total abolition of the CAP signals. The 'Washout' phases show partial or near-complete recovery of the action potential waveforms, confirming the viability of the nerve preparation and the reversible nature of the blockade. This visual provides clinical relevance for understanding nerve conduction, the mechanism of action of sodium channel blockers, and the electrophysiological differences between fiber types.
https://www.ncbi.nlm.nih.gov/books/NBK551520
Phenytoin (PHT) - Complete Easy Guide
What is Phenytoin?
- Chemical name: 5,5-diphenylhydantoin (diphenylhydantoin / DPH)
- Class: Antiepileptic / Anticonvulsant drug
- Oldest non-sedating antiseizure drug - used since 1938
- Also acts as a Class IB antiarrhythmic
⚡ How Do Seizures Happen? (Easy Explanation)
NORMAL NEURON FIRING:
Stimulus → Na+ channels OPEN → Na+ rushes IN → Action potential fires
→ Na+ channels go INACTIVE (refractory period) → Channel RESETS → Ready again
(Normal firing rate: ~80 times/second)

SEIZURE:
Na+ channels RESET TOO FAST
→ Neuron fires again immediately
→ High-frequency repetitive firing (100s/second)
→ Spreads to surrounding neurons
→ SEIZURE: uncontrolled electrical storm in the brain
- Imbalance between excitation (glutamate, Na+) and inhibition (GABA, Cl-)
- Genetic mutations in ion channels
- Head injury, infection, metabolic disturbance, stroke, tumors, drugs
⚙️ Mechanism of Action of Phenytoin
Step-by-Step:
Na+ channel has 3 states:
  [CLOSED] → (stimulus) → [OPEN] → [INACTIVE] → [CLOSED again]
                                         ↑
                            Phenytoin BINDS HERE
                         (stabilizes the INACTIVE state)
- Phenytoin binds to Na+ channels in their INACTIVE state
- It slows down the recovery - channels stay inactive (refractory) longer
- This is use-dependent - the more a neuron fires, the more phenytoin works on it
- It is also voltage-dependent - works better on depolarized (over-excited) membranes
- Result: High-frequency repetitive firing is blocked but normal low-frequency firing is preserved
- Seizure spread is stopped at the source without putting the brain to sleep
"Phenytoin limits the repetitive firing of action potentials evoked by a sustained depolarization... this effect is mediated by a slowing of the rate of recovery of voltage-activated Na+ channels from inactivation." - Goodman & Gilman's, p. 411
- Also inhibits voltage-gated calcium channels → reduces neurotransmitter release at synapses
- At higher doses (toxic): reduces spontaneous neuronal activity and enhances GABA responses
💊 Indications (When to Use)
| Indication | Notes |
|---|---|
| Focal (partial) seizures | First-line / effective |
| Focal-to-bilateral tonic-clonic seizures | Very effective |
| Generalized tonic-clonic seizures | Effective |
| Status epilepticus | IV loading dose (emergency) |
| Cardiac arrhythmias | Class IB; especially digoxin-induced arrhythmias |
| Trigeminal neuralgia | Second-line (after carbamazepine) |
| Neuropathic pain | Off-label use |
- Absence seizures
- Juvenile myoclonic epilepsy (JME)
- Myoclonic seizures
- Dravet syndrome
📏 Dose - How Much to Give
Oral (Chronic Epilepsy):
| Patient | Dose | Notes |
|---|---|---|
| Adults | 300-400 mg/day in 1-3 divided doses | Start low, titrate |
| Loading dose (oral) | 15-20 mg/kg in divided doses over 4-6 hours | Faster therapeutic level |
| Children | 5-8 mg/kg/day in 2 divided doses | |
| Elderly | Start low (100-200 mg/day) | Low albumin = more free drug |
Therapeutic Serum Level:
- <10 mcg/mL = subtherapeutic (seizures not controlled)
- >20 mcg/mL = nystagmus, ataxia
- >30 mcg/mL = slurred speech, drowsiness
- >40 mcg/mL = altered consciousness, seizures (paradoxical!)
💉 IV Preparation - How to Dilute (Very Important!)
Phenytoin IV Rules:
| Step | Details |
|---|---|
| Dilute in | Normal Saline (0.9% NaCl) ONLY |
| NEVER dilute in | Dextrose (D5W) - crystals form immediately! |
| Concentration | Max 6.7 mg/mL in NS (i.e., 1g in 150 mL NS) |
| Rate of infusion | MAX 50 mg/minute in adults |
| In elderly/cardiac patients | Max 25 mg/minute |
| In children | 1-3 mg/kg/minute |
| IV catheter size | <20 gauge, large peripheral or central vein |
| Flush before/after | Flush line with Normal Saline before and after |
| IM route | NOT recommended (erratic absorption, precipitation in muscle) |
Loading Dose IV (Status Epilepticus):
Maintenance dose IV:
⚠️ Adverse Effects
Dose-Related (More drug = more side effects):
| Level | Side Effect |
|---|---|
| Low toxicity | Nystagmus (first sign), diplopia |
| Moderate | Ataxia (unsteady gait), slurred speech |
| High | Drowsiness, mental confusion, lethargy |
| Very high | Paradoxical seizures, coma |
Chronic Use Side Effects (Long-term):
- Gingival hyperplasia (gum overgrowth) - very characteristic, especially in children
- Hirsutism (excess body hair, coarsening of facial features)
- Folate deficiency → Megaloblastic anemia
- Peripheral neuropathy
- Osteomalacia / rickets (induces CYP enzymes → breaks down Vitamin D)
- Lupus-like syndrome
- Cerebellar atrophy (long-term high levels)
IV-specific Adverse Effects:
- Bradycardia, hypotension, cardiac arrhythmias (from propylene glycol in solution + Na+ channel blockade in heart) - seen with too-fast infusion
- Asystole - if infused too fast
- "Purple Glove Syndrome" - purplish-black discoloration + edema + pain at injection site, due to phenytoin crystallizing in blood → can lead to limb ischemia and even amputation (rare)
⛔ Contraindications
| Contraindication | Reason |
|---|---|
| Pregnancy (Category D) | Major teratogen - "fetal hydantoin syndrome": cleft palate, cardiac defects, finger/nail hypoplasia, growth retardation |
| Hypersensitivity to phenytoin or hydantoins | Cross-reactivity possible |
| Sinus bradycardia | Further slows conduction |
| Sinoatrial/AV block | Phenytoin blocks cardiac Na+ channels too |
| Adams-Stokes syndrome | Complete heart block |
| Absence epilepsy / JME / Dravet syndrome | Can WORSEN seizures |
| Porphyria | Can precipitate acute attack |
🔄 Important Drug Interactions (Phenytoin is a MAJOR enzyme inducer!)
| Drug | Effect |
|---|---|
| Valproate | Increases free phenytoin (displaces from albumin + inhibits metabolism) → toxicity |
| Warfarin | Initially increases effect then reduces it - unpredictable |
| OCP (oral contraceptives) | Phenytoin reduces contraceptive levels → contraceptive failure |
| Carbamazepine | Mutual induction → both levels fall |
| Corticosteroids | Reduced steroid effect |
| Vitamin D | Reduced levels → osteomalacia |
| Folic acid | Phenytoin reduces folate → anemia |
Quick Summary Card
PHENYTOIN
│
├── MOA: Blocks INACTIVE Na+ channels → prolonged refractory period
│         → Stops high-frequency seizure firing
│
├── USE: Focal seizures, Tonic-clonic, Status epilepticus, Arrhythmias
│    AVOID: Absence, JME, Dravet, Pregnancy
│
├── DOSE: Adults 300-400 mg/day oral
│         IV loading: 15-20 mg/kg in NS, max 50 mg/min
│         Therapeutic level: 10-20 mcg/mL
│
├── IV DILUTION: Normal Saline ONLY (NEVER dextrose!)
│               Max 6.7 mg/mL, max rate 50 mg/min
│
├── CHRONIC SIDE FX: Gum hypertrophy, hirsutism, folate deficiency,
│                    osteomalacia, peripheral neuropathy
│
└── CONTRAINDICATED: Pregnancy, heart block, absence seizures, porphyria
How munch to dilute it in
Phenytoin IV Dilution - Exactly How Much
The Rule:
- Maximum concentration = 6.7 mg/mL
- This means: 1000 mg (1g) in minimum 150 mL NS
Practical Dilution Examples:
| Dose | Dilute in NS | Final Volume |
|---|---|---|
| 100 mg | 15 mL NS | 15 mL |
| 250 mg | 37.5 mL NS | ~40 mL |
| 500 mg | 75 mL NS | 75 mL |
| 1000 mg (1g) | 150 mL NS | 150 mL |
| 1500 mg | 225 mL NS | 225 mL |
Example for a 60 kg Patient (Status Epilepticus):
Loading dose = 15-20 mg/kg × 60 kg = 900-1200 mg

Take 1000 mg phenytoin
Dilute in 150 mL Normal Saline
Infuse at MAX 50 mg/min
= runs over ~20 minutes
Golden Rules to Remember:
| Rule | Detail |
|---|---|
| ✅ Diluent | Normal Saline (0.9% NaCl) ONLY |
| ❌ NEVER use | Dextrose (D5W) - crystals form instantly |
| ❌ NEVER use | Ringer's Lactate |
| 🔢 Max concentration | 6.7 mg/mL |
| 🔢 Max infusion rate | 50 mg/min (adults) |
| 🔢 In elderly/heart patients | Slow down to 25 mg/min |
| 🔢 In children | 1-3 mg/kg/min |
| 💉 IV line | Use a filter (0.22 micron) - phenytoin tends to precipitate |
| 💉 Flush | Flush IV line with NS before AND after giving phenytoin |
| 🕐 Use within | 1 hour of preparation (solution is unstable) |
Why so strict about dilution?
- Block the IV line
- Can enter the bloodstream and cause clots
- Cause "Purple Glove Syndrome" (tissue necrosis at injection site)
Lv dysfunction in easy way understanding shirt
left ventricular dysfunction systolic diastolic heart failure diagram
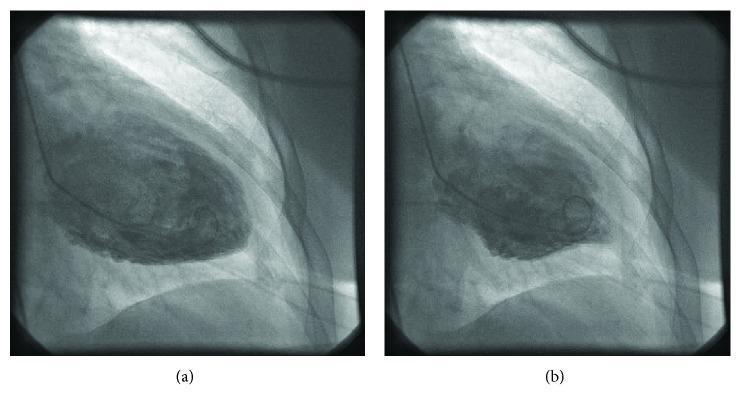
This diagnostic image consists of two frames from a left ventriculogram in a side-by-side comparison, representing diastole (a) and systole (b). The imaging modality is fluoroscopic angiography, used to assess cardiac chamber morphology and wall motion. In the diastolic frame, the left ventricular chamber is shown fully expanded and opacified with radiopaque contrast, exhibiting a rounded, dilated appearance. In the systolic frame, there is a distinct lack of significant volumetric reduction, indicating severe global systolic dysfunction. Notably, the mid-cavitary region shows persistent ballooning and hypokinesis, while the basal and apical segments exhibit relatively higher degrees of inward displacement. This visual pattern is characteristic of a mid-ventricular variant of Takotsubo cardiomyopathy (stress-induced cardiomyopathy). The clinical significance of these images is the demonstration of transient wall motion abnormalities and reduced ejection fraction in the absence of obstructive coronary artery disease, essential for diagnosing acute heart failure syndromes triggered by physical or emotional stress.
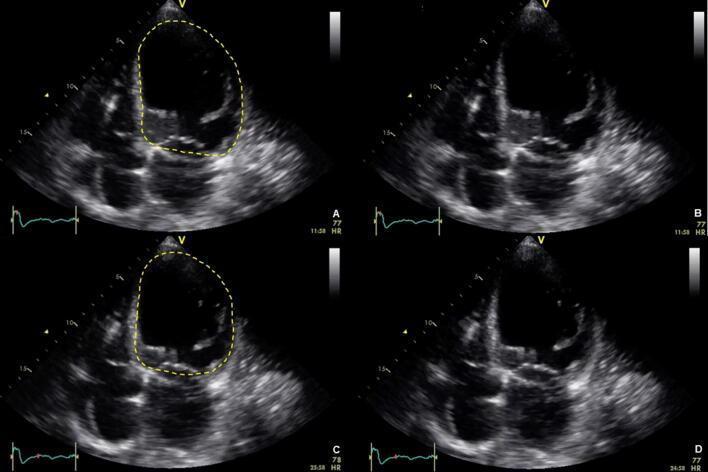
This diagnostic image consists of four echocardiogram frames (A-D) in the apical four-chamber (4C) view, illustrating global left ventricular (LV) dysfunction. The top row (A and B) represents the end-diastolic phase, while the bottom row (C and D) captures the end-systolic phase. In images A and C, the LV endocardium is highlighted with a yellow dashed line to delineate chamber volume. Comparison between the phases reveals minimal change in LV size and shape, indicating a severely reduced ejection fraction. In end-systole (C and D), the LV remains persistently dilated and spherical rather than contracting effectively to a smaller volume, a hallmark of systolic heart failure or dilated cardiomyopathy. The imaging highlights the qualitative assessment ('eyeballing') of LV contractility and the visual discrepancy between end-diastolic volume and end-systolic volume in a dysfunctional heart. These findings are clinically significant for diagnosing impaired global systolic function and managing patients with potential cardiogenic shock or chronic heart failure.
LV Dysfunction - Short & Easy Guide
🫀 Normal LV - How it Should Work
- Fills up with blood (from the lungs via left atrium)
- Squeezes hard to push blood out to the whole body
LV fills with blood → LV squeezes → Blood pumped to body
(DIASTOLE)              (SYSTOLE)
❌ LV Dysfunction = The Pump is Failing
Two Types - Super Easy to Remember
🔴 Type 1: SYSTOLIC Dysfunction (HFrEF)
LV is dilated (stretched big)
EF is LOW (<40%)
Blood stays stuck in LV
LV cannot push blood out properly
→ Body doesn't get enough blood
→ Blood backs up into lungs
| Feature | Detail |
|---|---|
| EF | < 40% (reduced) |
| LV size | Dilated, big, floppy |
| Problem | Can't SQUEEZE |
| Called | HFrEF (Heart Failure with reduced EF) |
| Common causes | Heart attack (MI), dilated cardiomyopathy, alcoholic heart disease |
🟡 Type 2: DIASTOLIC Dysfunction (HFpEF)
LV is stiff and thick (hypertrophied)
EF is NORMAL (>50%)
But LV CANNOT RELAX to fill with blood
Less blood fills in → less blood pumped out
→ Same result: heart failure symptoms
| Feature | Detail |
|---|---|
| EF | >50% (preserved) |
| LV size | Normal or thick/hypertrophied |
| Problem | Can't RELAX & FILL |
| Called | HFpEF (Heart Failure with preserved EF) |
| Common causes | Hypertension, diabetes, obesity, old age |
Simple Analogy
| Systolic (HFrEF) | Diastolic (HFpEF) | |
|---|---|---|
| Like a... | Deflated balloon - can't squeeze | Stiff rubber ball - can't stretch |
| Problem | Weak squeeze | Can't relax/fill |
| EF | Low (<40%) | Normal (>50%) |
📊 Echo Images of LV Dysfunction
Causes of LV Dysfunction
| Category | Examples |
|---|---|
| Coronary artery disease | Heart attack, ischemia |
| Hypertension | Chronic high BP → LV stiffens |
| Cardiomyopathies | Dilated, hypertrophic, restrictive |
| Valvular disease | Aortic stenosis, mitral regurgitation |
| Alcohol / toxins | Alcoholic cardiomyopathy |
| Chemotherapy | Anthracyclines (doxorubicin) |
| Diabetes / Obesity | Metabolic cardiomyopathy |
| Thyroid disease | Hypo/hyperthyroidism |
| Infection | Myocarditis (viral) |
| Tachycardia | Prolonged fast heart rate damages LV |
Symptoms (Both Types Look Similar)
LV can't pump properly
         ↓
Blood backs up into lungs → Pulmonary congestion
         ↓
• Breathlessness (dyspnea)
• Breathless lying flat (orthopnea)
• Waking up breathless at night (PND)
• Leg swelling (edema)
• Fatigue, weakness
• Reduced exercise tolerance
Key Investigation: Echocardiogram
- Measures EF - tells you which type (systolic or diastolic)
- LV size - dilated (systolic) or normal/thick (diastolic)
- Wall motion - normal, hypokinetic, akinetic
- BNP / NT-proBNP - elevated in both types - confirms heart failure
- Troponin - elevated if there is ongoing damage/ischemia
Quick Summary
LV DYSFUNCTION
│
├── SYSTOLIC (HFrEF)
│    EF < 40%, LV dilated, can't squeeze
│    Causes: MI, dilated CM, alcohol
│
└── DIASTOLIC (HFpEF)
     EF > 50%, LV stiff, can't fill
     Causes: Hypertension, diabetes, age
│
Both → Same symptoms: breathlessness, edema, fatigue
Both → Diagnosed by Echo + BNP
- [Fuster & Hurst's The Heart 15th Ed., p. 2132] | [Barash Clinical Anesthesia 9e]