
EKG
Asking for Preferences
What would you like to know about EKG/ECG?
Asking for Preferences
What's your level? · Preferred format?
Reading File
Finding Sources
Finding Sources
Finding Sources
Finding Sources
Good - I have several textbook sources. Let me pull the most relevant content from Guyton & Hall (physiology), Harrison's, and Roberts & Hedges' (clinical procedures) in parallel.
Reading File
Reading File
Reading File
Good. Now let me get more content on intervals, axis, and arrhythmias from Harrison's and pull the cardiac conduction diagram image.
Reading File
Loading Image
Excellent content. Let me now fetch the ECG waveform diagram and get more content on axis and common abnormalities.
Loading Image
Reading File
I now have rich content for a comprehensive beginner guide. Let me also pull the axis section and arrhythmia/ST changes content.
Reading File
I now have all the core content needed. Let me compile the full study guide.
EKG/ECG - Beginner's Structured Study Guide
1. What Is an EKG?
An electrocardiogram (EKG or ECG) is a recording of the electrical activity of the heart, captured by electrodes placed on the skin. When a cardiac impulse travels through the heart, electrical currents spread into the surrounding tissues and reach the body surface. By recording the voltage differences between electrodes on opposite sides of the heart, you get the characteristic waveform tracing. - Guyton & Hall Textbook of Medical Physiology
2. The Cardiac Conduction System
Before reading an EKG, understand what generates the signal:
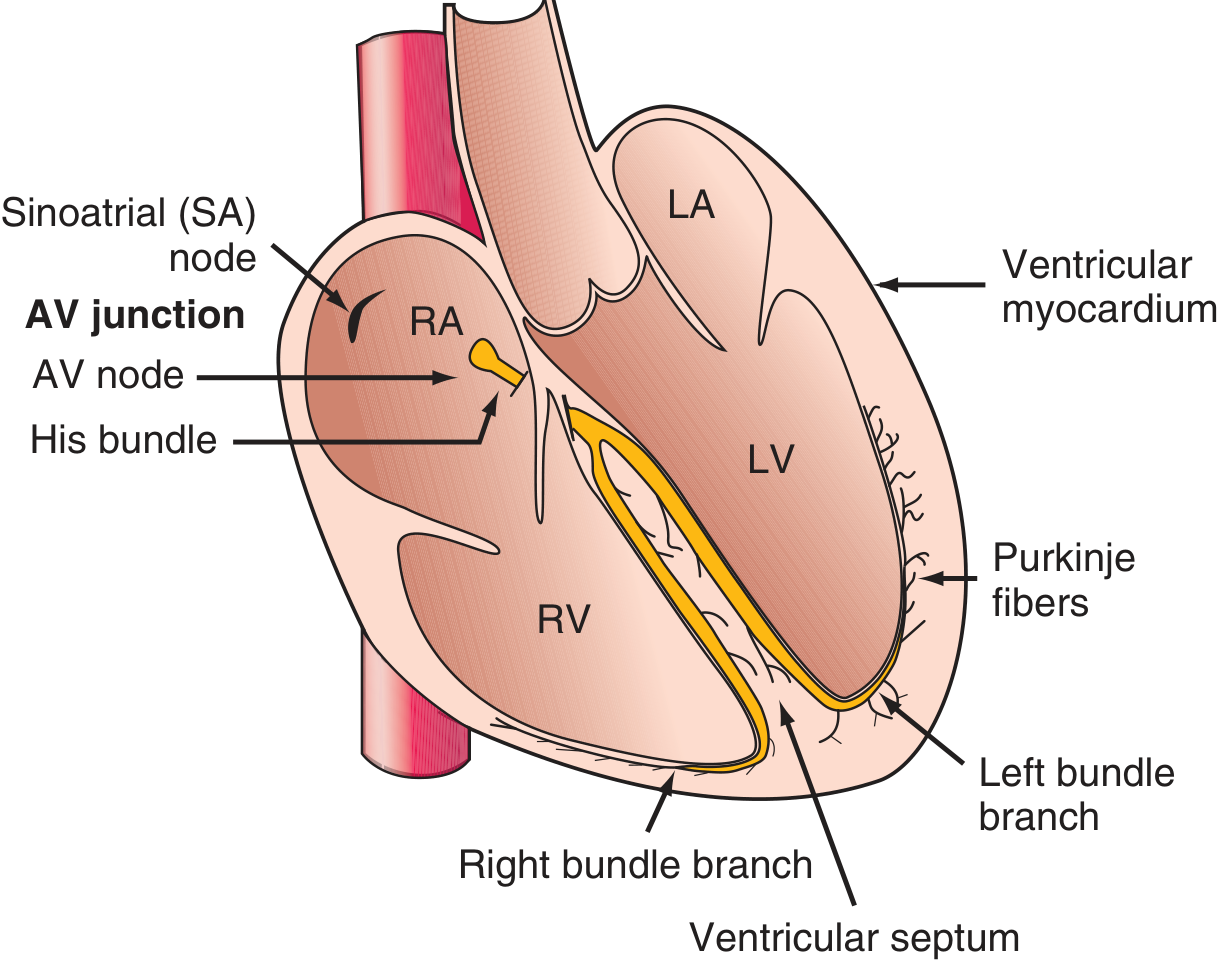
The normal heartbeat originates at the sinoatrial (SA) node, the heart's natural pacemaker. Depolarization then spreads in the following sequence:
- SA node - fires spontaneously (60-100 bpm at rest)
- Right and left atria - depolarize and contract
- AV node - briefly delays conduction (allows ventricles to fill)
- Bundle of His - passes through the fibrous skeleton
- Right and left bundle branches - rapidly distribute the impulse
- Left anterior and posterior fascicles - subdivisions of the left bundle
- Purkinje fibers - deliver impulse to ventricular myocardium
- Ventricular myocardium - depolarizes endocardium to epicardium
- Harrison's Principles of Internal Medicine, 22E
3. The Normal EKG Waveform
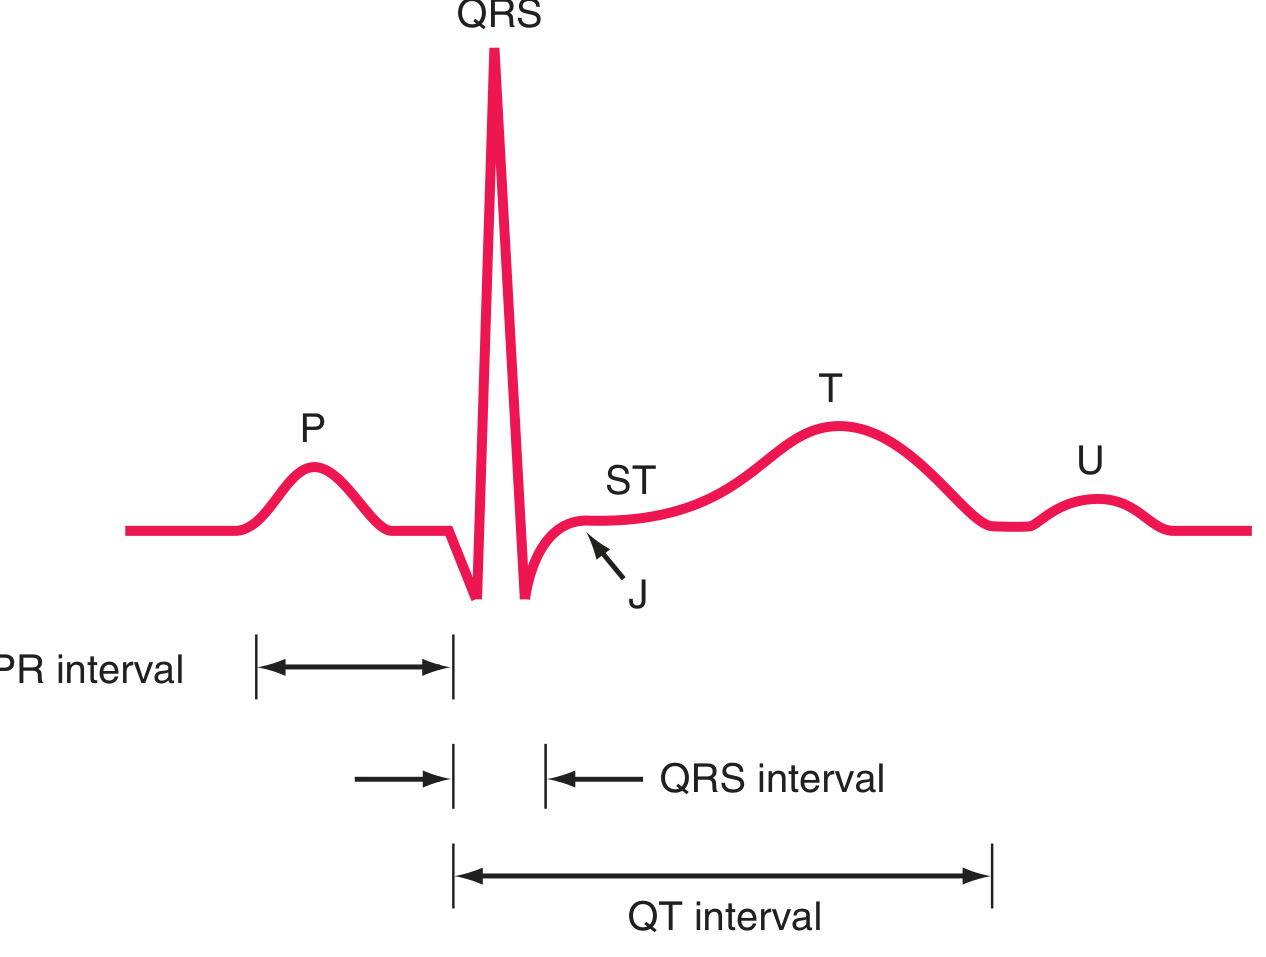
| Wave/Segment | What It Represents |
|---|---|
| P wave | Atrial depolarization |
| PR interval | Time from atrial to ventricular depolarization (AV conduction) |
| QRS complex | Ventricular depolarization |
| Q wave | First negative deflection before the R wave |
| R wave | First positive deflection |
| S wave | Negative deflection after R wave |
| ST segment | Plateau phase of ventricular action potential (isoelectric) |
| J point | Junction between QRS end and ST segment start |
| T wave | Ventricular repolarization |
| U wave | Late ventricular repolarization (especially visible in hypokalemia) |
- Guyton & Hall; Harrison's, 22E
4. Normal Intervals
The EKG is recorded on paper at 25 mm/s. Each small box = 1 mm = 40 ms (0.04 s). Each large box = 5 mm = 200 ms (0.20 s).
| Interval | Normal Range | Clinical Significance |
|---|---|---|
| PR interval | 120-200 ms (3-5 small boxes) | AV conduction time; prolonged = heart block |
| QRS duration | ≤110 ms (≤2.75 small boxes) | Ventricular depolarization; wide = bundle branch block |
| QT interval | <450 ms men, <460 ms women | Ventricular repolarization; prolonged = risk of torsades |
| RR interval | Determines heart rate | 300 ÷ (# large boxes) = heart rate in bpm |
Quick heart rate calculation: Count the number of large boxes between two R waves, then divide 300 by that number. For example, 4 large boxes between R waves = 300/4 = 75 bpm.
- Harrison's Principles of Internal Medicine, 22E
5. The 12 Leads - What Each One "Sees"
A standard EKG uses 12 leads (vantage points), split into two groups:
Limb leads (frontal plane):
- Lead I - Left side of the heart (lateral)
- Lead II - Inferior (best for rhythm monitoring)
- Lead III - Inferior
- aVR - From the right arm; P wave normally negative here
- aVL - High lateral
- aVF - Inferior
Precordial (chest) leads - horizontal plane:
- V1-V2 - Right ventricle / septum
- V3-V4 - Anterior wall
- V5-V6 - Lateral wall (left ventricle)
Think of the 12 leads as 12 different cameras all filming the same event from different angles. Abnormalities visible in certain lead groups tell you which region of the heart is affected.
6. The Systematic Approach - How to Read Any EKG
Always follow this sequence so you never miss something:
Step 1 - Rate
- Normal: 60-100 bpm
- Bradycardia: <60 bpm
- Tachycardia: >100 bpm
Step 2 - Rhythm
- Is it regular? (Are RR intervals equal?)
- Is there a P wave before every QRS?
- Is there a QRS after every P wave?
- Is the QRS narrow or wide?
Step 3 - Axis (QRS axis)
- Normal axis: -30° to +90°
- Look at leads I and aVF:
- Both positive = normal axis
- I positive, aVF negative = left axis deviation (LAD)
- I negative, aVF positive = right axis deviation (RAD)
- Both negative = extreme/northwest axis
Step 4 - P wave morphology
- Normal: upright in I and II, negative in aVR
- Broad/notched (lead II) = left atrial enlargement
- Tall/peaked >2.5 mm (lead II) = right atrial enlargement
Step 5 - PR interval
- Short <120 ms = pre-excitation (e.g., WPW)
- Prolonged 200-300 ms = 1st degree heart block
- Progressively lengthening = 2nd degree (Mobitz I/Wenckebach)
- No relationship P to QRS = 3rd degree (complete heart block)
Step 6 - QRS complex
- Width, morphology, amplitude
- Wide QRS (>120 ms) = bundle branch block or ventricular rhythm
Step 7 - ST segment
- ST elevation = acute injury/STEMI (key territory by lead group)
- ST depression = ischemia or posterior MI
- Compare to isoelectric PR baseline
Step 8 - T waves
- Normal: upright in most leads, inverted in aVR
- Tall peaked T waves = hyperkalemia or early ischemia
- T wave inversions = ischemia, strain, bundle branch block
Step 9 - QT interval
- Correct for rate using QTc formula
- Prolonged QTc = risk of torsades de pointes
7. Key Patterns to Recognize
Bundle Branch Blocks
- Right BBB (RBBB): Wide QRS (≥120 ms) + rSR' ("rabbit ears") in V1 + wide S wave in V6. The terminal QRS vector points right and anterior. - Harrison's, 22E
- Left BBB (LBBB): Wide QRS + broad notched R (or QS) in V1 + tall broad R in V6. Septal activation reverses (right to left). Often a marker of coronary disease, hypertensive heart disease, cardiomyopathy, or aortic valve disease. - Harrison's, 22E
Acute MI (STEMI territory by leads)
| Territory | Leads with Changes | Artery |
|---|---|---|
| Inferior | II, III, aVF | RCA |
| Lateral | I, aVL, V5-V6 | LCx |
| Anterior | V1-V4 | LAD |
| Posterior | ST depression V1-V2 (reciprocal) | LCx/RCA |
Common Arrhythmias
| Arrhythmia | Key Features |
|---|---|
| Sinus tachycardia | Rate >100, normal P-QRS |
| Sinus bradycardia | Rate <60, normal P-QRS |
| Atrial fibrillation | No P waves, irregularly irregular, narrow QRS |
| Atrial flutter | Saw-tooth P waves ~300 bpm, typically 2:1 or 4:1 block |
| SVT | Narrow QRS tachycardia, P often hidden in T |
| Ventricular tachycardia | Wide QRS tachycardia, rate >100, AV dissociation |
| 1° AV block | PR >200 ms, every P conducts |
| 2° AV block (Mobitz I) | Progressive PR lengthening, then dropped QRS |
| 2° AV block (Mobitz II) | Constant PR, sudden dropped QRS |
| 3° AV block | Complete dissociation P from QRS |
8. Electrolyte Effects on EKG
| Electrolyte | Change | EKG Finding |
|---|---|---|
| Hyperkalemia | High K+ | Peaked T waves → wide QRS → loss of P wave → sine wave |
| Hypokalemia | Low K+ | Flat/inverted T waves, prominent U waves, long QT |
| Hypercalcemia | High Ca²+ | Short QT interval |
| Hypocalcemia | Low Ca²+ | Long QT interval |
9. Memory Aids
- Rate trick: 300 - 150 - 100 - 75 - 60 - 50 (count large boxes between R waves: 1, 2, 3, 4, 5, 6)
- LBBB mnemonic: WiLLiaM MaRRoW (W pattern in V1 = LBBB; M pattern in V1 = RBBB)
- Normal P wave: "P is positive in I and II, negative in aVR" - if not, not sinus rhythm
- ST elevation rule: ≥1 mm in limb leads, ≥2 mm in precordial leads = significant
Sources
- Guyton and Hall Textbook of Medical Physiology - Fundamentals of Electrocardiography
- Harrison's Principles of Internal Medicine, 22E (2025) - Chapter 247: Basic ECG Waveforms and Intervals
- The Harriet Lane Handbook, 23rd ed. - Basic Electrocardiography Principles
Generate a comparison table of normal vs abnormal EKG findings
Based on the detailed content already retrieved in this session from Harrison's 22E and Guyton & Hall, here is the comparison table:
Normal vs. Abnormal EKG Findings
Rate & Rhythm
| Parameter | Normal | Abnormal | What It Suggests |
|---|---|---|---|
| Heart rate | 60-100 bpm | <60 bpm | Sinus bradycardia, heart block, hypothyroidism |
| Heart rate | 60-100 bpm | >100 bpm | Sinus tachycardia, SVT, AF, VT |
| Rhythm regularity | Regular (equal RR intervals) | Irregular | Atrial fibrillation, PACs, PVCs, Wenckebach |
| P before every QRS | Yes, 1:1 | Missing P waves | AF, junctional rhythm, ventricular rhythm |
| QRS after every P | Yes, 1:1 | Dropped QRS | 2nd or 3rd degree heart block |
P Wave
| Parameter | Normal | Abnormal | What It Suggests |
|---|---|---|---|
| Morphology in lead II | Upright, smooth, rounded | Absent / saw-tooth / chaotic | AF (absent), flutter (saw-tooth), AF (chaotic) |
| Morphology in aVR | Negative (inverted) | Positive (upright) | Ectopic atrial rhythm, retrograde conduction |
| Duration | <120 ms | Broad/notched ("P mitrale") | Left atrial enlargement |
| Amplitude in lead II | ≤2.5 mm | Tall peaked >2.5 mm ("P pulmonale") | Right atrial enlargement |
| Axis | Positive in I and II | Negative in II | Non-sinus (ectopic or retrograde) pacemaker |
PR Interval
| Parameter | Normal | Abnormal | What It Suggests |
|---|---|---|---|
| Duration | 120-200 ms (3-5 small boxes) | <120 ms | Pre-excitation (WPW), accelerated AV conduction |
| Duration | 120-200 ms | >200 ms (fixed) | 1st degree AV block |
| Duration | 120-200 ms | Progressively lengthening → dropped beat | 2nd degree AV block, Mobitz I (Wenckebach) |
| Duration | 120-200 ms | Fixed, then sudden dropped QRS | 2nd degree AV block, Mobitz II |
| P-QRS relationship | 1:1, consistent PR | No consistent relationship | 3rd degree (complete) AV block |
QRS Complex
| Parameter | Normal | Abnormal | What It Suggests |
|---|---|---|---|
| Duration | ≤110 ms (<2.75 small boxes) | 110-120 ms | Incomplete bundle branch block |
| Duration | ≤110 ms | ≥120 ms (3+ small boxes) | Complete BBB, ventricular rhythm, hyperkalemia |
| Morphology V1 | Small r, deep S (rS) | rSR' ("rabbit ears" / M pattern) | Right bundle branch block (RBBB) |
| Morphology V1 | Small r, deep S | Broad QS or W pattern | Left bundle branch block (LBBB) |
| Morphology V6 | qR (small q, tall R) | Wide S wave with rSR' in V1 | RBBB |
| Morphology V6 | qR | Tall broad R, no septal q | LBBB |
| Q waves | Absent or septal q <40 ms, <25% R height | Pathologic Q: ≥40 ms wide OR ≥25% of R amplitude | Prior MI (necrosis) |
| R wave progression V1→V6 | Gradually increasing R amplitude | Poor progression or R wave loss | Anterior MI, LBBB, RV hypertrophy |
| Amplitude | Normal voltage | SV1 + RV5/V6 >35 mm | Left ventricular hypertrophy (LVH) |
| Amplitude | Normal voltage | R in V1 tall, deep S in V5/V6 | Right ventricular hypertrophy (RVH) |
| Axis | -30° to +90° | Left axis deviation (<-30°) | LBBB, LVH, left anterior fascicular block, inferior MI |
| Axis | -30° to +90° | Right axis deviation (>+90°) | RBBB, RVH, left posterior fascicular block, lateral MI |
ST Segment
| Parameter | Normal | Abnormal | What It Suggests |
|---|---|---|---|
| Position | Isoelectric (flat, at baseline) | Elevation ≥1 mm limb leads / ≥2 mm precordial | STEMI, Prinzmetal angina, pericarditis, early repolarization |
| Position | Isoelectric | Depression ≥0.5-1 mm | NSTEMI/UA, posterior MI (V1-V2), digoxin effect |
| Shape | Flat/gently upsloping | Saddle-shaped elevation, diffuse | Acute pericarditis |
| Shape | Flat/gently upsloping | Concave upward elevation in V1-V3 | Brugada pattern |
| ST-T discordance | Concordant with QRS polarity | Discordant T wave opposite to QRS | Expected in BBB; primary change = ischemia |
T Wave
| Parameter | Normal | Abnormal | What It Suggests |
|---|---|---|---|
| Polarity | Upright in I, II, V3-V6; inverted in aVR | Inverted in I, aVL, V4-V6 | Lateral ischemia, LVH strain, LBBB |
| Polarity | Upright | Inverted in V1-V4 | Anterior ischemia, RVH, RBBB, PE |
| Amplitude | Proportionate, asymmetric | Tall, peaked, symmetric ("hyperacute") | Early STEMI, hyperkalemia |
| Morphology | Asymmetric (slow upstroke, fast downstroke) | Deeply inverted, symmetric (Wellens' T waves) | Critical LAD stenosis (Wellens' syndrome) |
QT Interval
| Parameter | Normal | Abnormal | What It Suggests |
|---|---|---|---|
| QTc (Bazett) | ≤450 ms men / ≤460 ms women | Prolonged QTc | Drugs (amiodarone, antipsychotics), hypocalcemia, hypokalemia, long QT syndrome - risk of torsades de pointes |
| QTc | ≤450 ms men | Short QTc (<350 ms) | Hypercalcemia, digoxin effect, short QT syndrome |
U Wave
| Parameter | Normal | Abnormal | What It Suggests |
|---|---|---|---|
| Presence | Small, may be present (especially V2-V3) | Prominent U waves (>T amplitude) | Hypokalemia, bradycardia |
| Polarity | Positive when present | Negative U wave | Myocardial ischemia, LVH |
Quick Reference Summary
| Component | Key Normal Values |
|---|---|
| Rate | 60-100 bpm |
| PR interval | 120-200 ms |
| QRS duration | ≤110 ms |
| QTc | ≤450 ms (M) / ≤460 ms (F) |
| P wave | Upright I & II, inverted aVR |
| ST segment | Isoelectric |
| T wave | Upright I, II, V3-V6 |
| Axis | -30° to +90° |
Sources: Harrison's Principles of Internal Medicine 22E (2025); Guyton and Hall Textbook of Medical Physiology
placement of leads
The standard 12-lead EKG uses 10 electrodes: 4 limb electrodes and 6 chest electrodes. Limb leads go on the wrists/ankles, precordial leads go across the chest in specific anatomical positions.
Searching sources...
Finding Sources
Finding Sources
Reading File
Reading File
Reading File
Finding Sources
Loading Image
Reading File
Excellent - I have everything needed. Here is the full lead placement guide:
EKG Lead Placement
A standard 12-lead EKG uses 10 electrodes (4 limb + 6 chest) that generate 12 different views of the heart's electrical activity.
Patient Setup
- Patient lies supine on the exam table, arms at sides, legs flat and not touching each other
- Expose the chest and distal extremities; keep the rest covered (prevents shivering = artifact)
- Clean electrode sites with an alcohol swab; shave if needed; gentle skin abrasion improves contact
- Paper speed: 25 mm/s | Amplitude: 1 mV = 10 mm
- Pfenninger and Fowler's Procedures for Primary Care
Part 1 - Limb Electrodes (4 electrodes)
These go on the wrists and ankles (or upper arms/thighs to reduce motion artifact). They generate the 6 frontal plane leads.
| Electrode | Label | Color (US/AHA) | Placement |
|---|---|---|---|
| Right Arm | RA | White | Right wrist or upper right arm |
| Left Arm | LA | Black | Left wrist or upper left arm |
| Right Leg | RL | Green | Right ankle or lower right leg (ground electrode) |
| Left Leg | LL | Red | Left ankle or lower left leg |
Memory trick: "White on right, smoke (black) over fire (red)" - White = RA, Black = LA, Red = LL, Green = RL
Note: The right leg (green) is a ground electrode only - its exact position does not affect any displayed lead.
The 4 limb electrodes generate 6 frontal leads:
- Bipolar: I, II, III
- Augmented unipolar: aVR, aVL, aVF
Part 2 - Precordial (Chest) Electrodes (6 electrodes)
These generate the 6 horizontal plane leads (V1-V6). Placement is entirely based on bony landmarks - do not use nipples as landmarks in women.
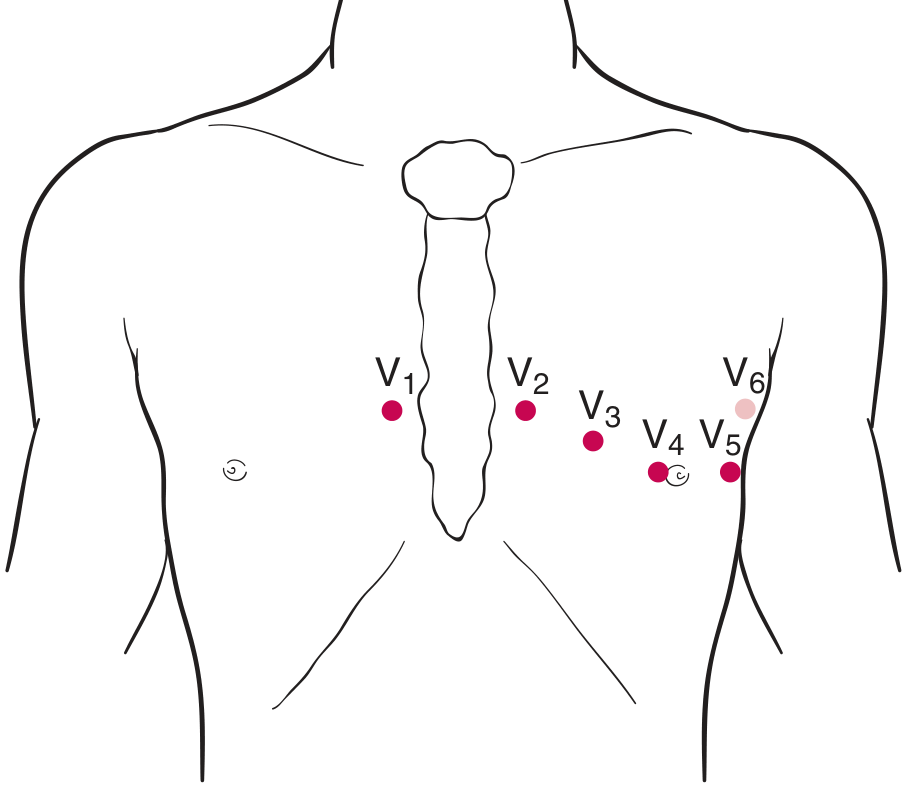
How to find the landmarks:
First, locate the sternal angle (Angle of Louis) - the ridge where the manubrium meets the body of the sternum. The 2nd rib attaches here. Count down from there to find each intercostal space.
| Lead | Color (US) | Anatomical Position |
|---|---|---|
| V1 | Red | 4th intercostal space (ICS), right sternal border |
| V2 | Yellow | 4th intercostal space (ICS), left sternal border |
| V3 | Green | Halfway between V2 and V4 (diagonal, not necessarily on a rib) |
| V4 | Blue | 5th ICS, mid-clavicular line |
| V5 | Orange/Tan | Anterior axillary line, same horizontal level as V4 |
| V6 | Purple/Violet | Mid-axillary line, same horizontal level as V4 and V5 |
Key rule: V4, V5, and V6 must all be on the same horizontal plane (same transverse level), even if they fall in slightly different intercostal spaces.
Step-by-Step Landmark Technique
1. Find the sternal angle (Angle of Louis) - the bony ridge on the sternum
2. The 2nd rib attaches here → count down to the 4th ICS
3. Place V1 at 4th ICS, RIGHT of sternum
4. Place V2 at 4th ICS, LEFT of sternum
5. Drop down one space → 5th ICS, mid-clavicular line = V4
6. Place V3 midway between V2 and V4
7. Draw an imaginary horizontal line through V4
8. V5 = anterior axillary line on that line
9. V6 = mid-axillary line on that line
What Each Lead "Sees"
| Lead(s) | Region of Heart | Coronary Territory |
|---|---|---|
| I, aVL, V5, V6 | Lateral wall (LV) | Left circumflex (LCx) |
| II, III, aVF | Inferior wall | Right coronary artery (RCA) |
| V1, V2 | Septum / RV | LAD (septal branches) |
| V3, V4 | Anterior wall | LAD |
| aVR | Cavity / right atrium | Left main (when diffusely elevated) |
Common Placement Errors and How to Spot Them
| Error | How to Recognize |
|---|---|
| RA/LA reversal (most common) | Lead I is inverted; P wave negative in I but normal in aVF; computer flags new right axis deviation |
| V1/V3 reversal | R wave does not progressively increase V1→V3; T wave inverted in V3 |
| V leads placed too high | Tall R waves disappear; poor R-wave progression |
| Precordial leads not on same horizontal plane | Sudden jump in R-wave amplitude between V4-V6 |
| Electrodes on wrong limb | Bizarre axis change vs. prior tracing |
- Pfenninger and Fowler's Procedures for Primary Care
Monitoring vs. Standard 12-Lead Placement
In the ICU or OR, limb electrodes are often placed on the torso rather than the extremities (Mason-Likar modification):
- Right and left arm leads: just below the clavicles
- Leg leads: above the hips
This reduces motion artifact but slightly alters QRS amplitude and axis compared to a standard 12-lead. ST-segment measurements remain generally reliable. - Miller's Anesthesia, 10e
Best Monitoring Lead for Specific Purposes
| Goal | Best Lead |
|---|---|
| Rhythm monitoring | Lead II (clearest P waves) |
| Ischemia detection | Lead V5 (most sensitive - lateral wall) |
| If 2 channels available | II + V5 |
| If 3 channels available | aVF + V2 + V5 |
| RV ischemia | Right-sided leads V3R-V6R |
| Posterior MI | Posterior leads V7-V9 |
- Pfenninger and Fowler's Procedures for Primary Care; Miller's Anesthesia, 10e
This is a shared conversation. Sign in to Orris to start your own chat.