
What is T1 and T2 in mri
T1 T2 MRI relaxation contrast brain comparison
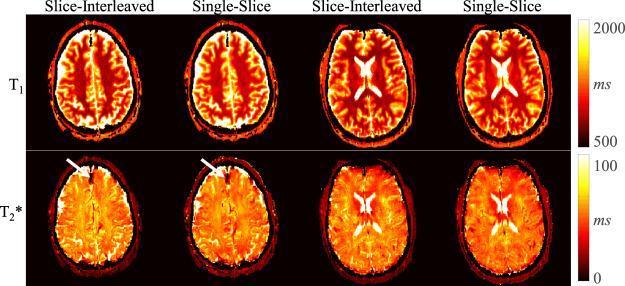
A comparison of axial brain MRI maps acquired using magnetic resonance fingerprinting (MRF) echo-planar imaging (EPI). The image displays two rows: the top row shows T1 relaxation maps (0–2000 ms) and the bottom row shows T2* relaxation maps (0–100 ms). Each row compares two acquisition techniques: 'Slice-Interleaved' and 'Single-Slice'. The T1 maps demonstrate clear anatomical contrast with white matter appearing in darker red tones (lower T1 values) and grey matter in lighter yellow tones (higher T1 values). The T2* maps provide susceptibility contrast weighting. A focal signal dropout in the frontal lobe, indicated by white arrows in both the slice-interleaved and single-slice T2* maps, identifies a region of intracranial calcification. The color-coded scale bars on the right quantify the relaxation times in milliseconds. The visual comparison highlights that the slice-interleaved technique achieves comparable image quality, tissue delineation, and pathology detection to the standard single-slice method.
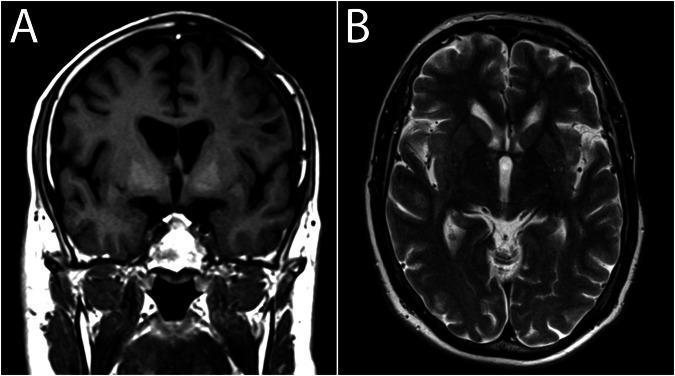
Diagnostic neuroimaging comparison featuring two magnetic resonance imaging (MRI) slices of the human brain. Image A is a non-contrast coronal T1-weighted image showing bilateral, symmetric hyperintensity (increased signal) in the globi pallidi, which suggests shortened T1 relaxation time due to substances such as gadolinium-ferritin complexes or manganese. Image B is an axial T2-weighted image at the level of the basal ganglia. In Image B, the cerebrospinal fluid (CSF) in the ventricles and sulci appears bright (hyperintense), while the white matter is relatively dark (hypointense) and gray matter is intermediate. The globi pallidi in the T2-weighted image show physiological hypointensity. The comparison illustrates that while significant T1 shortening is visible as hyperintensity in the deep brain nuclei, corresponding T2 shortening effects may be negligible or invisible to the naked eye. This visual material is intended for intermediate to advanced medical learners studying neuroradiology, specifically focusing on signal intensity changes in deep-brain nuclei and the effects of paramagnetic substances on relaxation times.
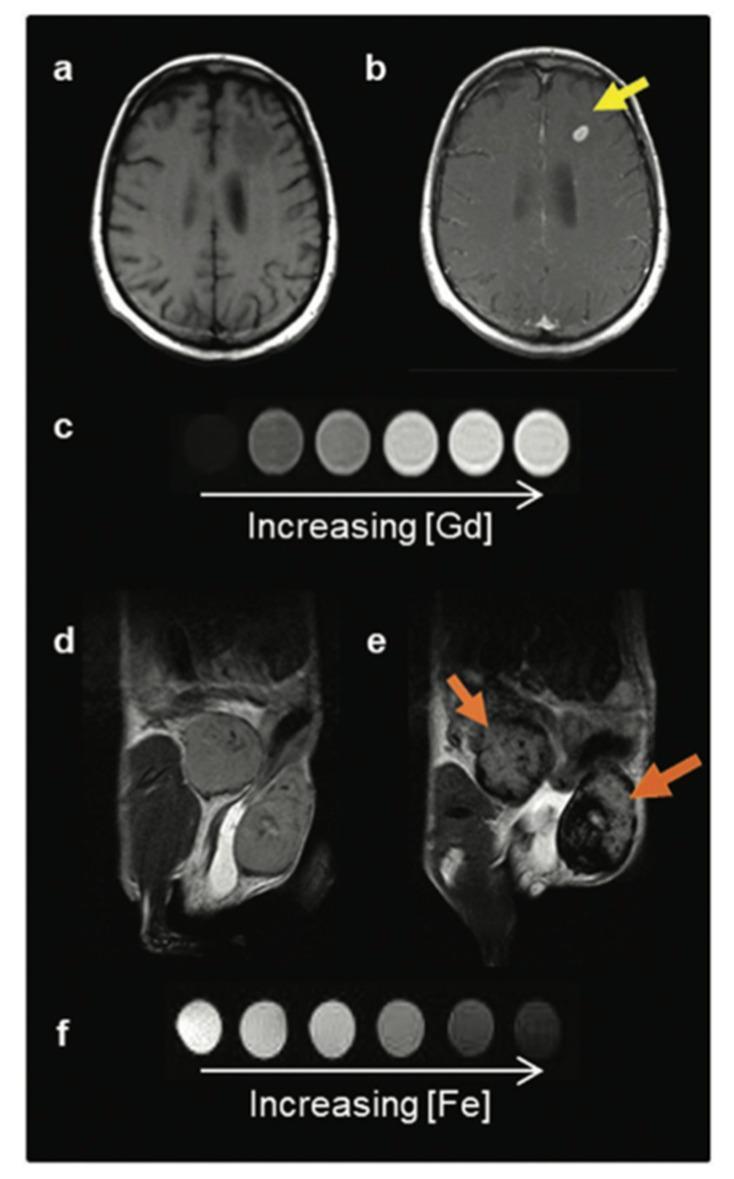
This educational comparison chart illustrates the mechanisms and visual outcomes of two primary classes of MRI contrast agents. The top section displays axial T1-weighted MRI scans of a human brain before (a) and after (b) the administration of a Gadolinium-Based Contrast Agent (GBCA). A yellow arrow highlights a hyperintense (bright) metastatic lesion, demonstrating how T1 agents shorten spin-lattice relaxation time to increase signal. Below this, a series of phantoms (c) shows that as Gadolinium concentration increases, signal intensity progressively brightens. The bottom section presents T2-weighted MRI scans of a murine model before (d) and after (e) the administration of Iron Oxide Nanoparticle (IONP) contrast agents. Orange arrows point to hypointense (dark) areas in mammary gland tumors, illustrating how T2 agents shorten spin-spin relaxation time to induce signal loss. The corresponding phantoms (f) confirm that increasing iron concentration leads to a darker, hypointense signal. The graphic serves to distinguish between T1 'positive' contrast and T2 'negative' contrast in diagnostic radiology.
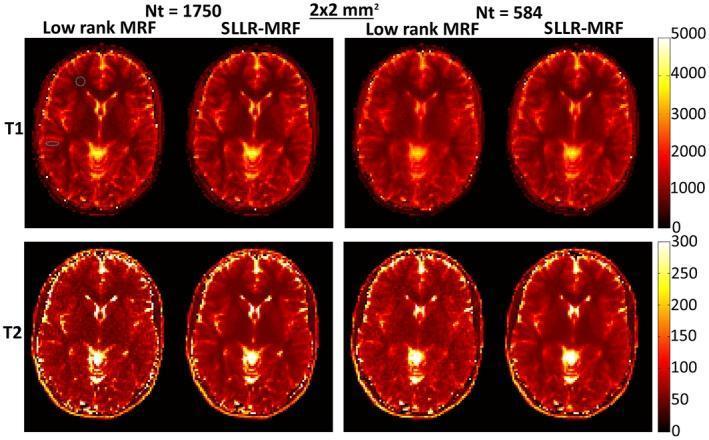
This diagnostic comparison chart displays axial in vivo brain parametric maps (T1 and T2 relaxation times) at 2x2 mm² resolution, comparing two Magnetic Resonance Fingerprinting (MRF) reconstruction techniques: standard Low-rank MRF and the proposed SLLR-MRF. The top row shows T1 maps with a color scale ranging from 0 to 5000 ms, while the bottom row shows T2 maps scaled from 0 to 300 ms. The images are categorized by data acquisition length: Nt=1750 and Nt=584 time-points. Key visual findings include residual blurring in the T1 maps and significant noise amplification in the T2 maps when using standard Low-rank MRF at the lower sampling rate (Nt=584). In contrast, SLLR-MRF demonstrates superior image fidelity and noise suppression, maintaining map quality despite the reduction in data. Dotted circles on the T1 images indicate regions of interest (ROI) for gray and white matter quantitative analysis. This figure illustrates advancements in quantitative MRI acceleration through structured low-rank and sparse reconstruction algorithms.
T1 and T2 in MRI
The Basic Concept
T1 - Longitudinal (Spin-Lattice) Relaxation
- What it is: The time it takes for protons to recover their magnetization along the z-axis (longitudinal plane, parallel to the main magnetic field) after the RF pulse is turned off.
- Definition: T1 is the time required for 63% of the longitudinal magnetization to recover.
- Also called: Spin-lattice relaxation, because energy is transferred from the excited protons to the surrounding molecular lattice.
- What happens physically: Protons "give up" their absorbed energy to neighboring molecules and return to their original low-energy alignment with the magnetic field.
- T1 values are in the range of hundreds to thousands of milliseconds, varying by tissue type.
- Produced using a short TR (repetition time) and short TE (echo time)
- Fat appears bright (hyperintense)
- Water/CSF appears dark (hypointense)
- Used for anatomy, post-contrast enhancement (gadolinium shortens T1 → bright signal), and identifying fat or subacute blood
T2 - Transverse (Spin-Spin) Relaxation
- What it is: The time it takes for the transverse (horizontal) magnetization to decay - i.e., for the protons to lose their phase coherence with each other in the x-y plane.
- Definition: T2 is the time for 63% of the transverse magnetization to be lost.
- Also called: Spin-spin relaxation, because protons interact with neighboring protons, causing them to dephase.
- Key point: T2 relaxation is always faster than T1 relaxation - transverse magnetization decays before longitudinal magnetization can fully recover.
- Produced using a long TR and long TE
- Water/CSF appears bright (hyperintense)
- Fat also appears relatively bright
- White matter appears darker than gray matter
- Very sensitive to edema, inflammation, infarction, and most pathology - which is why T2 is often called the "pathology sequence"
The Relaxation Curves
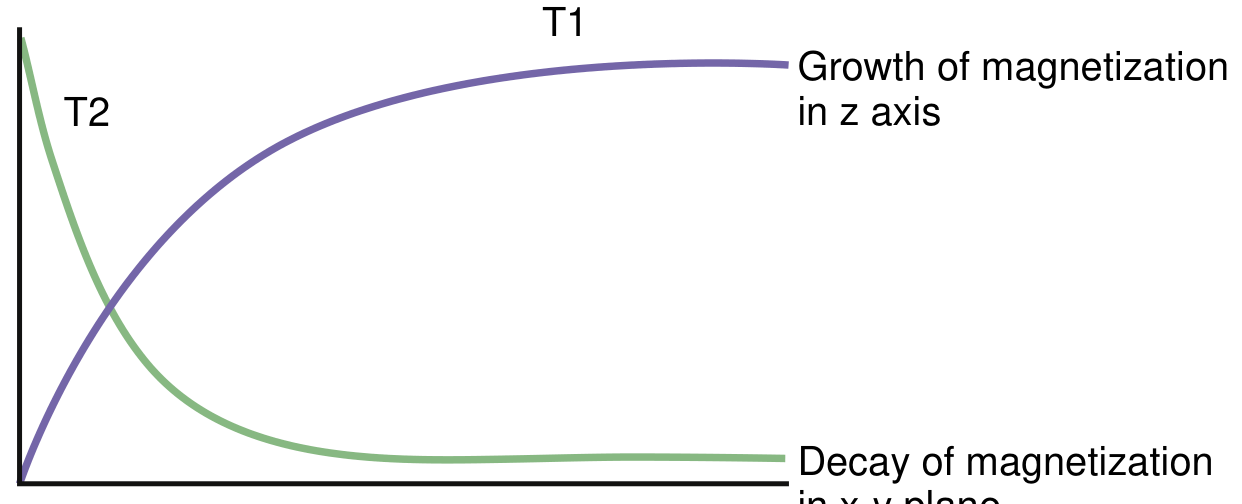
- Blue curve (T1): Slow growth of longitudinal magnetization recovering toward equilibrium
- Green curve (T2): Rapid decay of transverse magnetization (dephasing)
Brain MRI - T1 vs T2 in Practice
Signal Intensity Summary Table
| Sequence | TR | TE | CSF | Fat | Brain | Edema |
|---|---|---|---|---|---|---|
| T1-weighted | Short | Short | Low (dark) | High (bright) | Low | Low |
| T2-weighted | Long | Long | High (bright) | High (bright) | Medium | High (bright) |
| FLAIR (T2) | Long | Long | Low (dark) | High | Medium | High |
Tissue Appearance on T1 vs T2 (Brain)
| Tissue | T1-Weighted | T2-Weighted | FLAIR |
|---|---|---|---|
| Gray matter | Gray | Light gray | Light gray |
| White matter | White | Dark gray | Gray |
| CSF/water | Black | White | Dark gray |
| Fat | White | White | White |
| Edema | Gray | Bright | Bright |
| Bone/air | Black | Black | Black |
Key Memory Rule
-
T1 = "1 tissue" → Anatomy - Fat is bright, water is dark. Great for anatomy and contrast-enhanced scans.
-
T2 = "2 fluid" → Pathology - Water/fluid is bright. Most disease processes (edema, tumors, MS plaques, infarcts) show up bright on T2.
-
Bradley and Daroff's Neurology in Clinical Practice, p. 674
-
Harrison's Principles of Internal Medicine 22E, MRI chapter
-
Neuroanatomy through Clinical Cases 3rd Edition, p. 116-117