
Diuretics
diuretics mechanism nephron tubule sites of action diagram
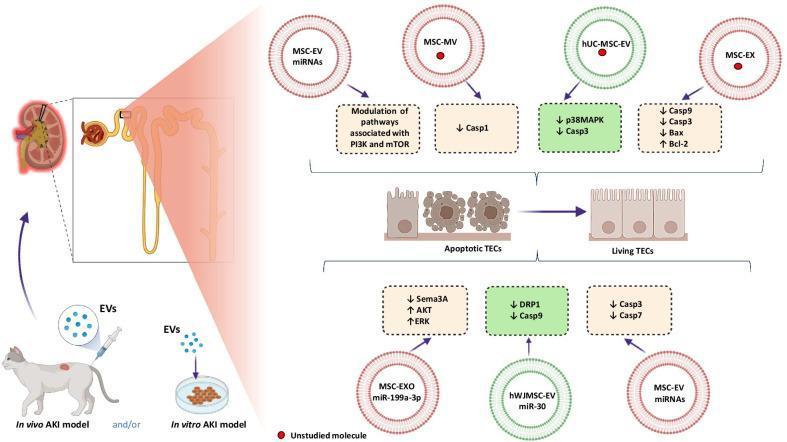
A pathophysiology diagram illustrating the anti-apoptotic effects of mesenchymal stem cell-derived extracellular vesicles (EVs) in experimental models of acute kidney injury (AKI). The graphic displays both in vivo (animal) and in vitro (cell culture) models where EVs are administered to target Tubular Epithelial Cells (TECs). A detailed nephron illustration highlights the renal tubule as the site of action. The central mechanism shows the transition of 'Apoptotic TECs' to 'Living TECs' through various molecular signaling pathways. Different types of EVs are labeled, including MSC-EV miRNAs, MSC-MV, hUC-MSC-EV, MSC-EX, MSC-EXO miR-199a-3p, and hWJMSC-EV miR-30. Key molecular outcomes depicted include the downregulation of pro-apoptotic markers such as Caspase 1, 3, 7, and 9, p38MAPK, Bax, Sema3A, and DRP1, alongside the upregulation of anti-apoptotic factors like Bcl-2, AKT, and ERK. The diagram also mentions the modulation of PI3K and mTOR pathways. This resource is designed for advanced medical education in nephrology and regenerative medicine, focusing on therapeutic cellular mechanisms and molecular nephropathology.
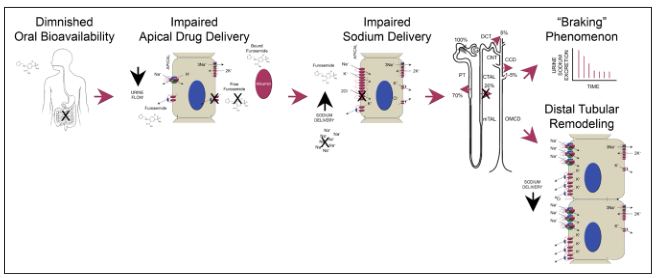
Summary : This figure illustrates the sequential mechanisms underlying diuretic resistance, specifically focusing on furosemide, from diminished oral bioavailability to distal tubular remodeling and the "braking" phenomenon in the nephron. flowchart: # Nodes : • Diminished Oral Bioavailability (text, human outline with stomach marked, furosemide molecule, downward arrow for urine flow) • Impaired Apical Drug Delivery (rectangular cell diagram, furosemide molecules, albumin, Na+ and K+ channels, blocked delivery indicated) • Impaired Sodium Delivery (rectangular cell diagram, furosemide, Na+ and K+ channels, blocked sodium delivery) • "Braking" Phenomenon (nephron schematic, percentage sodium reabsorption at different segments: PT 70%, TAL 20%, DCT 7%, CCD 5%; small line graph showing decrease in sodium excretion over time) • Distal Tubular Remodeling (rectangular cell diagrams, increased sodium delivery, altered channel expression) # Connectors : • Arrows connect each node in left-to-right sequence, indicating progression of mechanisms. • Each arrow is solid and points to the next step in the process. # Layout : • Linear, left-to-right arrangement. • Each node is visually separated and contains both text and schematic/chemical illustrations. • The nephron schematic is centrally placed, with percentages and segment labels (PT, TAL, CTAL, DCT, CCD, OMCD, CN). # Analysis : • The flowchart demonstrates a stepwise progression: initial reduction in oral bioavailability leads to impaired drug delivery at the apical membrane, which then causes impaired sodium delivery in the nephron. This results in the "braking" phenomenon, where sodium excretion decreases over time, and ultimately leads to distal tubular remodeling with altered sodium channel expression. The figure visually links each mechanism, highlighting how resistance to diuretics develops through multiple renal and pharmacokinetic adaptations.
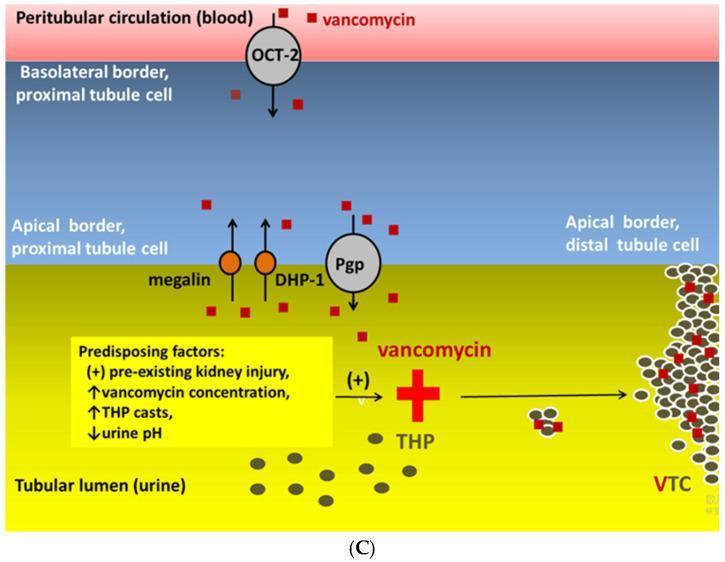
A medical pathophysiology diagram illustrating the formation of vancomycin-associated tubular casts (VTC) within the nephron. The schematic depicts four horizontal compartments: the peritubular circulation (blood), the proximal tubule cell (basolateral and apical borders), and the tubular lumen (urine). Vancomycin molecules, represented as red squares, are shown entering the proximal tubule cell from the blood via the OCT-2 (organic cation transporter 2) at the basolateral border. At the apical border, reabsorption is mediated by megalin and dehydropeptidase-1 (DHP-1), while P-glycoprotein (Pgp) facilitates transport between the lumen and distal tubule cells. In the tubular lumen, vancomycin interacts with Tamm-Horsfall glycoprotein (THP), leading to the formation of large VTC aggregates (indicated by a red plus sign). A yellow text box highlights predisposing factors for VTC formation, including pre-existing kidney injury, elevated vancomycin concentration, increased THP casts, and decreased urine pH. This diagram serves as an educational tool for understanding the localized necrotic and obstructive mechanisms of vancomycin-induced acute kidney injury (VA-AKI).
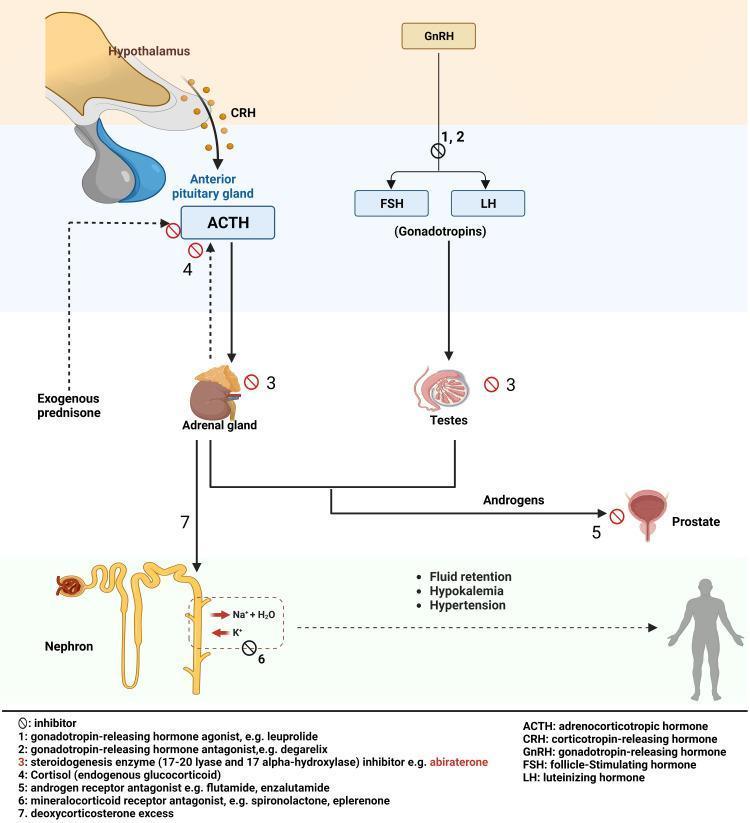
A comprehensive medical diagram illustrating the hypothalamic-pituitary-adrenal (HPA) and hypothalamic-pituitary-gonadal (HPG) axes, detailing the mechanism of action for prostate cancer pharmacotherapies. The illustration shows the hypothalamus releasing CRH and GnRH, which stimulate the anterior pituitary gland to secrete ACTH and gonadotropins (FSH/LH), respectively. These hormones target the adrenal glands and testes to produce androgens and cortisol. Key pharmacological interventions are indicated by inhibitory icons: abiraterone (inhibiting CYP17A1), exogenous prednisone (providing negative feedback to suppress ACTH), degarelix (GnRH antagonist), and androgen receptor antagonists like enzalutamide acting on the prostate. A central focus is the pathophysiology of secondary mineralocorticoid excess: the diagram traces how inhibition of steroidogenesis leads to deoxycorticosterone accumulation, affecting the nephron. Visible renal outcomes include sodium and water retention, potassium excretion (hypokalemia), and clinical hypertension. The diagram includes a legend identifying mineralocorticoid receptor antagonists (spironolactone/eplerenone) as agents used to mitigate these electrolyte imbalances.
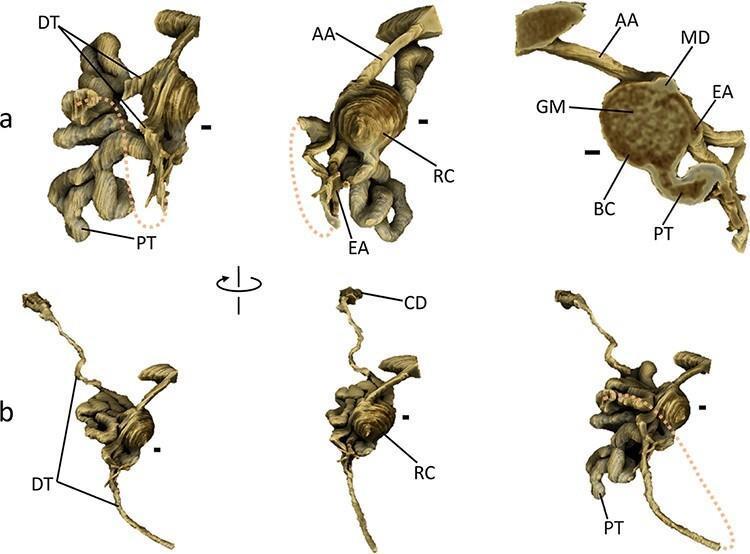
Anatomical diagram featuring high-resolution 3D renderings of a single mouse nephron, highlighting renal microstructure and spatial arrangement. Panel (a) provides detailed views of the renal corpuscle (RC), demonstrating the spherical Bowman's capsule (BC) and internal glomerulus (GM). It clearly illustrates the vascular pole with the afferent arteriole (AA), efferent arteriole (EA), and the macula densa (MD) of the distal tubule (DT) forming a v-shaped contact point. The tubular pole shows the exit of the highly convoluted proximal tubule (PT). Panel (b) illustrates the longitudinal progression from the renal corpuscle through the PT and DT to the collecting duct (CD). The rendering distinguishes between the intensely convoluted segments near the corpuscle and the straighter distal segments of the tubules. Key educational concepts include the juxtaglomerular apparatus anatomy, the morphology of glomerular filtration components, and the physical relationship between various segments of the nephron and their associated vasculature, essential for understanding renal physiology and pathology.
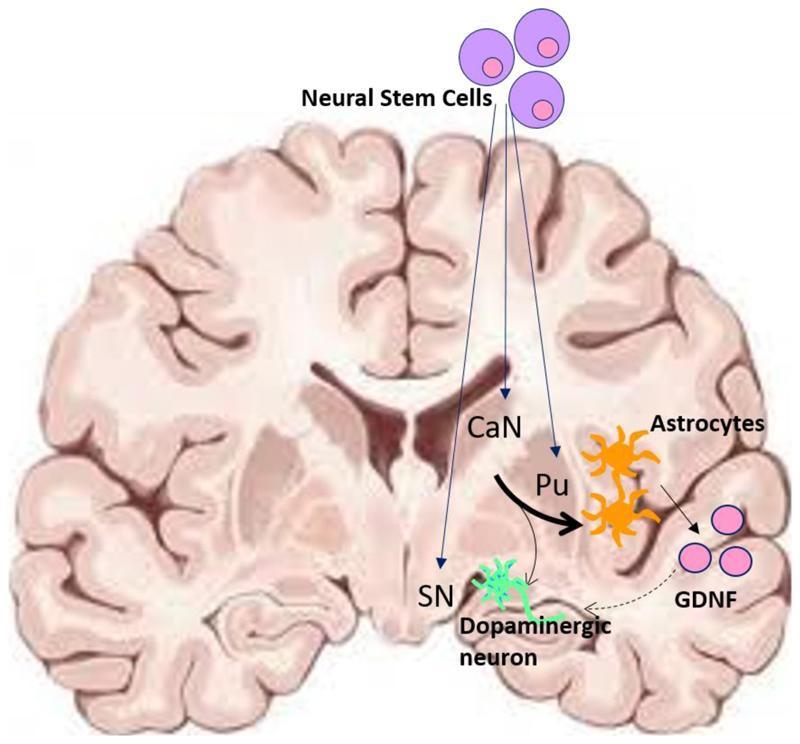
This medical illustration is a combined anatomical diagram and pathophysiology mechanism of action chart depicting the use of parthenogenetic neural stem cells (NSCs) in the treatment of Parkinson's Disease (PD). Superimposed on a coronal cross-section of a human brain, the diagram shows the targeted implantation sites for NSCs: the caudate nucleus (CaN), the putamen (Pu), and the substantia nigra (SN). The schematic illustrates the terminal differentiation of these implanted NSCs into two key cell types: orange-colored astrocytes located in the striatum and green-colored dopaminergic neurons near the substantia nigra. Solid arrows indicate conversion pathways, with varying thicknesses representing differentiation efficiencies. A dotted arrow signifies neurotrophic support, specifically the provision of glial cell line-derived neurotrophic factor (GDNF)—represented by purple circles—from the differentiated astrocytes to both intrinsic and grafted dopaminergic neurons. This visual summary highlights the dual therapeutic strategy of cell replacement and neurotrophic support within the nigrostriatal pathway to ameliorate the motor deficits associated with PD neurodegeneration.
loop diuretic furosemide thiazide mechanism of action classification
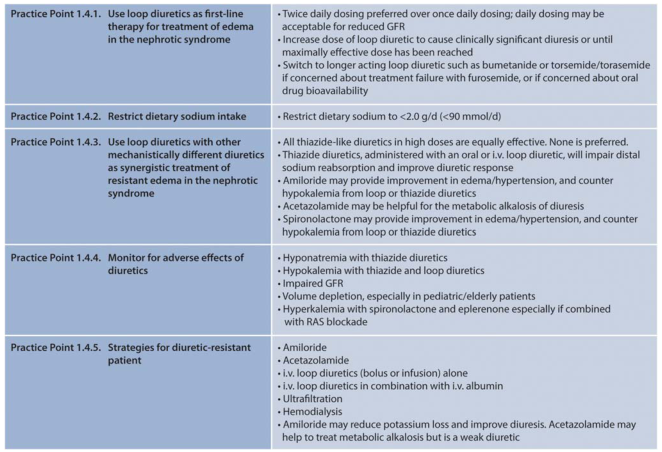
<table><thead><tr><th>Practice Point 1.4.1. Use loop diuretics as first-line therapy for treatment of edema in the nephrotic syndrome</th><th>• Twice daily dosing preferred over once daily dosing; daily dosing may be acceptable for reduced GFR • Increase dose of loop diuretic to cause clinically significant diuresis or until maximally effective dose has been reached • Switch to longer acting loop diuretic such as bumetanide or torsemide/torasemide if concerned about treatment failure with furosemide, or if concerned about oral drug bioavailability</th></tr></thead><tbody><tr><td>Practice Point 1.4.2. Restrict dietary sodium intake</td><td>• Restrict dietary sodium to <2.0 g/d (<90 mmol/d)</td></tr><tr><td>Practice Point 1.4.3. Use loop diuretics with other mechanistically different diuretics as synergistic treatment of resistant edema in the nephrotic syndrome</td><td>• All thiazide-like diuretics in high doses are equally effective. None is preferred. • Thiazide diuretics, administered with an oral or i.v. loop diuretic, will impair distal sodium reabsorption and improve diuretic response • Amiloride may provide improvement in edema/hypertension, and counter hypokalemia from loop or thiazide diuretics • Acetazolamide may be helpful for the metabolic alkalosis of diuresis • Spironolactone may provide improvement in edema/hypertension, and counter hypokalemia from loop or thiazide diuretics</td></tr><tr><td>Practice Point 1.4.4. Monitor for adverse effects of diuretics</td><td>• Hyponatremia with thiazide diuretics • Hypokalemia with thiazide and loop diuretics • Impaired GFR • Volume depletion, especially in pediatric/elderly patients • Hyperkalemia with spironolactone and eplerenone especially if combined with RAS blockade</td></tr><tr><td>Practice Point 1.4.5. Strategies for diuretic-resistant patient</td><td>• Amiloride • Acetazolamide • i.v. loop diuretics (bolus or infusion) alone • i.v. loop diuretics in combination with i.v. albumin • Ultrafiltration • Hemodialysis • Amiloride may reduce potassium loss and improve diuresis. Acetazolamide may help to treat metabolic alkalosis but is a weak diuretic</td></tr></tbody></table>
<table><tr><td>Practice Point 1.4.1. Use loop diuretics as first-line therapy for treatment of edema in the nephrotic syndrome</td><td>• Twice daily dosing preferred over once daily dosing; daily dosing may be acceptable for reduced GFR<br>• Increase dose of loop diuretic to cause clinically significant diuresis or until maximally effective dose has been reached<br>• Switch to longer acting loop diuretic such as bumetanide or torsemide/torasemide if concerned about treatment failure with furosemide, or if concerned about oral drug bioavailability</td></tr><tr><td>Practice Point 1.4.2. Restrict dietary sodium intake</td><td>• Restrict dietary sodium to <2.0 g/d (<90 mmol/d)</td></tr><tr><td>Practice Point 1.4.3. Use loop diuretics with other mechanistically different diuretics as synergistic treatment of resistant edema in the nephrotic syndrome</td><td>• All thiazide-like diuretics in high doses are equally effective. None is preferred.<br>• Thiazide diuretics, administered with an oral or i.v. loop diuretic, will impair distal sodium reabsorption and improve diuretic response<br>• Amiloride may provide improvement in edema/hypertension, and counter hypokalemia from loop or thiazide diuretics<br>• Acetazolamide may be helpful for the metabolic alkalosis of diuresis<br>• Spironolactone may provide improvement in edema/hypertension, and counter hypokalemia from loop or thiazide diuretics</td></tr><tr><td>Practice Point 1.4.4. Monitor for adverse effects of diuretics</td><td>• Hyponatremia with thiazide diuretics<br>• Hypokalemia with thiazide and loop diuretics<br>• Impaired GFR<br>• Volume depletion, especially in pediatric/elderly patients<br>• Hyperkalemia with spironolactone and eplerenone especially if combined with RAS blockade</td></tr><tr><td>Practice Point 1.4.5. Strategies for diuretic-resistant patient</td><td>• Amiloride<br>• Acetazolamide<br>• i.v. loop diuretics (bolus or infusion) alone<br>• i.v. loop diuretics in combination with i.v. albumin<br>• Ultrafiltration<br>• Hemodialysis<br>• Amiloride may reduce potassium loss and improve diuresis. Acetazolamide may help to treat metabolic alkalosis but is a weak diuretic</td></tr></table>
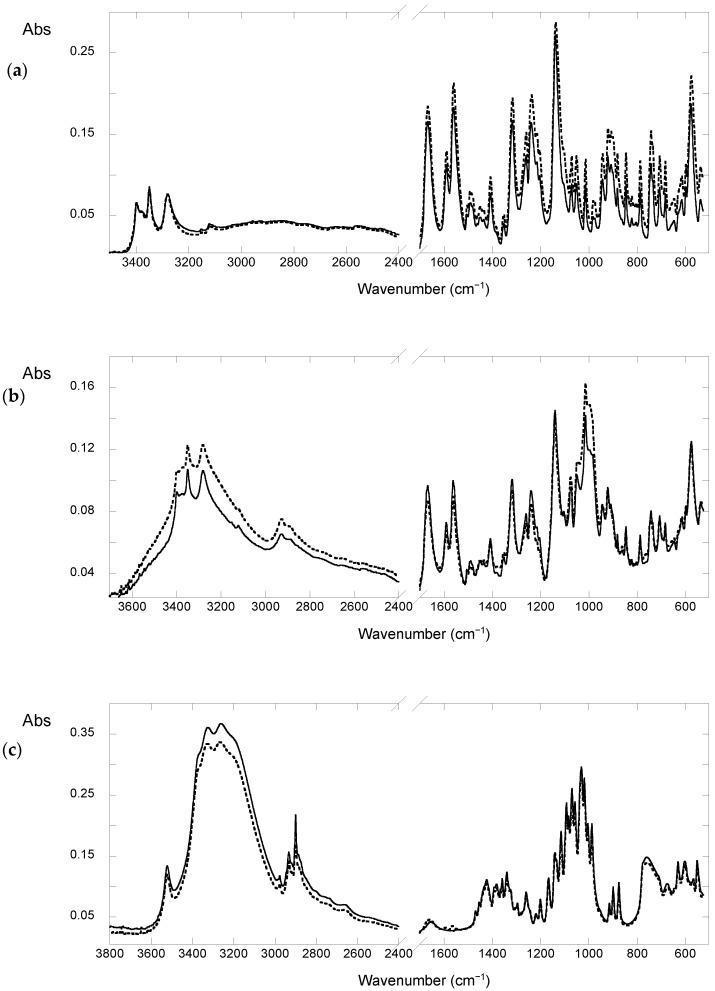
The image displays four panels (a, b, c, d) showing Fourier Transform Infrared-Attenuated Total Reflection (FTIR-ATR) spectra used in pharmaceutical stability studies of the loop diuretic furosemide (FUR). The x-axis represents the wavenumber (cm⁻¹), ranging from approximately 3800 to 6000 cm⁻¹, and the y-axis shows absorbance (Abs). Panel (a) compares unaged (straight line) and UV-aged (dotted line) furosemide tablets, highlighting key peaks for NH/OH stretching (3500–3000 cm⁻¹), carbonyl stretching (1668 cm⁻¹), and amine bending (1560 and 1492 cm⁻¹). Panel (b) illustrates the spectrum of furosemide combined with starch, noting a characteristic starch band at 998 cm⁻¹ in yellow-aged spots. Panels (c) and (d) analyze tablets containing lactose, demonstrating that yellowing in these formulations is spectrally consistent with pure furosemide degradation products (dimers and aggregates) rather than excipient interference. These diagnostic graphs illustrate the photodegradation mechanisms of pharmaceutical agents and the influence of common excipients on drug stability and physical manifestation (yellowing).
Summary : This figure illustrates the sequential mechanisms underlying diuretic resistance, specifically focusing on furosemide, from diminished oral bioavailability to distal tubular remodeling and the "braking" phenomenon in the nephron. flowchart: # Nodes : • Diminished Oral Bioavailability (text, human outline with stomach marked, furosemide molecule, downward arrow for urine flow) • Impaired Apical Drug Delivery (rectangular cell diagram, furosemide molecules, albumin, Na+ and K+ channels, blocked delivery indicated) • Impaired Sodium Delivery (rectangular cell diagram, furosemide, Na+ and K+ channels, blocked sodium delivery) • "Braking" Phenomenon (nephron schematic, percentage sodium reabsorption at different segments: PT 70%, TAL 20%, DCT 7%, CCD 5%; small line graph showing decrease in sodium excretion over time) • Distal Tubular Remodeling (rectangular cell diagrams, increased sodium delivery, altered channel expression) # Connectors : • Arrows connect each node in left-to-right sequence, indicating progression of mechanisms. • Each arrow is solid and points to the next step in the process. # Layout : • Linear, left-to-right arrangement. • Each node is visually separated and contains both text and schematic/chemical illustrations. • The nephron schematic is centrally placed, with percentages and segment labels (PT, TAL, CTAL, DCT, CCD, OMCD, CN). # Analysis : • The flowchart demonstrates a stepwise progression: initial reduction in oral bioavailability leads to impaired drug delivery at the apical membrane, which then causes impaired sodium delivery in the nephron. This results in the "braking" phenomenon, where sodium excretion decreases over time, and ultimately leads to distal tubular remodeling with altered sodium channel expression. The figure visually links each mechanism, highlighting how resistance to diuretics develops through multiple renal and pharmacokinetic adaptations.
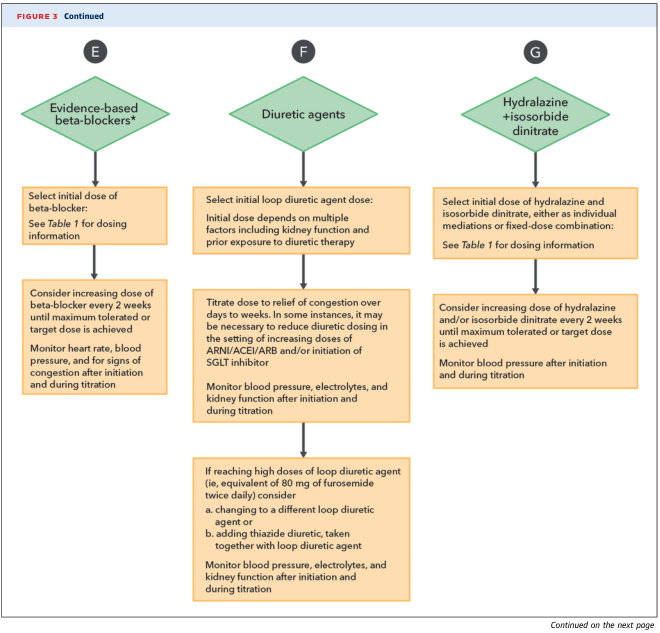
Summary : This figure presents a flowchart outlining the medication titration and monitoring process for three drug classes used in heart failure management: evidence-based beta-blockers, diuretic agents, and hydralazine plus isosorbide dinitrate. Each pathway details initial dosing, titration steps, monitoring parameters, and considerations for dose adjustments. flowchart: # Nodes : • Evidence-based beta-blockers* (green diamond) – Select initial dose of beta-blocker: See Table 1 for dosing information (rectangle) – Consider increasing dose of beta-blocker every 2 weeks until maximum tolerated or target dose is achieved; Monitor heart rate, blood pressure, and for signs of congestion after initiation and during titration (rectangle) • Diuretic agents (green diamond) – Select initial loop diuretic agent dose: Initial dose depends on multiple factors including kidney function and prior exposure to diuretic therapy (rectangle) – Titrate dose to relief of congestion over days to weeks. In some instances, it may be necessary to reduce diuretic dosing in the setting of increasing doses of ARNI/ACEI/ARB and/or initiation of SGLT inhibitor; Monitor blood pressure, electrolytes, and kidney function after initiation and during titration (rectangle) – If reaching high doses of loop diuretic agent (i.e., equivalent of 80 mg of furosemide twice daily) consider: a. changing to a different loop diuretic agent or b. adding thiazide diuretic, taken together with loop diuretic agent; Monitor blood pressure, electrolytes, and kidney function after initiation and during titration (rectangle) • Hydralazine + isosorbide dinitrate (green diamond) – Select initial dose of hydralazine and isosorbide dinitrate, either as individual medications or fixed-dose combination: See Table 1 for dosing information (rectangle) – Consider increasing dose of hydralazine and/or isosorbide dinitrate every 2 weeks until maximum tolerated or target dose is achieved; Monitor blood pressure after initiation and during titration (rectangle) # Connectors : • Each green diamond (medication class) leads downward to its respective initial dosing rectangle. • Each initial dosing rectangle leads downward to a titration/monitoring rectangle. • For diuretic agents, the titration/monitoring rectangle leads further downward to a high-dose management rectangle. • All connectors are vertical arrows, indicating a top-to-bottom flow. # Layout : • Three parallel vertical columns, each representing a medication class (E: beta-blockers, F: diuretic agents, G: hydralazine + isosorbide dinitrate). • Each column flows from a green diamond (medication class) at the top, through one or more orange rectangles (steps), in a linear sequence. • The diuretic agents column is the only one with three steps; the others have two. # Analysis : • The flowchart provides a clear, stepwise approach for titrating and monitoring three key heart failure medication classes. • All pathways emphasize gradual dose increases (every 2 weeks for beta-blockers and hydralazine/isosorbide dinitrate) and close monitoring of vital signs and laboratory parameters. • The diuretic agents pathway includes additional complexity, with guidance for high-dose scenarios and consideration of combination diuretic therapy. • The structure supports individualized patient management based on response and tolerance.

<table> <tr> <th>COR</th> <th>LOE</th> <th>RECOMMENDATIONS</th> </tr> <tr> <td style="background-color:#4CAF50;color:white;text-align:center;">1</td> <td style="background-color:#90B4D6;color:white;text-align:center;">B-NR</td> <td>1. In patients with HF who have fluid retention, diuretics are recommended to relieve congestion, improve symptoms, and prevent worsening HF (1-5).</td> </tr> <tr> <td style="background-color:#4CAF50;color:white;text-align:center;">1</td> <td style="background-color:#90B4D6;color:white;text-align:center;">B-NR</td> <td>2. For patients with HF and congestive symptoms, addition of a thiazide (e.g., metolazone) to treatment with a loop diuretic should be reserved for patients who do not respond to moderate- or high-dose loop diuretics to minimize electrolyte abnormalities (6).</td> </tr> </table>
Diuretics - Complete Overview
Sources: Lippincott Illustrated Reviews: Pharmacology, Guyton & Hall Textbook of Medical Physiology, Braunwald's Heart Disease, Goodman & Gilman's Pharmacological Basis of Therapeutics
Definition and General Mechanism
- Guyton & Hall, p. 424: "Most diuretics that are used clinically act by decreasing renal tubular sodium reabsorption, which causes natriuresis and diuresis... in most cases, increased water excretion occurs secondary to inhibition of tubular sodium reabsorption."
Classification by Site of Action
| Class | Examples | Tubular Site | Transporter Inhibited | Max FENa↑ |
|---|---|---|---|---|
| Osmotic diuretics | Mannitol | Proximal tubule + descending loop | Non-specific (osmotic) | ~10% |
| Carbonic anhydrase inhibitors | Acetazolamide | Proximal tubule | Carbonic anhydrase → ↓ H+ secretion → ↓ HCO3- reabsorption | ~5% |
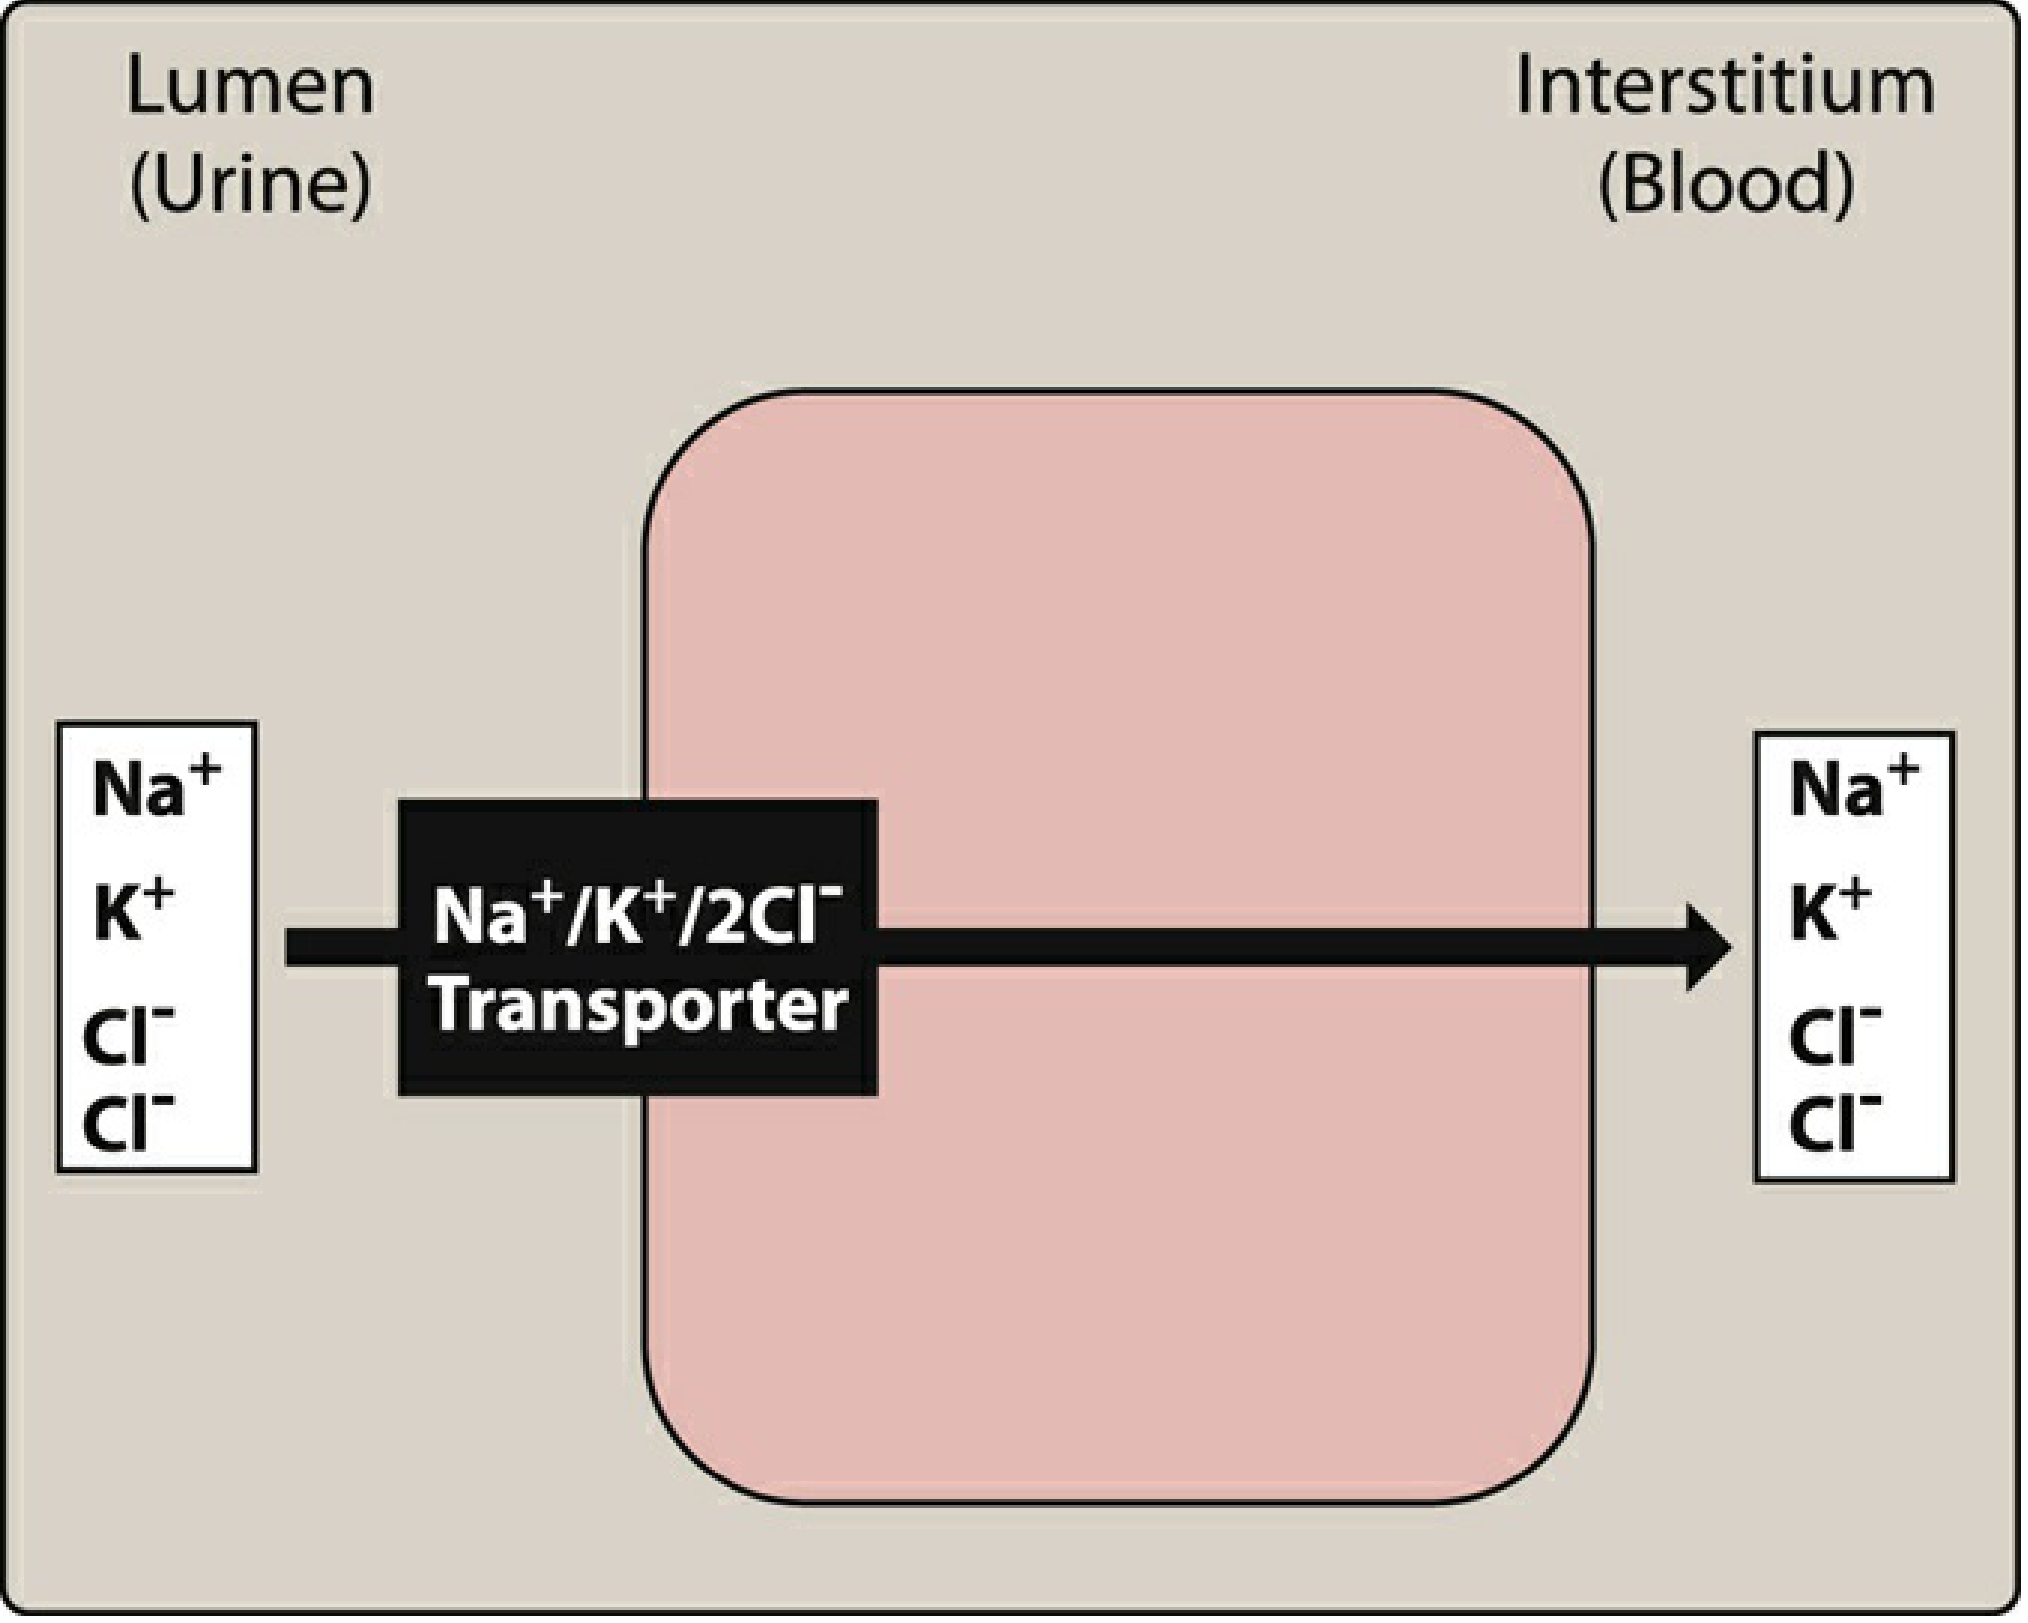
| Loop diuretics | Furosemide, bumetanide, torsemide, ethacrynic acid | Thick ascending loop of Henle | NKCC2 (Na+/K+/2Cl- cotransporter) | 20-25% |
| Thiazides | Hydrochlorothiazide, chlorthalidone, indapamide, metolazone | Distal convoluted tubule (DCT) | NCC (Na+/Cl- cotransporter) | 5-10% |
| K+-sparing: MR antagonists | Spironolactone, eplerenone, finerenone | Collecting duct | Mineralocorticoid receptor → ↓ ENaC expression | ~2-3% |
| K+-sparing: ENaC blockers | Amiloride, triamterene | Collecting duct | ENaC (epithelial Na+ channel) | ~2-3% |
| Aquaretics | Tolvaptan, demeclocycline | Collecting duct | AVP/V2 receptor | Free water only |
1. Loop Diuretics
Mechanism
- 20-25% of filtered Na+ is lost (highest of any diuretic class)
- The transepithelial potential difference that drives Ca2+ and Mg2+ reabsorption is abolished
- Free water clearance is enhanced
Pharmacokinetics
| Drug | Oral Bioavailability | Duration |
|---|---|---|
| Furosemide | 40-70% (unpredictable, range 10-90%) | ~6 hours ("Lasts Six") |
| Bumetanide | 80-100% | ~4-6 hours |
| Torsemide | 80-100% | ~6-8 hours (longer) |
| Ethacrynic acid | Moderate | Slower onset, less reversible |
Therapeutic Uses
- Acute pulmonary edema (IV furosemide - most important emergency use)
- Edema from heart failure, renal failure, nephrotic syndrome, cirrhosis
- Hypercalcemia (increase tubular Ca2+ excretion)
- Hyperkalemia
- Hypertensive crisis
Adverse Effects
- Hypovolemia/hypotension - can be rapid and severe
- Hypokalemia - heavy Na+ delivery to collecting duct → increased Na/K exchange → most common adverse effect
- Hypomagnesemia - urinary Mg2+ wasting
- Ototoxicity - reversible or permanent hearing loss; worst with ethacrynic acid and IV rapid infusion; additive with aminoglycosides
- Hyperuricemia - compete with uric acid for organic acid secretory system; can precipitate gout
- Metabolic alkalosis (hypokalemic, hypochloremic)
- Hyperglycemia (less than thiazides)
2. Thiazide Diuretics
Mechanism
- Only increase FENa by 5-10%
- Decrease free water clearance (can cause dilutional hyponatremia)
- Decrease Ca2+ excretion (Na+ depletion augments proximal Ca2+ reabsorption) - useful in hypercalciuria/kidney stones
Therapeutic Uses
- Hypertension (first-line agent; reduces mortality in multiple RCTs)
- Mild heart failure and edema
- Nephrogenic diabetes insipidus (paradoxical effect - reduces urine volume by inducing mild Na+ depletion, triggering AVP-independent water reabsorption)
- Hypercalciuria and calcium-containing kidney stones
- Osteoporosis prevention (increases Ca2+ retention)
Adverse Effects
- Hyponatremia - most clinically significant electrolyte problem with thiazides (thiazides decrease free water clearance, unlike loop diuretics which increase it)
- Hypokalemia - increased Na+ to collecting duct → K+ exchange; aggravated by secondary hyperaldosteronism
- Hyperglycemia - K+ depletion impairs insulin secretion from pancreatic beta cells; caution in diabetes
- Hyperuricemia - compete with uric acid for organic acid secretion; precipitate gout
- Hyperlipidemia (variable, generally modest)
- Hypercalcemia (from Ca2+ retention)
Urinary Electrolyte Changes - Comparative Table
| Diuretic | Urine Volume | Na+ | K+ | Ca2+ | Mg2+ | HCO3- | Uric Acid |
|---|---|---|---|---|---|---|---|
| Thiazide | Initial ↑, Chronic ↓ | ↑ | ↑ | ↓ | ↑ | ↑ | ↓ |
| Loop | ↑↑↑ | ↑↑ | ↑↑ | ↑↑ | ↑ | ↑↑ | ↓ |
| K+-sparing | ↑ | ↑ | ↓ | -- | -- | -- | -- |
3. Potassium-Sparing Diuretics
A. Mineralocorticoid Receptor (MR) Antagonists
- Reduces Na+ reabsorption
- Reduces K+ secretion → retains potassium
- Primary hyperaldosteronism (Conn's syndrome) - diagnostic and therapeutic
- Heart failure (especially with reduced EF) - mortality benefit
- Resistant hypertension (4th-line add-on)
- Edema from cirrhosis and nephrotic syndrome (preferred in cirrhosis)
- Hirsutism/PCOS (spironolactone, off-label)
B. Epithelial Na+ Channel (ENaC) Blockers
- Adjunct to loop or thiazide diuretics (to prevent K+ loss)
- Lithium-induced nephrogenic DI (amiloride blocks Li+ entry via ENaC)
- Liddle syndrome (constitutively active ENaC - amiloride is drug of choice)
4. Carbonic Anhydrase Inhibitors
- Glaucoma (reduces aqueous humor production - primary use)
- Altitude sickness (metabolic acidosis stimulates breathing)
- Metabolic alkalosis complicating aggressive loop diuretic therapy
- Idiopathic intracranial hypertension
- Some epilepsies
5. Osmotic Diuretics
- Raised intracranial pressure (ICP)
- Acute renal failure prevention (maintains tubular flow)
- Acute glaucoma
6. Aquaretics (Vaptans)
- Euvolemic or hypervolemic hyponatremia (SIADH, heart failure, cirrhosis)
- Autosomal dominant polycystic kidney disease (tolvaptan slows cyst growth)
Diuretic Resistance
- Reduced oral bioavailability - especially furosemide in gut edema
- Impaired apical delivery - albumin binding of furosemide in nephrotic syndrome
- Braking phenomenon - compensatory Na+ reabsorption in unaffected nephron segments after prolonged use
- Distal tubular hypertrophy - chronic loop diuretic use upregulates NCC in the DCT
- Switch from furosemide to torsemide/bumetanide (better bioavailability)
- Add a thiazide diuretic to a loop diuretic (sequential nephron blockade)
- IV bolus or continuous infusion of loop diuretics
- IV albumin with IV furosemide in nephrotic syndrome
- Add amiloride or acetazolamide
- Ultrafiltration if pharmacologic options exhausted
Clinical Uses Summary
| Indication | First-Line Diuretic | Notes |
|---|---|---|
| Acute pulmonary edema | Loop (IV furosemide) | Rapid onset essential |
| Chronic heart failure | Loop ± thiazide | Loop preferred when GFR low |
| Hypertension (uncomplicated) | Thiazide (chlorthalidone) | RCT mortality benefit |
| Hypertension with heart failure/CKD | Loop diuretic | |
| Cirrhosis/ascites | Spironolactone + furosemide | MR antagonist preferred |
| Nephrotic syndrome | Loop diuretics | Twice daily preferred |
| Primary hyperaldosteronism | Spironolactone | Diagnostic + therapeutic |
| Hypercalcemia | Loop (+ saline) | Enhance Ca2+ excretion |
| Hypercalciuria / Ca2+ stones | Thiazide | Decrease Ca2+ excretion |
| Raised ICP | Mannitol | IV bolus |
| SIADH/hyponatremia | Vaptan or loop | Vaptan if euvolemic |
| Glaucoma | Acetazolamide | Topical/oral |
| Altitude sickness | Acetazolamide | |
| Liddle syndrome | Amiloride | ENaC blocker |
| Nephrogenic DI (lithium-induced) | Amiloride |
Key Pharmacology Mnemonics
- Loop diuretics = "BEEF" - Bumetanide, Ethacrynic acid, Furosemide (+ torsemide)
- Loop = "ABCDE" adverse effects: Acid-base (alkalosis), Blood volume ↓, Ca2+↑ excretion, Deafness (ototoxicity), Electrolytes (K+, Na+, Mg2+)
- Thiazides vs Loop on calcium: Thiazides "Treasure" calcium (retain it) vs Loop diuretics "Lose" calcium
- K+-sparing = "SAFE with K+": Spironolactone, Amiloride, Finerenone, Eplerenone (plus triamterene)