
9 Quadrants
What are you referring to with '9 Quadrants'?
9 Quadrants of Abdomen and organs involved in them
9 regions quadrants of abdomen diagram anatomy
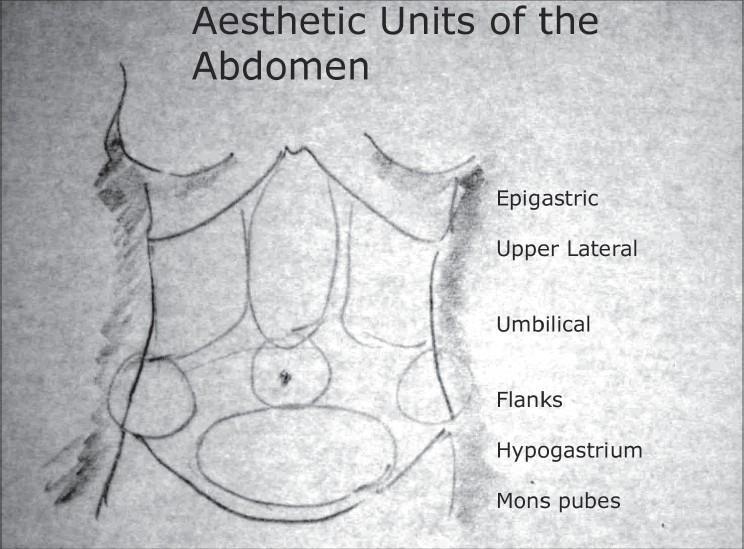
Anatomical Diagram: This is a grayscale, freehand medical sketch illustrating the aesthetic units of the human anterior abdominal wall, primarily used in plastic and reconstructive surgery planning (e.g., liposuction or abdominoplasty). The illustration outlines a female torso from the inframammary fold to the pubic region. Key anatomical landmarks depicted include the costal margins, the midline linea alba, and the umbilical center. The abdomen is segmented into specific zones of clinical interest, which are labeled on the right side. From superior to inferior, these regions include: the central Epigastric unit, bilateral Upper Lateral regions, the central Umbilical unit, bilateral Flanks (lumbar regions), the Hypogastrium (suprapubic region), and the Mons pubes. The drawing serves as an educational tool for identifying discrete topographical areas for surgical contouring and understanding the surface anatomy of the abdominal musculature and overlying adipose tissue distribution.
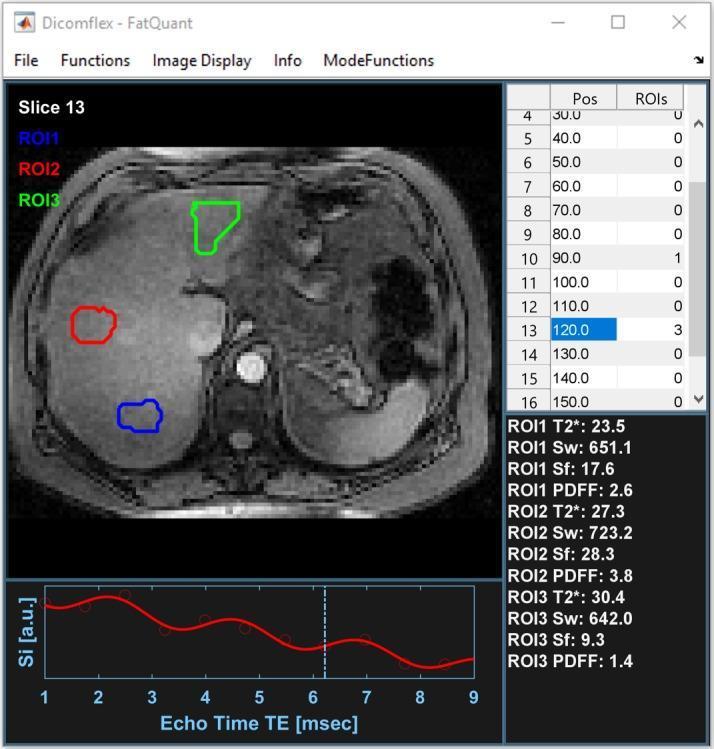
A graphical user interface (GUI) for FatQuant, a medical imaging software application used for liver fat quantification. The interface is divided into four primary quadrants. The top-left quadrant displays a grayscale axial MRI slice (Slice 13) of the upper abdomen, showing the liver and surrounding anatomy. Three colored regions of interest (ROIs) are manually delineated on the liver parenchyma: ROI1 (blue), ROI2 (red), and ROI3 (green). The top-right quadrant contains a data table listing slice positions and the number of ROIs per slice, with slice position 120.0 (Slice 13) highlighted. The bottom-left quadrant features a signal intensity (Si) versus echo time (TE) plot, showing a curve-fitting model (red line) against data points (circles) for one of the ROIs over a range of 1 to 9 msec. The bottom-right quadrant displays calculated quantitative parameters for each ROI, including T2* relaxation time, water signal (Sw), fat signal (Sf), and Proton Density Fat Fraction (PDFF). This interface demonstrates a multi-echo chemical shift-encoded MRI (CSE-MRI) post-processing workflow for assessing hepatic steatosis.
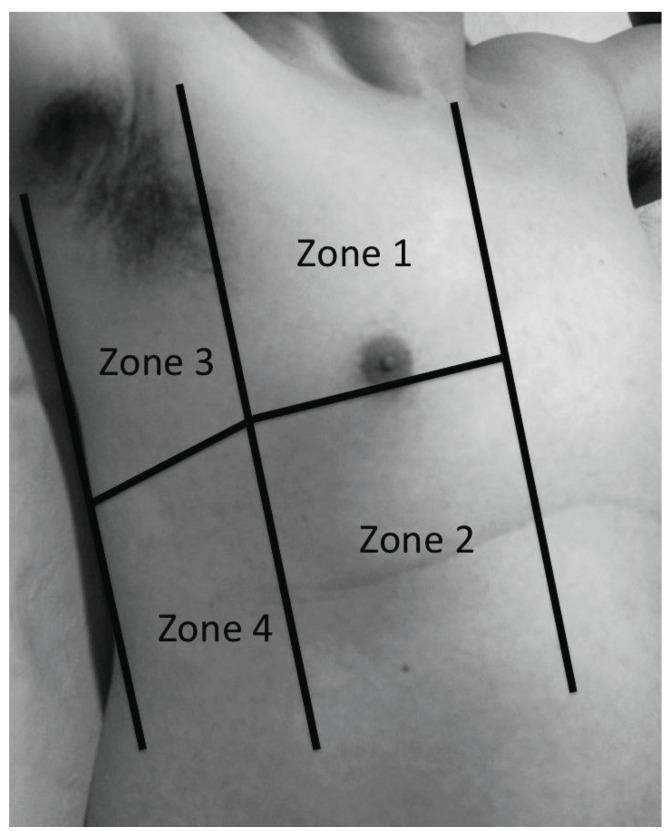
A clinical photograph in grayscale illustrating the surface anatomy and mapping of the right thoracic wall. The chest is partitioned into four distinct quadrants or 'zones' using superimposed anatomical reference lines. Three vertical lines represent the parasternal, anterior axillary, and posterior axillary lines, while a single horizontal line bisects these vertically to create upper and lower halves. The resulting regions are labeled: Zone 1 (upper anterior), Zone 2 (lower anterior), Zone 3 (upper lateral), and Zone 4 (lower lateral). This anatomical diagram is intended for clinical training, specifically for standardizing the physical examination of skin lesions or documenting findings during point-of-care ultrasound (POCUS) protocols. The image provides a clear reference for medical students and clinicians to accurately localize pathology relative to thoracic landmarks.
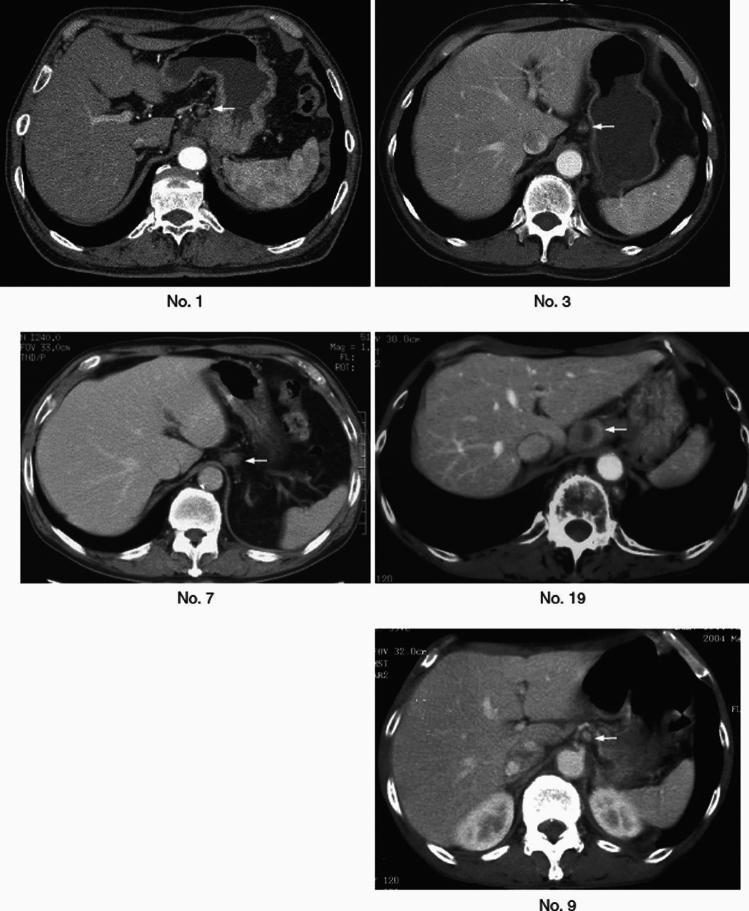
This composite diagnostic image features five axial CT scans of the upper abdomen, labeled No. 1, 3, 7, 19, and 9. The images demonstrate cross-sectional anatomy including the liver, spleen, stomach, kidneys, and vertebrae. The primary educational focus is on abdominal lymphadenopathy. In each panel, white arrows highlight soft-tissue density structures located in the retroperitoneum and perigastric regions. Specifically, the arrows indicate lymph nodes situated in the gastrohepatic ligament and the para-aortic area, adjacent to the abdominal aorta and the lesser curvature of the stomach. These nodes vary slightly in size and visibility across the different levels, appearing as rounded or ovoid masses. The images serve to teach the radiological identification of regional lymph nodes in the context of abdominal malignancies, such as esophageal or gastric cancer staging, emphasizing their spatial relationship to major vasculature and the diaphragmatic crura.
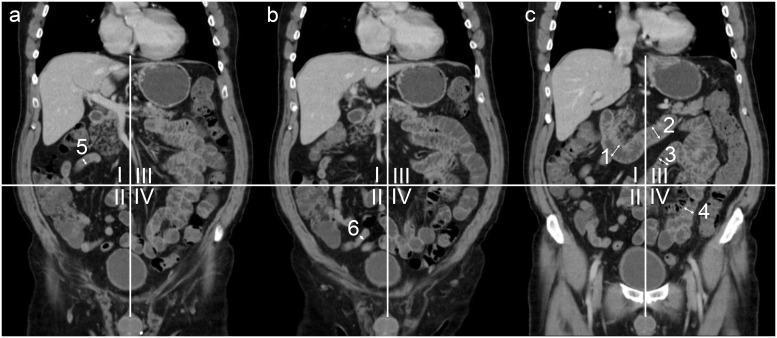
Three consecutive coronal reformatted CT slices (a, b, c) of a human abdomen and pelvis, illustrating a standardized anatomical classification of small bowel segments. The abdomen is partitioned into four quadrants (I–IV) by a vertical midline and a horizontal line intersecting at the umbilicus. The imaging demonstrates the localization of specific bowel segments: (1) descending duodenum, (2) horizontal duodenum, (3) proximal jejunum in the upper left quadrant (III), (4) distal jejunum in the lower left quadrant (IV), (5) proximal ileum in the upper right quadrant (I), and (6) distal ileum in the lower right quadrant (II). The images show typical contrast-enhanced visceral organs including the liver, spleen, kidneys, and urinary bladder. The diagnostic focus is on defining regional bowel anatomy for clinical evaluation of luminal distension and localization of pathology using a quadrant-based model.
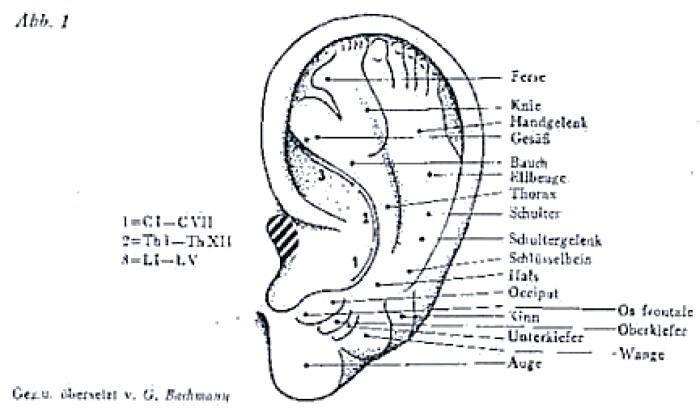
This historical anatomical diagram illustrates the first auricular map published by Paul Nogier in 1957, depicting the somatotopic organization of the human body onto the external ear (auricle). The diagram represents the 'inverted fetus' model, where specific anatomical regions of the auricle correspond to distinct body systems and structures. The lower lobule represents the head and facial structures, with labels in German for the eye (Auge), cheek (Wange), and jaw (Oberkiefer/Unterkiefer). Progressing superiorly along the antihelix and scapha, the map identifies musculoskeletal regions including the shoulder (Schulter), thorax, abdomen (Bauch), and extremities such as the hand (Handgelenk) and foot (Ferse) located at the uppermost portion of the helix. The spinal column is numerically mapped along the antihelix: 1 corresponds to the cervical vertebrae (CI-CVII), 2 to the thoracic vertebrae (ThI-ThXII), and 3 to the lumbar vertebrae (LI-LV). This illustration is a foundational element in auricular medicine and acupuncture, demonstrating the topographical relationship between the ear's surface and systemic human anatomy.
A clean labeled anatomical diagram showing the 9 regions of the abdomen. Two vertical mid-clavicular lines and two horizontal lines (subcostal and intertubercular/transtubercular) divide the abdomen into a 3x3 grid. Top row: Right Hypochondriac, Epigastric, Left Hypochondriac. Middle row: Right Lumbar (Lateral), Umbilical, Left Lumbar (Lateral). Bottom row: Right Iliac Fossa (Inguinal), Hypogastric (Pubic), Left Iliac Fossa (Inguinal). Each region clearly labeled. Educational anatomy style.
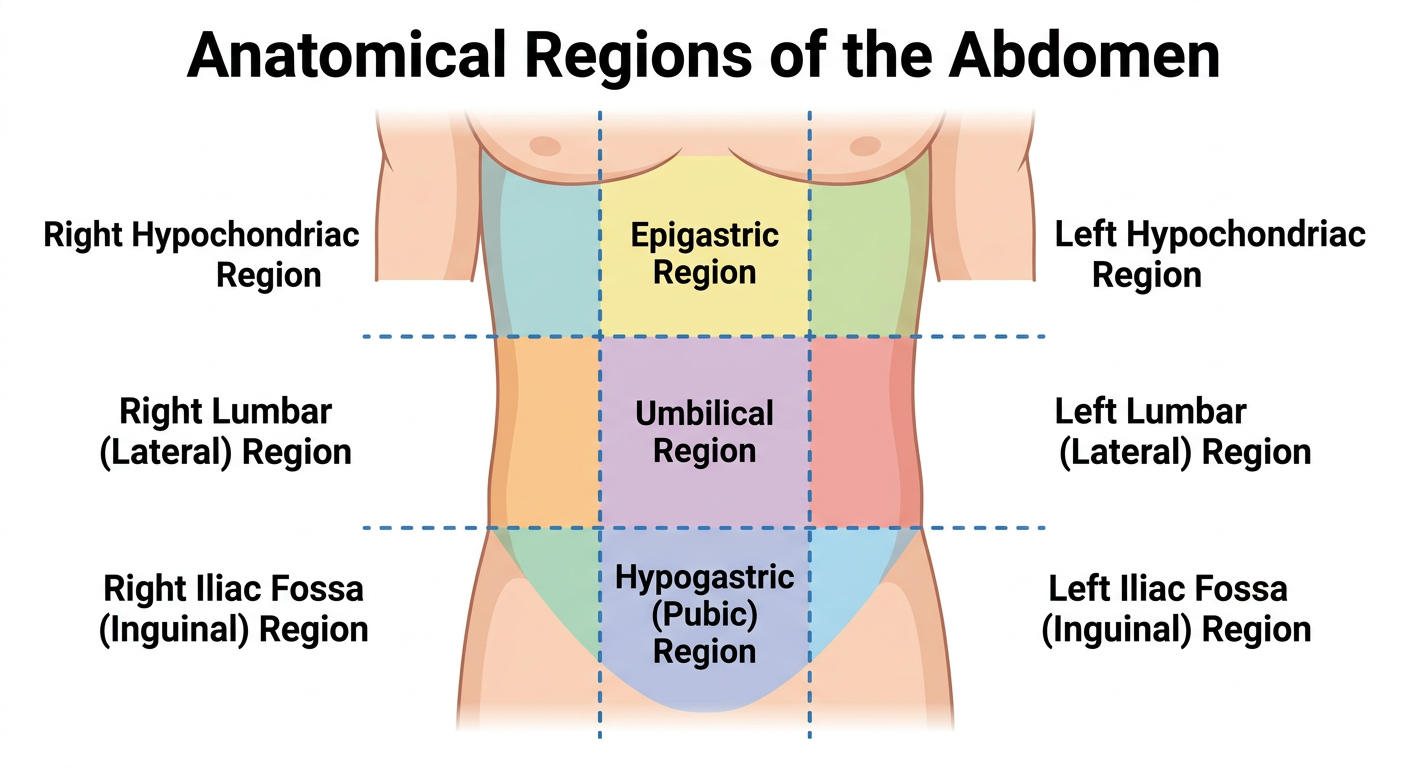
How the 9 Regions Are Formed
- 2 vertical lines - right and left mid-clavicular lines (passing through the mid-points of the clavicles)
- 2 horizontal lines - the subcostal plane (at the lower border of rib 10) and the transtubercular/intertubercular plane (connecting the iliac tubercles)
The 9 Regions and Their Contents
TOP ROW
| Region | Key Organs / Structures |
|---|---|
| Right Hypochondriac | Right lobe of liver, gallbladder, right kidney (upper pole), right adrenal gland, hepatic flexure of colon, small intestine |
| Epigastric | Stomach (body & pylorus), liver (left lobe), duodenum (1st & 2nd parts), pancreas (head & body), aorta, inferior vena cava (IVC), spleen (tip) |
| Left Hypochondriac | Spleen, stomach (fundus & greater curvature), left kidney (upper pole), left adrenal gland, splenic flexure of colon, tail of pancreas |
MIDDLE ROW
| Region | Key Organs / Structures |
|---|---|
| Right Lumbar (Lateral) | Ascending colon, right kidney (lower pole), right ureter, part of duodenum, loops of small intestine (jejunum) |
| Umbilical | Transverse colon, small intestine (jejunum & ileum loops), duodenum (3rd & 4th parts), head of pancreas, aorta, IVC, ureters |
| Left Lumbar (Lateral) | Descending colon, left kidney (lower pole), left ureter, loops of small intestine (jejunum/ileum) |
BOTTOM ROW
| Region | Key Organs / Structures |
|---|---|
| Right Iliac Fossa (Inguinal) | Caecum, appendix, terminal ileum, right ureter (lower part), right ovary & fallopian tube (in females), right spermatic cord (in males) |
| Hypogastric (Pubic / Hypogastrium) | Urinary bladder, uterus & cervix (in females), sigmoid colon, rectum (upper part), prostate (in males), small intestine loops |
| Left Iliac Fossa (Inguinal) | Sigmoid colon, left ureter (lower part), left ovary & fallopian tube (in females), left spermatic cord (in males), small intestine loops |
Clinical Relevance
- Right Iliac Fossa pain - appendicitis, ovarian cyst/ectopic pregnancy
- Epigastric pain - peptic ulcer, pancreatitis, GERD, MI (referred)
- Right Hypochondriac pain - cholecystitis, hepatitis
- Left Hypochondriac pain - splenic rupture/infarct, gastric ulcer
- Hypogastric pain - UTI, pelvic inflammatory disease, bladder pathology
- Loin (Lumbar) pain - renal colic, pyelonephritis
- Umbilical pain - early appendicitis (visceral, referred), small bowel obstruction
Note: The 9-region system is more precise than the simpler 4-quadrant system (RUQ, LUQ, RLQ, LLQ) and is preferred in detailed clinical and anatomical descriptions.