
Explain in easy way as I'm short on time . Go straight to official website of UHS and pick up syllabus of Integrated Modular system of 4th Yera MBBS of block 10 . Take yourself as a topper student who always take distinctions in every block . I have to prepare for all other subjects as well . Mkae disctionction level notes for every subject that is included in Block 10 that should include Mnemonics, flow charts, tips and tricks to rember each and everything according to LOS of 4th year MBBS . Also go though the pattern on the basis of my exam is on Monday . Explain everyhing in such a way that will make my concepts crystal clear. Also tell me how to pick up scenarios as there is Whole MCQS based paper according to new pattern of UHS. How to identify these exam traps and score maximum marks in Whole Block 10 as i haven't completed any subject of block 10 as it should be done in proper way. You are my ruthless mentor. Don't sugar coat anything . Just remain straight to the point and I do not want your sympathy . Make notes of every subject by taking all standard books as your reference books of every subject. Notes should contain each and everything that will help me to memorize it visually in form of gross and microscopic images and X-Ray images .
UHS University of Health Sciences Lahore 4th year MBBS Block 10 Integrated Modular System syllabus LOS
UHS 4th year MBBS IMS Block 10 subjects learning outcomes 2024 2025
http://lmdc.edu.pk/wp-content/uploads/2026/01/Fourth-Year-LM…
http://lmdc.edu.pk/wp-content/uploads/2026/01/Fourth-Year-LM…
- Community Medicine & Family Health-II (25+15 = 40 marks)
- GIT & Nutrition-II (35+5 = 40 marks)
- Eye-I (30 marks) + ENT-I (30 marks)
http://lmdc.edu.pk/wp-content/uploads/2026/01/Fourth-Year-LM…
GIT pathology peptic ulcer gastric cancer liver cirrhosis histology
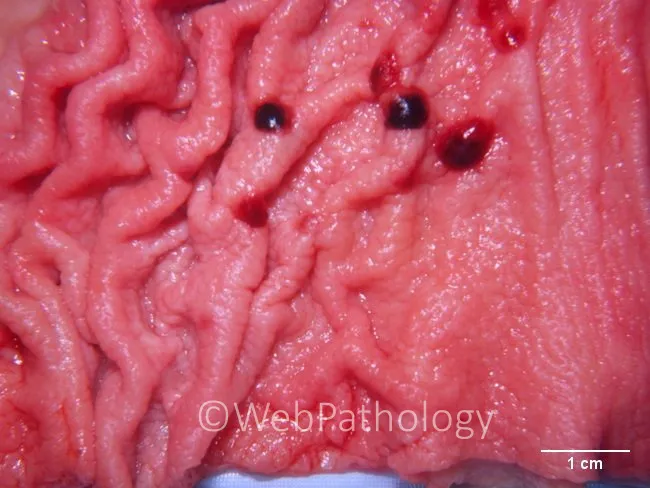
Macroscopic gross pathology photograph of the stomach obtained at autopsy showing multiple gastric ulcers within the mucosal surface. The gastric mucosa is reddened and edematous with irregular, shallow to deep ulcers distributed along the greater curvature and body, separated by residual folds. Several ulcers exhibit dark, coalescent centers consistent with hemorrhagic necrosis; surrounding mucosa appears friable and inflamed. In the clinical context of disseminated candidiasis in a patient with cirrhosis, these ulcers likely reflect fungal invasion with microabscess formation, ischemic injury, and inflammatory response. The image provides a luminal surface view with a 1 cm calibration bar for scale. The pattern of gastric involvement may accompany similar lesions in the liver, spleen, and other gastrointestinal segments as part of systemic candidiasis. The macroscopic appearance supports a diagnosis of infectious gastroenteritis secondary to hematogenous seeding by Candida species, particularly in immunocompromised or severely ill individuals. Correlation with histopathology would reveal yeast forms, pseudohyphae, and abscesses within the mucosa or submucosa and granulocytic infiltration. Clinically, this finding is significant due to the high mortality of disseminated candidiasis in cirrhotics, requiring prompt antifungal therapy and systemic workup. Differential diagnoses include peptic ulcer disease, ischemic gastritis, stress ulcers, and bacterial/GI fungal infections.
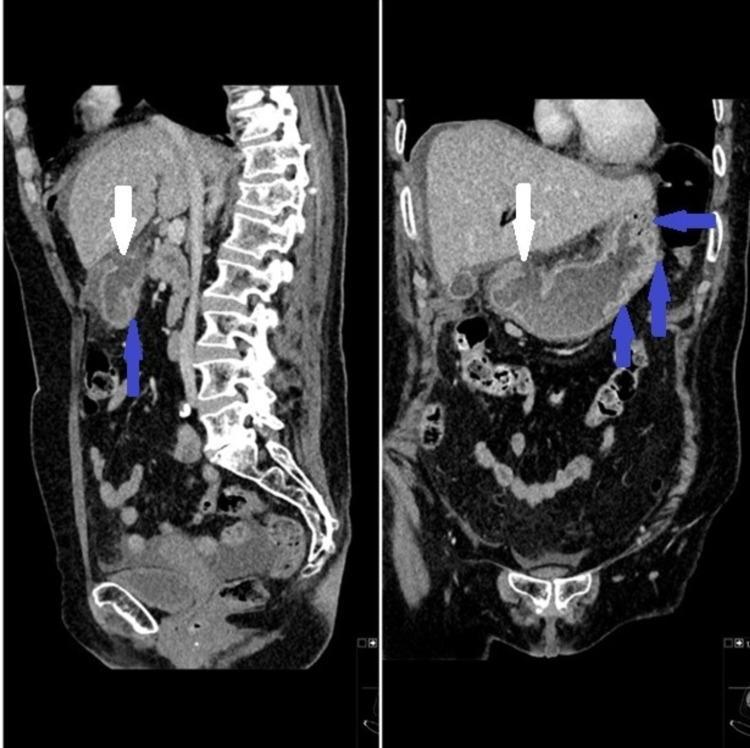
This diagnostic image displays Computed Tomography (CT) scans of the abdomen in sagittal (left) and coronal (right) reformatted views, illustrating a perforated peptic ulcer. The primary pathology is a focal defect in the gastric wall, indicated by a white arrow, representing the site of perforation. Surrounding the defect, there is significant thickening and increased density of the gastric wall, marked by blue arrows, which is characteristic of inflammatory wall edema. Anatomical landmarks include the liver situated superiorly, the vertebral column visible posteriorly in the sagittal plane, and the stomach centrally located. These multi-planar reconstructions are clinically significant for identifying the exact anatomical site of bowel perforation and assessing secondary signs like localized inflammation. The content is suitable for medical education focusing on gastroenterology, radiology, and emergency surgical diagnosis of acute abdominal conditions.
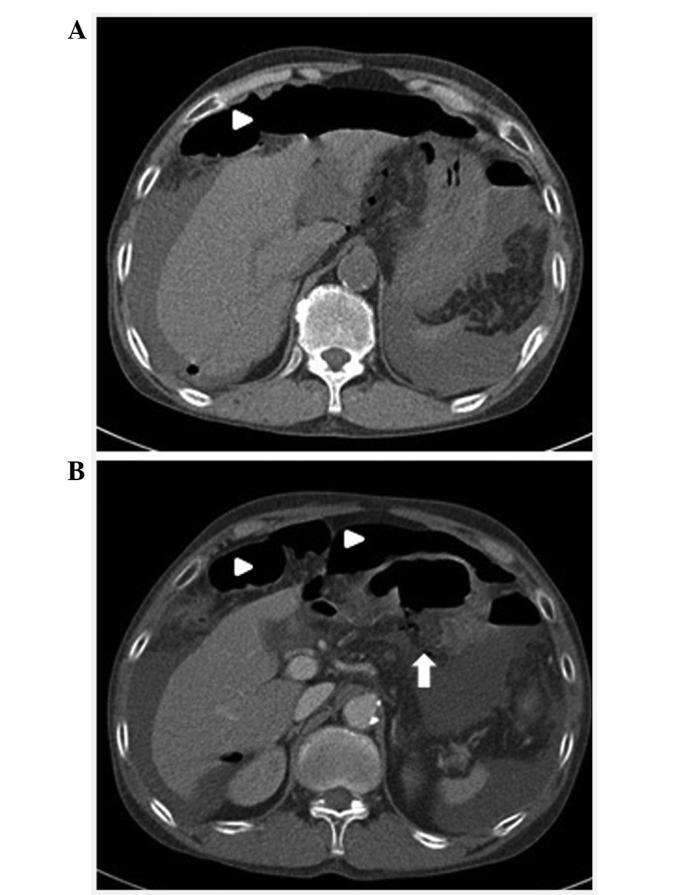
This diagnostic image consists of two axial abdominal computed tomography (CT) scans, labeled A and B, demonstrating complications from a hollow viscus perforation in the context of chronic liver disease. Image A (upper panel) shows significant pneumoperitoneum, visualized as prominent anterior free air collections (arrowhead), and a markedly shrunken, nodular liver consistent with cirrhosis. High-attenuation fluid is present in the paracolic gutters and perisplenic space, suggesting ascites or hemoperitoneum. Image B (lower panel) shows more localized free air (arrowheads) and identifies the likely source of the pneumoperitoneum: a gastric ulcer perforation located at the posterior wall of the gastric antrum (indicated by the white arrow). The imaging findings collectively illustrate a surgical emergency involving a perforated peptic ulcer in a patient with underlying portal hypertension and hepatic atrophy. These scans are critical for medical students and radiology residents in identifying the classic radiographic signs of extraluminal gas, abdominal fluid collection, and secondary signs of liver cirrhosis.
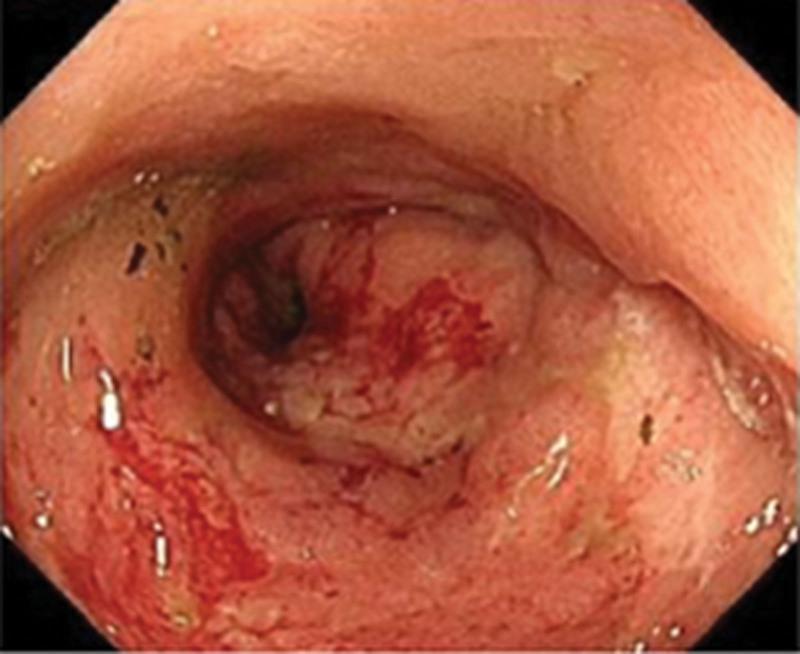
This clinical photograph shows an endoscopic view of the gastric lumen, highlighting a large, irregular giant ulcer characteristic of advanced gastric cancer. The gastric mucosa is significantly distorted with prominent inflammatory changes and irregular thickening. The ulcer base is covered with a thick, whitish fibrinous exudate and areas of necrotic tissue. Active bleeding is visible, evidenced by fresh bright red blood on the ulcer surface and adjacent mucosa. The margins of the lesion appear raised and nodular, suggesting a malignant process rather than a benign peptic ulcer. The surrounding gastric folds are blunted and erythematous, indicating reactive gastritis. This image serves as an educational example of advanced primary gastric malignancy (cT4b) and illustrates the visual indicators of high-grade pathology, including size, friability, and morphological irregularity in a patient undergoing systemic and targeted oncological therapy.
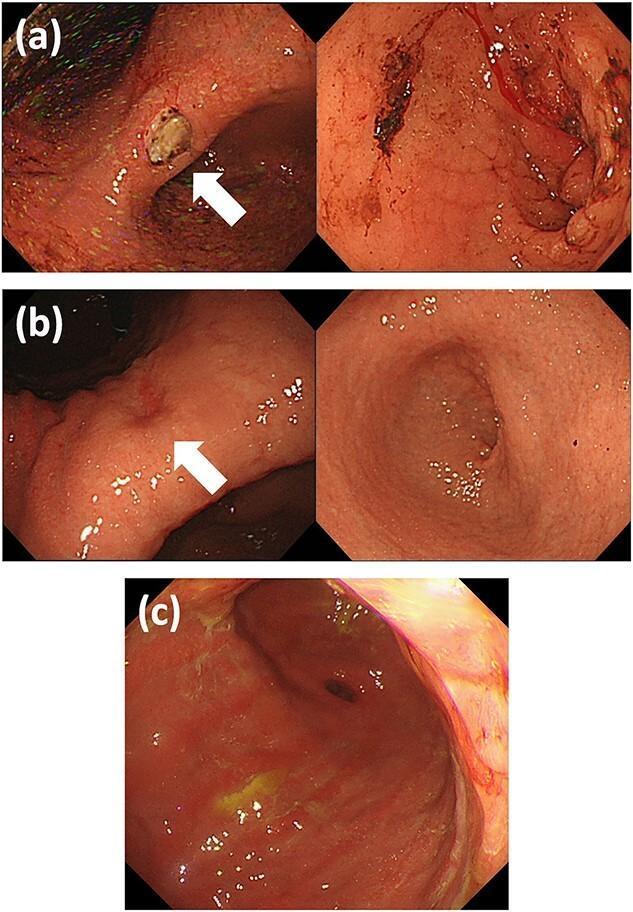
This set of clinical endoscopic photographs displays the progression of gastric pathology in a patient with metastatic invasive lobular carcinoma. Image (a) reveals a localized peptic-like ulcer at the gastric angle, indicated by a white arrow, characterized by a white fibrin base and surrounding reddish, granular mucosa. There is no evidence of pyloric stenosis at this stage. Image (b) shows the evolution to a healed ulcer (white arrow) alongside significant clinical progression: a diffusely thickened and stenotic pyloric ring is visible, indicative of linitis plastica-type changes. Image (c) demonstrates late-stage findings with diffuse tumor infiltration at the gastric antrum. The mucosa appears markedly inflamed, rigid, and exhibits yellowish exudative patches and friability. These images collectively illustrate the endoscopic presentation of gastric metastasis from breast cancer, highlighting the transition from a discrete ulcer to diffuse wall thickening and luminal narrowing characteristic of secondary linitis plastica.
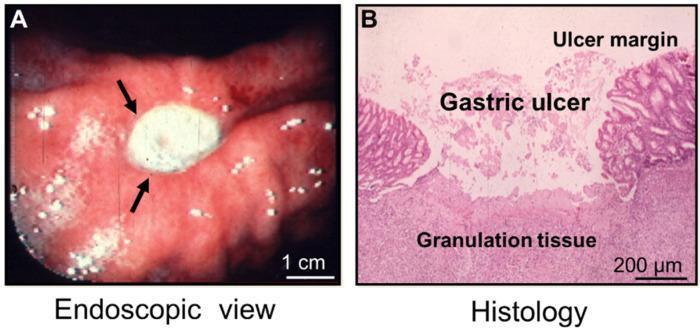
A composite image demonstrating gastric ulcer pathology through clinical imaging and microscopy. Panel A is an endoscopic photograph of a human stomach (lesser curvature), showing a well-demarcated, circular gastric ulcer (black arrows). The ulcer base is covered with opaque, white fibrinopurulent exudate, surrounded by hyperemic, erythematous mucosa with scattered whitish spots. Panel B is a histological section from an experimental model, stained with hematoxylin and eosin (H&E). The micrograph identifies three distinct pathological regions: the 'ulcer margin' with intact mucosal architecture; the central 'gastric ulcer' showing necrotic debris and loss of mucosal integrity; and the underlying 'granulation tissue' base, characterized by a dense layer of fibroblasts and proliferating microvessels. Scale bars indicate 1 cm for the endoscopic view and 200 µm for the histology. This comparison illustrates the clinical macroscopic appearance of a peptic ulcer alongside its microscopic structural components, highlighting the healing zone and the replacement of mucosa with connective tissue.
eye glaucoma cataract retinal detachment ophthalmoscopy
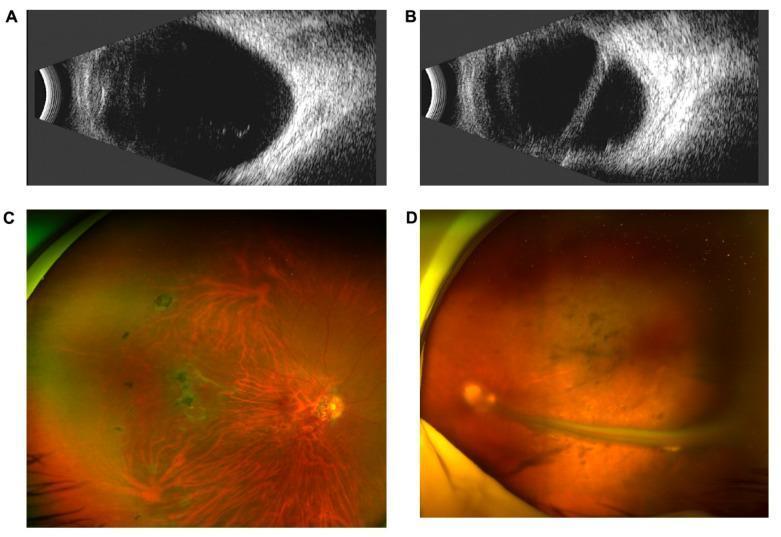
A multi-panel clinical ophthalmic display showing bilateral ocular findings in a patient with suspected Familial Exudative Vitreoretinopathy (FEVR). Panels A and B contain B-scan ultrasonography. Panel A (right eye) reveals diffuse vitreous opacities, while Panel B (left eye) demonstrates a prominent, linear hyper-echogenic band representing a retinal fold or tractional retinal detachment. Panels C and D provide wide-field scanning laser ophthalmoscopy (SLO) fundus images. Panel C (right eye) shows increased retinal vessel branching, straightening of vessels in the posterior pole, and areas of focal nasal pigmentation. Panel D (left eye) depicts a significantly more advanced pathology with a distinct, light-colored elevated retinal fold extending through the vitreous cavity, accompanied by overall hazy visualization consistent with secondary glaucoma and vitreous changes. These diagnostic images are essential for characterizing hereditary vitreoretinal dystrophies and associated structural complications like retinal folds and exudation.

A clinical photograph illustrating the proper technique for direct ophthalmoscopy in a community health or low-resource setting. A healthcare provider is shown in close proximity to an elderly female patient with deeply wrinkled skin and a pigmented fundus. The provider is demonstrating the correct 'flight path' for visualizing the optic nerve, positioned on the horizontal plane at approximately 15 degrees temporal to the patient's right eye. The clinician holds a direct ophthalmoscope (specifically an Arclight device) in his right hand, using his right eye to examine the patient's right eye. His left hand is placed gently on the patient's forehead to stabilize the head and elevate the upper eyelid if necessary. The educational focus is on the physical positioning, equipment handling, and anatomical approach required to bring the optic disc and retinal vessels into view during a funduscopic examination. Relevant clinical concepts include screening for cataract, glaucoma, and macular disease through direct visualization of the posterior segment.
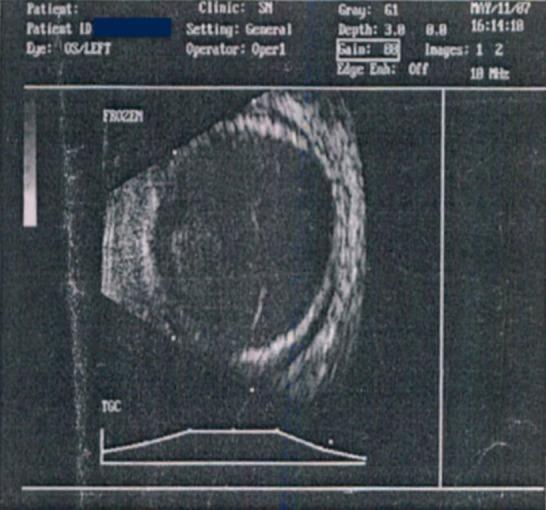
This diagnostic image is a B-scan ultrasonogram (USG) of the left eye (OS), demonstrating significant posterior segment pathology. The ocular B-scan reveals a shallow, 360-degree (circumferential) serous choroidal detachment. This is characterized by the presence of a hypoechoic space between the high-reflectivity sclera and the choroid, showing a characteristic undulating but generally convex-inward configuration. The detachment spans the periphery of the globe. Additional visible features include optic nerve head cupping and thickening of the posterior ocular wall. The anterior segment shows evidence of a flattened chamber and lens opacity consistent with a total cataract. These findings are clinically relevant in the context of secondary glaucoma or vascular anomalies such as a carotid-cavernous fistula (CCF), which can lead to increased venous pressure and subsequent fluid accumulation in the suprachoroidal space. The image serves as a critical educational example of how B-scan ultrasound is used to visualize intraocular structures when direct ophthalmoscopy is obscured by media opacities.
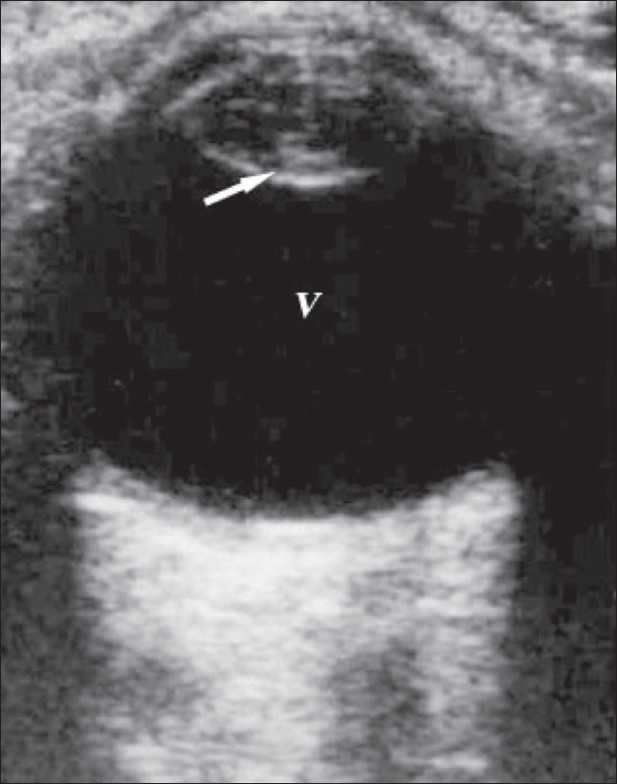
**Imaging Modality:** Ophthalmic B-scan ultrasonography (USG). **Anatomical Region:** Axial view of the globe (eye). **Observed Pathology:** Mature cataract. **Characteristic Visual Features:** The image displays a cross-sectional view of the eye. Within the anterior segment, the crystalline lens appears abnormally prominent. Key sonographic findings include: * **Intralenticular Echoes:** Presence of internal, high-amplitude reflective material within the lens substance, indicating a loss of normal transparency and cortical opacification. * **Posterior Capsule Enhancement:** A distinct, curvilinear hyperechoic signal at the posterior boundary of the lens (marked by a white arrow), representing a marked posterior capsular echo. * **Vitreous Chamber:** The vitreous cavity (labeled "V") appears primarily anechoic (black), suggesting the absence of significant hemorrhage or retinal detachment in this plane. **Key Diagnostic Features:** The combination of increased internal lenticular echogenicity and a highly reflective posterior capsule in a patient with clinical vision loss is diagnostic of a cataract. This modality is particularly useful for evaluating the posterior segment when the ocular media is too opaque for direct ophthalmoscopy.
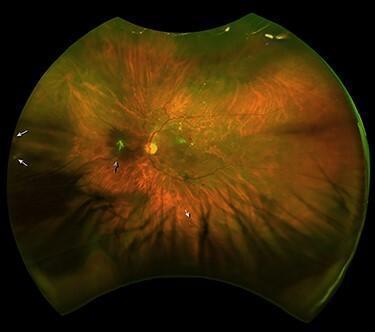
This Scanning Laser Ophthalmoscopy (SLO) image depicts the left eye fundus of a patient following Spontaneous Regression of Rhegmatogenous Retinal Detachment (SRRRD). The wide-field imaging modality shows several key pathological findings. A black arrowhead identifies a focal patch of green-tinged glial tissue located nasal (to the left) of the optic disc. Retinal tears (RT) are visible at approximately the 6:00 and 9:00 o'clock peripheral positions, marked by white arrowheads. The retinal surface exhibits widespread structural changes, including altered texture and corrugated folds, particularly in the inferior and nasal quadrants, which are indicative of chronic retinal detachment and subretinal fluid absorption. Vascular irregularities and pigmentary changes suggest previous retinal pigment epithelium (RPE) stress. This clinical photograph serves as an educational example of the retinal architecture's appearance during spontaneous reattachment and the resulting fibrotic complications such as epiretinal membrane or glial proliferation.
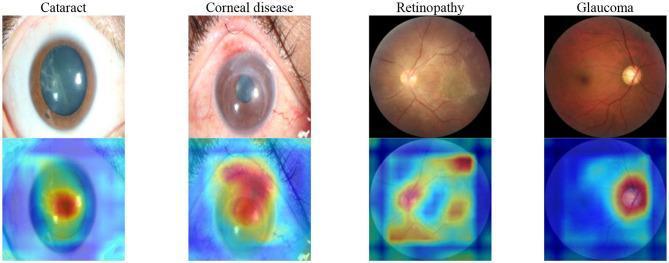
A multi-panel comparison showing ocular surface photographs and retinal fundus images alongside corresponding deep learning saliency (heat) maps for four major eye diseases: Cataract, Corneal disease, Retinopathy, and Glaucoma. The top row presents the clinical images: the cataract photograph shows lens opacification; the corneal disease image demonstrates loss of transparency and neovascularization; the retinopathy and glaucoma images show retinal fundus views. The bottom row displays heatmaps generated via Grad-CAM, indicating the regions of diagnostic focus for the AI model. In Cataract, attention is centered on the pupillary area. In Corneal disease, high attention (red) corresponds to corneal lesions. In Retinopathy, attention is distributed across retinal vessels and the optic disc. In Glaucoma, attention is highly concentrated specifically on the optic nerve head and disc area. This visualization demonstrates the diagnostic logic of a hierarchical deep learning framework for ophthalmological screening, mapping visual features to specific anatomical regions of interest for various clinical classes.
tonsillitis otitis media sinusitis ENT throat nose ear

Summary : This image displays the logo for ENT UK, an organization related to ear, nose, and throat medicine in the United Kingdom. logo: ENT UK Main Elements : • The logo consists of the text "ENT UK" with "ENT" in bold dark blue and "UK" in a lighter blue. • To the left of the text, there is a stylized line drawing representing an ear, nose, and throat in blue. Design Details : • Font: "ENT" uses a bold sans-serif typeface, while "UK" is in a lighter weight. • Colour palette: Dark blue and light blue. • The graphic element is simple and medical-themed, matching the specialty. Spatial Relationships : • The drawing is positioned to the left of the text. • "ENT" and "UK" are on the same line, with "ENT" more visually prominent. Analysis : • The logo uses medical imagery and a professional colour scheme to clearly communicate its association with ear, nose, and throat healthcare in the UK.
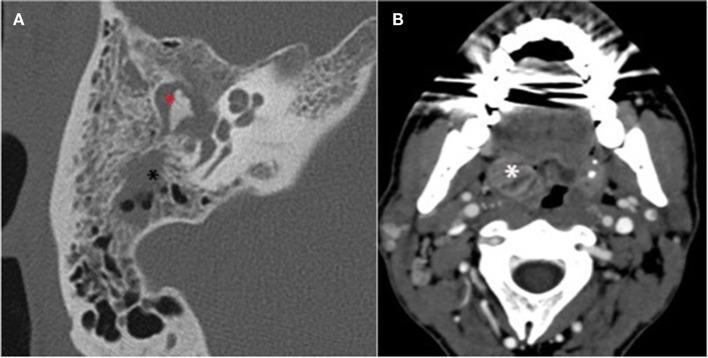
This composite image presents two diagnostic CT scans. Image A is a high-resolution axial CT scan of the right temporal bone, demonstrating acute otitis media. Pathological findings include homogenous soft tissue opacity filling the middle ear (tympanic cavity) and opacification of the mastoid air cells (indicated by a black asterisk), replacing the normal hypodense air pockets. Image B is an axial soft-tissue window CT scan of the neck at the level of the oropharynx. It reveals significant asymmetric swelling and inflammation of the right palatine tonsil (marked with a white asterisk) and surrounding peritonsillar soft tissues, consistent with tonsillitis. The images illustrate the clinical complications of an upper respiratory infection extending to the middle ear and mastoid system. Key educational concepts include temporal bone anatomy, diagnostic imaging for otitis media and mastoiditis, and the identification of inflammatory neck pathology via computed tomography.

logo: ENT UK Summary : This image is a logo for ENT UK, an organization or entity likely related to ear, nose, and throat (ENT) medicine in the United Kingdom. Logo Elements : • The logo features the text "ENTUK" with "ENT" in bold dark blue and "UK" in a lighter blue. • To the left of the text, there is a stylized line drawing representing an ear, nose, and throat in profile, rendered in light blue. • The design is simple, clean, and uses a white background for clarity. Dimensions & Placement : • The logo is horizontally oriented, with the graphic on the left and the text to the right. • The text and graphic are aligned on a single baseline. Analysis : • The logo visually communicates the focus on ear, nose, and throat specialties through the stylized anatomical drawing. • The use of blue tones suggests professionalism and trust, common in medical branding. • The clear, modern font and minimalistic design enhance readability and brand recognition.

logo: ENT UK Summary : This is the logo for ENT UK, a professional association related to ear, nose, and throat (ENT) medicine in the United Kingdom. Design Elements : • The logo features the text "ENTUK" in uppercase letters, with "ENT" in dark blue and "UK" in light blue. • To the left of the text, there is a stylized line drawing of a human face in profile, highlighting the ear, nose, and throat areas. • The design uses a clean, sans-serif font and a white background. Dimensions & Placement : • The face illustration is positioned to the left of the text, aligned with the height of the letters. • The logo is horizontally oriented. Analysis : • The use of blue tones conveys professionalism and trust. • The stylized face visually reinforces the medical specialty (ear, nose, and throat) represented by the organization.
hepatitis B C cirrhosis liver histology microscopic community medicine epidemiology
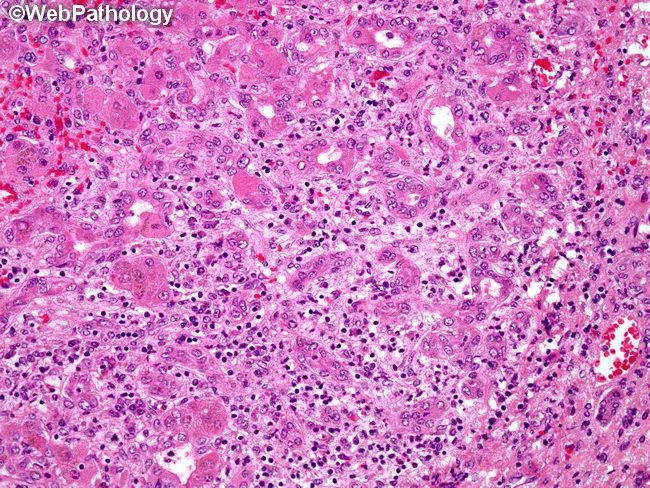
Light microscopic liver histology from a biopsy in acute hepatitis B shows portal areas (portal triads) with dense mononuclear inflammatory infiltrates, predominantly T lymphocytes, often with plasma cells. Inflammation extends from the portal tract into adjacent parenchyma, producing interface activity and mild lobular disarray. Hepatocytes exhibit cytoplasmic ballooning degeneration and scattered apoptotic bodies (Councilman bodies) in degenerating hepatocytes. Focal hepatocellular necrosis may be present, with preserved overall lobular architecture in early disease. Bile ducts within portal tracts are typically preserved; there is no marked cholestasis or fibrotic scarring at this stage. The pattern is compatible with acute viral hepatitis, most commonly hepatitis B, though similar features can appear in other viral or drug-induced liver injuries. Correlation with serology (HBsAg positivity, anti-HBc IgM, HBV DNA) supports the diagnosis. Clinically, the histology explains transaminase elevation and jaundice associated with acute hepatic injury. Diagnostic significance lies in recognizing portal-centric inflammation, interface hepatitis, and hepatocellular injury as a viral hepatitis pattern; differential diagnoses include acute hepatitis A and C, HDV co-infection, drug-induced liver injury, or autoimmune hepatitis. This image is valuable for medical education, pathology teaching, and radiology–pathology correlation discussions. These features emphasize portal inflammation and hepatocyte injury as diagnostic hallmarks for education purposes.
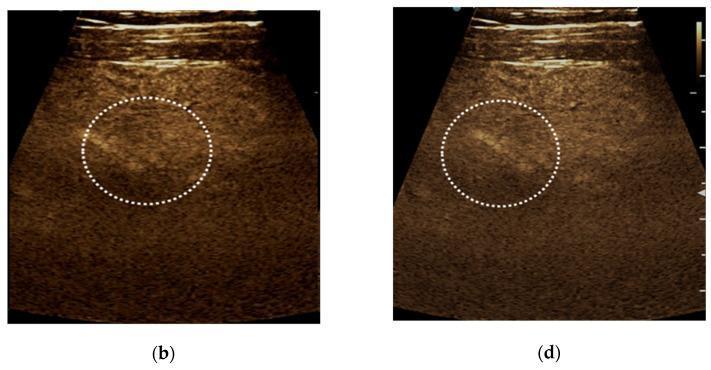
Two side-by-side contrast-enhanced ultrasound (CEUS) images (labeled b and d) demonstrating the enhancement pattern of a small liver lesion in a patient with hepatitis C-related cirrhosis. Image (b) shows the arterial phase, where the focal liver lesion (highlighted within a dotted white circle) exhibits isoenhancement relative to the surrounding liver parenchyma. Image (d) shows the late phase, where the same subcapsular lesion maintains isoenhancement, with no evidence of contrast washout. The background liver shows a nodular surface and heterogeneous echotexture characteristic of cirrhotic remodeling. The absence of arterial hyperenhancement and late-phase washout characterizes this lesion as a regenerative nodule, classified as CEUS LI-RADS 2 (probably benign). This diagnostic imaging series is critical for differentiating benign regenerative nodules from hepatocellular carcinoma in high-risk cirrhotic populations.
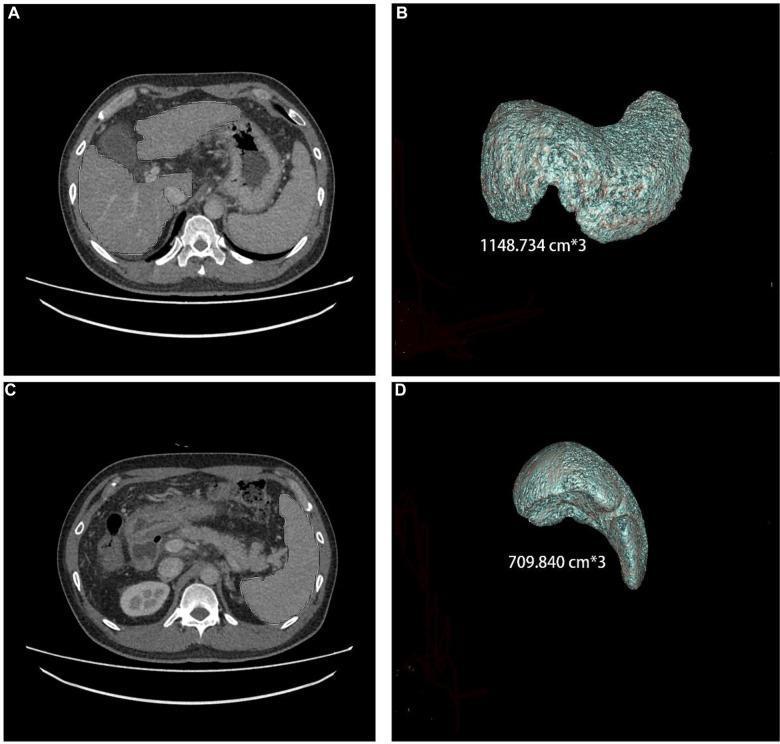
This composite medical image displays abdominal computerized tomography (CT) scans and corresponding 3D volumetric reconstructions of the liver and spleen from a 44-year-old male with chronic hepatitis B cirrhosis. Panels A and C show axial CT slices of the upper abdomen; Panel A highlights the liver in the right upper quadrant, while Panel C focuses on the spleen in the left upper quadrant. Panels B and D present the 3D rendered models used for volumetric quantification. The liver (Panel B) is shown with a calculated volume of 1148.734 cm³ and exhibits a nodular surface morphology characteristic of cirrhotic changes. The spleen (Panel D) has a calculated volume of 709.840 cm³, demonstrating significant splenomegaly, a common secondary finding in portal hypertension related to cirrhosis. These images illustrate the use of thin-slice CT data and specialized workstations for precise organ volumetry in the longitudinal management of chronic liver disease.
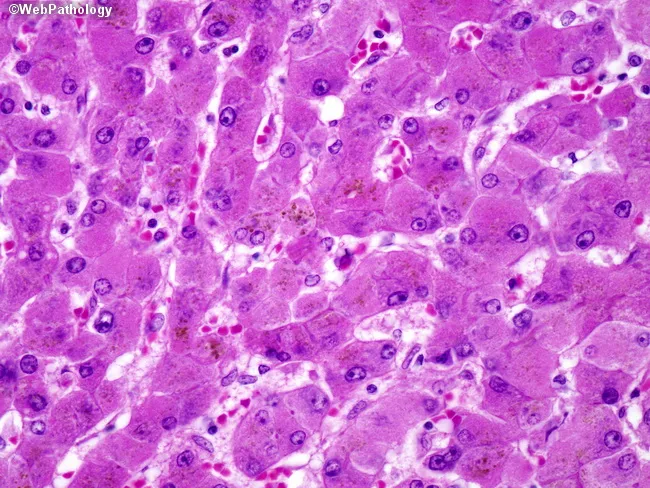
This histopathology image depicts a liver biopsy from a patient with chronic hepatitis B infection showing cirrhosis. The tissue is examined by brightfield light microscopy after Hematoxylin and Eosin staining. The parenchyma demonstrates nodular regeneration separated by dense fibrous septa, characteristic of cirrhotic remodeling. Hepatocytes within nodules are variably enlarged and display ground-glass cytoplasm, reflecting accumulation of hepatitis B surface antigen (HBsAg) within the cytoplasm. The cytoplasmic eosinophilia and moderate ballooning degeneration highlight chronic injury. Infiltrating inflammatory cells, predominantly lymphocytes and plasma cells, are present within portal tracts and fibrous bands, consistent with chronic inflammatory activity. Bile pigment accumulation may be observed in hepatocytes or canaliculi, contributing to intracellular pigment. The overall architectural disruption includes disrupted lobular arrangement and formation of regenerative nodules bordered by thick fibrous bands. The image is representative of HBV-related cirrhosis and emphasizes the histological hallmark features: ground-glass hepatocytes, fibrous septa, regenerative nodules, and hepatocellular inflammation. Clinically, these findings correlate with long-standing HBV replication, potential progression to portal hypertension, and increased risk of hepatocellular carcinoma; thus, this histology supports antiviral management decisions and HCC surveillance strategies, alongside serology and imaging assessments. This image is educational for hepatology and pathology training. Useful for diagnostics and differential diagnosis.
UHS 4th Year MBBS - BLOCK 10: COMPLETE DISTINCTION-LEVEL NOTES
BLOCK 10 STRUCTURE - KNOW THIS FIRST
BLOCK 10 = 4 Modules | 280 Total Marks
┌─────────────────────────────────┬───────────────────────────────────────┐
│ MODULE                          │ MARKS BREAKDOWN                       │
├─────────────────────────────────┼───────────────────────────────────────┤
│ Community Medicine & FH-II      │ 40 MCQs (25 theory + 15 comm med)    │
│ GIT & Nutrition-II              │ 40 MCQs (35 theory + 5 nutrition)     │
│ Eye-I                           │ 30 MCQs                               │
│ ENT-I                           │ 30 MCQs                               │
├─────────────────────────────────┼───────────────────────────────────────┤
│ WRITTEN TOTAL                   │ 140 MCQs = 140 marks                  │
│ PRACTICAL                       │ 10 OSCE (8 marks each) = 80           │
│                                 │ 2 OSVE (10 marks each) = 20           │
│                                 │ 2 Short Cases (20 marks each) = 40    │
│ PRACTICAL TOTAL                 │ 140 marks                             │
│ GRAND TOTAL                     │ 280 marks                             │
└─────────────────────────────────┴───────────────────────────────────────┘
HOW TO CRACK UHS MCQ SCENARIOS - THE RUTHLESS GUIDE
- They ALWAYS give you a clinical vignette - patient age, gender, complaint, sign, investigation result.
- The question tests your next step, diagnosis, or mechanism.
- DO NOT read all 4 options first. Read the stem, form your answer mentally, THEN match it.
| Trap | Example | How to escape |
|---|---|---|
| Look-alike drugs | Omeprazole vs Pantoprazole - both PPIs, one is better for drug interactions | Know the exception drug |
| "Most common" vs "Most specific" | Most common cause vs most specific test are different questions | Underline which word they used |
| Two correct answers | Both A and B seem right | The MORE complete/mechanism-based answer is correct |
| Negation trap | "EXCEPT", "NOT a feature" | Circle the word NOT/EXCEPT before reading options |
| Distractor symptoms | They add 1 extra symptom to confuse diagnosis | Focus on the UNIQUE symptom that points to ONE diagnosis |
- Toppers answer in 40 seconds per MCQ in scenarios. They READ the LAST LINE first (the question), then scan the stem for relevant data.
- If stuck between 2 options: the one with a MECHANISM explanation is usually correct in UHS papers.
MODULE 1: GIT & NUTRITION-II
(35 theory + 5 nutrition = 40 MCQs - Your biggest chunk)
TOPIC 1: ORAL CAVITY & SALIVARY GLAND TUMORS (Pathology)
Oral Lesions - Master Classification
ORAL LESIONS
├── INFECTIOUS
│   ├── Herpes simplex → multiple vesicles → ulcerate → painful
│   ├── Candidiasis → white plaques, scrape off → leave red base
│   └── Aphthous ulcer → recurrent, painful, yellow base, red halo
│
├── PREMALIGNANT (MEMORIZE - HIGH YIELD)
│   ├── Leukoplakia → white patch, CANNOT scrape off → 5% malignant
│   ├── Erythroplakia → RED patch → 50% already malignant (MORE DANGEROUS)
│   └── Oral Submucous Fibrosis → trismus, betel nut use
│
└── MALIGNANT
    └── Squamous Cell Carcinoma → 95% of oral cancers
        Risk: tobacco, alcohol, HPV-16, betel nut
- White lesions (leukoplakia) = watch out (5% risk)
- Red lesions (erythroplakia) = run to biopsy (50% risk)
Salivary Gland Tumors - High Yield Table
| Tumor | Type | Key Histology | Behavior |
|---|---|---|---|
| Pleomorphic Adenoma | Benign (80%) | Epithelial + myoepithelial + cartilage = MIXED | Parotid (85%), recurs if not excised completely |
| Warthin Tumor | Benign | Oncocytes + lymphoid stroma - "adenolymphoma" | Bilateral in 10%, smokers |
| Mucoepidermoid Ca | Malignant (Most Common) | Mucous + epidermoid + intermediate cells | Grade dependent prognosis |
| Adenoid Cystic Ca | Malignant | Swiss-cheese pattern, PERINEURAL INVASION | Slow but relentless, distant mets |
- P = Parotid (most common site)
- L = Largest benign salivary tumor
- E = Epithelial component
- A = Abundant stroma (chondroid, myxoid)
- S = Soft, mobile, painless
- E = Enucleation alone = recurrence → need proper excision
TOPIC 2: PEPTIC ULCER DISEASE (Pathology + Medicine + Surgery + Pharmacology)
Pathophysiology Flowchart
H. pylori (70% DU, 50% GU) + NSAIDs (most common drug cause)
        ↓
↑ Acid secretion + ↓ Mucosal defense
        ↓
Disruption of gastric mucosal barrier
        ↓
PEPTIC ULCER
├── Duodenal Ulcer (DU) - More common, 1st part duodenum
│   • Hunger/night pain → RELIEVED by food
│   • H. pylori in 95%
│   • NEVER malignant
│
└── Gastric Ulcer (GU) - Lesser curvature
    • Pain AFTER food
    • H. pylori in 70%
    • CAN be malignant → ALWAYS biopsy GU
- DU = pain Defers (goes away) with food
- GU = pain Gains (worsens) with food
H. pylori Diagnosis - The Complete Table
| Test | Type | Sensitivity | Key Point |
|---|---|---|---|
| Urea Breath Test | Non-invasive | 95% | Best non-invasive, used for CONFIRM eradication |
| Stool Antigen Test | Non-invasive | 95% | Cheapest, also for follow-up |
| CLO Test (Urease) | Invasive (biopsy) | 95% | Rapid bedside test at endoscopy |
| Histology | Invasive | Gold standard | Most accurate |
| Serology (IgG) | Non-invasive | Cannot confirm active vs past | LEAST useful for eradication check |
H. pylori Eradication Therapy
TRIPLE THERAPY (first line, 14 days):
PPI (omeprazole 20mg BD)
+ Clarithromycin 500mg BD
+ Amoxicillin 1g BD (or Metronidazole if penicillin allergy)
Complications of PUD
COMPLICATIONS → Mnemonic: "POSH"
P = Perforation (sudden severe epigastric pain → peritonitis)
    → X-ray: FREE AIR UNDER DIAPHRAGM (erect CXR)
    → Treatment: Emergency surgery (Graham patch)
O = Obstruction (pyloric stenosis → projectile vomiting, succussion splash)
    → Metabolic: Hypochloremic Hypokalemic Metabolic ALKALOSIS
S = (Stenosis/bleeding) - see bleeding
H = Hemorrhage (hematemesis/melena)
    → UGIE → Adrenaline injection + endoscopic coagulation
    → Rockall score → guides risk
TOPIC 3: INFLAMMATORY BOWEL DISEASE (IBD)
Crohn's vs Ulcerative Colitis - The Ultimate Comparison
CROHN'S DISEASE (CD)          vs         ULCERATIVE COLITIS (UC)
─────────────────────────────────────────────────────────────────
Any part GIT (mouth to anus)              Colon ONLY (starts rectum)
SKIP lesions                              CONTINUOUS, no skip
TRANSMURAL inflammation                   MUCOSAL only
String sign on barium (stricture)         Lead pipe colon (loss haustration)
Rose thorn ulcers                         Pseudopolyps
Cobblestone mucosa                        Backwash ileitis
Fistulas, fissures                        NO fistulas
NON-CASEATING granulomas                  Crypt abscesses (HALLMARK)
Right iliac fossa pain                    Left iliac fossa pain + bloody diarrhea
FATTY stool (malabsorption)               BLOODY mucoid diarrhea
- CD = Skip lesions (discontinuous) + Depth (transmural)
- UC = Continuous + Colon only + Crypts (abscesses)
Extra-Intestinal Manifestations (Both IBD)
- A = Ankylosing spondylitis
- S = Sclerosing cholangitis (Primary - PSC associated with UC)
- J = Joint arthritis
- O = Ocular (uveitis, episcleritis)
- I = Iron deficiency anemia
- N = Not normal growth (in kids)
- P = Pyoderma gangrenosum
- L = Liver disease
- E = Erythema nodosum
- A = Aphthous ulcers
- S = Stones (gallstones in CD, kidney stones in CD)
- E = Episcleritis
TOPIC 4: LIVER - HEPATITIS & CIRRHOSIS
Hepatitis Serology - The Most Tested Topic in All Exams
HEPATITIS B SEROLOGY - THE MUST-KNOW TABLE:

HBsAg = Surface Antigen = ACTIVE INFECTION (acute or chronic)
HBsAb = Surface Antibody = IMMUNITY (after vaccination OR recovery)
HBcAb IgM = Core Antibody IgM = ACUTE infection
HBcAb IgG = Core Antibody IgG = PAST infection or chronic
HBeAg = e Antigen = HIGH INFECTIVITY, active viral replication
HBeAb = e Antibody = LOW infectivity, seroconversion = GOOD sign
HBV DNA = Most sensitive marker of active replication

THE WINDOW PERIOD:
HBsAg gone → HBsAb not yet appeared
ONLY HBcAb IgM positive = Window period diagnosis
| Scenario | HBsAg | HBsAb | HBcAb | HBeAg |
|---|---|---|---|---|
| Acute HBV | + | - | IgM+ | + |
| Recovered | - | + | IgG+ | - |
| Vaccinated | - | + | - | - |
| Chronic HBV | + | - | IgG+ | +/- |
| Window period | - | - | IgM+ | - |
Cirrhosis - Pathology & Complications
CIRRHOSIS COMPLICATIONS - Mnemonic: "PAVE HH"
P = Portal hypertension
A = Ascites (treat: low-Na diet, spironolactone, paracentesis)
V = Varices (esophageal → treat with propranolol prophylactically)
E = Encephalopathy (treat: lactulose + rifaximin)
H = Hepatorenal syndrome (worst prognosis)
H = Hepatocellular Carcinoma (HCC) - screen with AFP + USG every 6 months
- A = Albumin (<2.8 = 3 pts)
- B = Bilirubin (>3 = 3 pts)
- C = Coagulation (PT >6 sec prolonged = 3 pts)
- D = disorientation (Encephalopathy grade 3-4 = 3 pts)
- E = Edema/Ascites (tense = 3 pts)
- Score 5-6 = A (compensated), 7-9 = B, 10-15 = C (decompensated)
TOPIC 5: GASTROINTESTINAL MALIGNANCIES
Colorectal Cancer - High Yield
RISK FACTORS: "FODMAP" → not the diet, our mnemonic:
F = Familial (FAP - 100s of polyps, APC gene, prophylactic colectomy)
    Lynch syndrome (HNPCC - MSI, MLH1/MSH2 genes)
O = Obesity + Old age
D = Diet (high red meat, low fiber)
M = More than 10 years of UC (IBD = risk)
A = Alcohol + smoking
P = Polyps (villous > tubular for malignant potential)
- A = Mucosa only → 90% 5yr survival
- B = Through muscle wall → 70%
- C = Lymph node involvement → 30%
- D = Distant metastasis → <5%
H. pylori → Gastritis → Atrophy → Intestinal metaplasia → Dysplasia → Adenocarcinoma
(Correa cascade - memorize this sequence)

Types:
• Intestinal type: Better prognosis, H. pylori, glands
• Diffuse type: Signet ring cells, hereditary (E-cadherin CDH1 mutation), linitis plastica
TOPIC 6: GIT PHARMACOLOGY - KEY DRUGS
ACID SUPPRESSION HIERARCHY:
Antacids (fastest, shortest) → H2 blockers → PPIs (strongest, longest)

PPI CLASS:
• All end in "-prazole": Omeprazole, Pantoprazole, Lansoprazole
• Mechanism: Irreversible block of H+/K+ ATPase (proton pump)
• PEAK effect requires 3-5 days (enzyme needs to be resynthesized)
• Take 30-60 minutes BEFORE meal (pump active when eating)
• Pantoprazole = safest in patients on anticoagulants (fewest CYP450 interactions)

H2 BLOCKERS:
• All end in "-tidine": Ranitidine (now withdrawn), Famotidine, Cimetidine
• Cimetidine = most side effects: gynecomastia, impotence, inhibits CYP450

PROKINETICS:
• Metoclopramide: D2 antagonist → increases gastric emptying, anti-emetic
  Side effect: Extrapyramidal effects (dystonia)
• Domperidone: D2 antagonist, does NOT cross BBB → fewer CNS effects

ANTI-DIARRHEALS:
• Loperamide: Opioid agonist on gut (does not cross BBB) → reduces motility
MODULE 2: COMMUNITY MEDICINE & FAMILY HEALTH-II
(25 theory + 15 practical = 40 MCQs)
TOPIC 1: EPIDEMIOLOGY MEASURES - The Calculation Section
DISEASE FREQUENCY MEASURES:

Incidence Rate = New cases / Population at risk × 1000 (or 100,000)
                 (measures RISK)

Prevalence = All existing cases / Total population × 1000
             (snapshot in time)
             Prevalence ≈ Incidence × Duration of disease

Attack Rate = New cases in specific exposure / Total exposed × 100
              (used in OUTBREAKS)

Case Fatality Rate (CFR) = Deaths / Confirmed cases × 100
Mortality Rate = Deaths / Total population × 1000

RELATIONSHIP:
• High incidence + long duration = HIGH prevalence (e.g., TB, HIV)
• High incidence + short duration (cure or death) = LOW prevalence (e.g., cholera)
TOPIC 2: SCREENING & PREVENTION
LEVELS OF PREVENTION:

Primary = Before disease (vaccination, health education)
Secondary = Early detection (screening) → treat early
Tertiary = Reduce disability in established disease (rehabilitation)

SCREENING CRITERIA (Wilson & Jungner - 10 criteria):
Key ones for MCQs:
1. Important health problem
2. Detectable early stage
3. Acceptable treatment available
4. Test: sensitive, specific, acceptable, cheap
5. Cost-effective

SENSITIVITY vs SPECIFICITY:
Sensitivity = TP/(TP+FN) → "Snout" → SeN rules OUT (high sensitivity + neg = rules out)
Specificity = TN/(TN+FP) → "Spin" → SPecificity + IN = rules IN
PPV = TP/(TP+FP) → depends on prevalence
NPV = TN/(TN+FN) → depends on prevalence
- SN = Sensitive test + Negative result = rules OUT disease
- SP = Specific test + Positive result = rules IN disease
TOPIC 3: NATIONAL HEALTH PROGRAMS (Pakistan-specific - HIGH YIELD)
EPI - Expanded Programme on Immunization
PAKISTAN EPI SCHEDULE (memorize this table):

AGE          VACCINE
Birth        BCG + Polio (OPV-0) + Hep B-1
6 weeks      Penta-1 (DPT+HBV+Hib) + OPV-1 + IPV-1 + Rotavirus-1 + PCV-1
10 weeks     Penta-2 + OPV-2 + Rotavirus-2 + PCV-2
14 weeks     Penta-3 + OPV-3 + IPV-2 + Rotavirus-3 + PCV-3
9 months     Measles-1 + VitA
15 months    MMR + Varicella
18 months    DPT booster + OPV booster
- BCG protects against meningitis and miliary TB in children (not pulmonary TB in adults)
- OPV is LIVE, cannot give to immunocompromised → use IPV
- PCV = Pneumococcal Conjugate Vaccine → prevents meningitis + pneumonia
- Penta = DPT + HBV + Hib (5 in 1)
Cold Chain (Very High Yield in Community MCQs)
COLD CHAIN TEMPERATURES:
Vaccine Storage:    +2°C to +8°C (refrigerator)
Freezing (ice pack): -15°C to -25°C (freeze)
VVM (Vaccine Vial Monitor): Color change = DO NOT USE
TOPIC 4: FAMILY HEALTH
Maternal Mortality & Safe Motherhood
DIRECT CAUSES of Maternal Mortality - Mnemonic: "HEAP"
H = Hemorrhage (PPH = #1 cause globally)
E = Eclampsia/Hypertension
A = Abortion (unsafe)
P = Puerperal sepsis

In Pakistan: Hemorrhage remains #1

INDIRECT CAUSES: Anemia, malaria, heart disease

3 DELAYS MODEL:
1st delay = Recognizing danger signs (decision to seek care)
2nd delay = Reaching facility (transport, distance)
3rd delay = Receiving care (quality of care at facility)
Family Planning (High Yield in MCQs)
| Method | Mechanism | Key MCQ point |
|---|---|---|
| COC (Combined OCP) | Inhibit ovulation + cervical mucus | Failure rate 0.3% (perfect use) - MOST EFFECTIVE oral |
| POP (Progestogen only) | Cervical mucus mainly | Safe in lactation, breastfeeding women |
| IUCD (Copper T) | Spermicidal + inhibits implantation | Most effective LARC, 10 years, 99.4% effective |
| Condom | Barrier | ONLY method that protects against STIs |
| Emergency OCP | Levonorgestrel 1.5mg | Within 72 hours (effective), can use up to 120h |
- A = Abdominal pain (clotting)
- C = Chest pain (PE, IHD)
- H = Headache severe (stroke)
- E = Eye problems (visual changes = stroke warning)
- S = Severe leg pain (DVT)
TOPIC 5: NUTRITION (5 marks - don't overlook)
PROTEIN ENERGY MALNUTRITION:

KWASHIORKOR (protein deficiency):
• Edema (pitting) + Normal/high weight
• Skin changes: "flaky paint" dermatosis
• Hair changes: depigmented, easily pluckable (flag sign)
• Fatty liver (due to ↓ apolipoproteins)
• Moon face

MARASMUS (calorie deficiency overall):
• Wasting, NO edema
• Monkey face (loss of buccal fat pad)
• Wizened old man appearance

MARASMIC KWASHIORKOR = Both → WORST prognosis

MCQ TRICK: Edema = Kwashiorkor (even if thin)
Vitamin Deficiencies - Quick Hit Table
| Vitamin | Deficiency Disease | Key Clinical Sign | Test |
|---|---|---|---|
| A | Night blindness → Xerophthalmia → Bitot's spots | Bitot's spots (foamy white on conjunctiva) | Serum retinol |
| B1 (Thiamine) | Beriberi (wet=heart failure, dry=neuropathy) / Wernicke's | Wet: cardiomegaly; Wernicke: confusion, ophthalmoplegia, ataxia | |
| B12 | Megaloblastic anemia + subacute combined degeneration | Loss of vibration + position sense | Schilling test |
| C | Scurvy | Perifollicular hemorrhages, corkscrew hair, bleeding gums | |
| D | Rickets (kids) / Osteomalacia (adults) | Rachitic rosary, bow legs | 25-OH Vit D |
| K | Bleeding disorder | Prolonged PT (not PTT) | PT |
- Dorsal column (vibration/proprioception) + lateral corticospinal tract
MODULE 3: EYE-I (Ophthalmology)
(30 MCQs - 3 OSCEs + 1 short case)
TOPIC 1: CATARACT
DEFINITION: Opacity/clouding of the crystalline lens

CLASSIFICATION:
Nuclear → Central, yellow-brown, near vision initially better
Cortical → Spoke-wheel pattern, glare
Posterior Subcapsular (PSC) → Most vision-disabling (bright light/reading worst)
                              Associated with: STEROIDS, diabetes, radiation

CAUSES (Mnemonic: "DISTANCE"):
D = Diabetes mellitus
I = Inflammation (uveitis)
S = Steroids (PSC type)
T = Trauma (contusion, penetrating)
A = Age (most common overall)
N = Nuclear radiation, Nutritional
C = Congenital (TORCH infections, galactosemia, Down syndrome)
E = Electric shock, Extreme age
Cataract Surgery - Key Points
| Procedure | Description | Key MCQ point |
|---|---|---|
| ECCE | Extra-capsular cataract extraction | Leaves posterior capsule intact |
| Phacoemulsification | Ultrasound breaks lens → aspiration | Small incision, fast recovery, STANDARD |
| ICCE | Whole lens removed | Outdated, used if no zonules |
| IOL | Intraocular lens implant | Placed in posterior chamber |
TOPIC 2: GLAUCOMA
GLAUCOMA = Optic nerve damage + Visual field defect
           (usually due to raised IOP, but NOT always)

TYPES - THE CRITICAL DISTINCTION:

OPEN ANGLE GLAUCOMA (OAG) - Chronic, silent killer of vision
• IOP ↑ (normal 10-21 mmHg)
• Trabecular meshwork blocked → aqueous drainage ↓
• Insidious, painless
• Fields: Arcuate scotoma → nasal step → tunnel vision → blindness
• Treatment: Prostaglandin analogs (FIRST LINE - once daily, best IOP reduction)
            Beta blockers (Timolol - twice daily, CI: asthma)
            Carbonic anhydrase inhibitors (Dorzolamide)
            Alpha-2 agonists (Brimonidine)

ACUTE ANGLE CLOSURE GLAUCOMA (AACG) - EMERGENCY
• Sudden severe eye pain, headache, nausea, vomiting
• Red eye, cloudy cornea, fixed mid-dilated pupil
• IOP very high (>50 mmHg)
• Precipitated by: Mydriatics, dim light, emotional stress
• Emergency treatment: IV Acetazolamide + Pilocarpine drops
  (Pilocarpine = miotic → opens angle)
• Definitive: Laser peripheral iridotomy (LPI)
- Acute onset
- Angle closure
- Call urgently
- Get IV acetazolamide
- Help = Pilocarpine (constricts pupil, opens angle)
Optic Disc Changes in Glaucoma
NORMAL cup:disc ratio = <0.5
GLAUCOMA = CDR >0.6, asymmetric cupping
• Vertical elongation of cup
• Nasal shift of vessels
• Bayoneting sign
• Baring of circumlinear vessels
TOPIC 3: DIABETIC RETINOPATHY
STAGES:
NPDR (Non-Proliferative) → PDR (Proliferative)

NPDR:
• Microaneurysms (EARLIEST sign - dot hemorrhages)
• Blot hemorrhages
• Hard exudates (lipid deposits)
• Soft exudates/Cotton wool spots (nerve fiber ischemia)

PDR:
• Neovascularization (NVD = new vessels on disc, NVE = elsewhere)
• Vitreous hemorrhage
• Traction retinal detachment (TRD)
• Rubeosis iridis → Neovascular glaucoma

TREATMENT:
NPDR mild-moderate: Strict glycemic control
NPDR severe + PDR: Pan-retinal photocoagulation (PRP)
Macular edema: Anti-VEGF (Bevacizumab, Ranibizumab) + focal laser
- MA = Microaneurysms
- HH = Hemorrhages (dot, blot)
- SE = Soft Exudates (cotton wool)
- CW = Cotton wool → progression to PDR
TOPIC 4: RETINAL DETACHMENT
TYPES:
Rhegmatogenous: Tear/break in retina → fluid enters → MOST COMMON
Tractional: Fibrous bands pull retina (diabetic PDR, sickle cell)
Exudative: Fluid accumulates WITHOUT tear (tumor, inflammation)

SYMPTOMS: Curtain/shadow from periphery, floaters, flashes of light
          "Cobwebs and lightning bolts"

TREATMENT:
• Pneumatic retinopexy (gas bubble)
• Scleral buckle
• Vitrectomy (for complex cases)
TOPIC 5: CONJUNCTIVITIS
TYPES AND DISTINGUISHING FEATURES:

                BACTERIAL        VIRAL           ALLERGIC
Discharge       Purulent         Watery          Watery/stringy mucus
Preauricular    -                +               -
lymph node
Itching         -                -               +++ (KEY feature)
Bilateral       Often            Often           Both
Treatment       Topical Abx      Self-limiting   Antihistamine drops

NEONATAL CONJUNCTIVITIS (Ophthalmia Neonatorum):
0-3 days: Chemical (silver nitrate) → now rare
3-5 days: N. gonorrhoeae → COPIOUS purulent → treat systemic ceftriaxone
5-14 days: Chlamydia trachomatis → most common cause today
           → Systemic erythromycin (prophylactic azithromycin)

MCQ TRAP: Gonorrheal conjunctivitis in newborn is MEDICAL EMERGENCY
          → Corneal perforation within hours → IMMEDIATE systemic treatment
TOPIC 6: UVEITIS
TYPES:
Anterior uveitis (Iritis): Most common, acute red eye, PERILIMBAL flush
   Symptoms: Pain, photophobia, blurred vision
   Signs: Ciliary flush, keratic precipitates (KPs), hypopyon

Posterior uveitis (Choroiditis): Floaters, visual loss, NO pain
   Causes: Toxoplasma (#1 worldwide), TB, CMV (in AIDS), Sarcoidosis

HYPOPYON = pus in anterior chamber = SERIOUS = emergency

COMMON CAUSES:
Ankylosing spondylitis → Anterior uveitis (HLA-B27 associated)
Sarcoidosis → Can cause any type
Behcet's disease → Hypopyon uveitis + oral + genital ulcers
MODULE 4: ENT-I (Ear, Nose & Throat)
(30 MCQs - 3 OSCEs + 1 short case)
TOPIC 1: EAR
Otitis Media - Critical Distinction
ACUTE OTITIS MEDIA (AOM):
• Causative organisms: S. pneumoniae (#1 most common), H. influenzae, M. catarrhalis
• Children > adults (Eustachian tube more horizontal)
• Ear pain (otalgia), fever, conductive hearing loss
• TM: Red, bulging, loss of light reflex
• Treatment: Amoxicillin first line (10 days in children <2 yr, 5-7 days in older)

OTITIS MEDIA WITH EFFUSION (OME) = Glue Ear:
• Most common cause of hearing loss in children
• Secretory (no acute infection)
• Management: Wait and see 3 months → if persists: grommets (tympanostomy tubes)

CHRONIC SUPPURATIVE OTITIS MEDIA (CSOM):
SAFE type (Tubotympanic): Central perforation, no cholesteatoma, mucopurulent discharge
UNSAFE type (Atticoantral): Marginal perforation, CHOLESTEATOMA → DANGEROUS
Cholesteatoma - High Yield
CHOLESTEATOMA = Keratinizing squamous epithelium in middle ear
               (NOT a tumor, but behaves destructively)

Mechanism: Retraction pocket → skin grows into middle ear → accumulates keratin
           → BONE EROSION (ossicles, tegmen, lateral canal, facial nerve)

COMPLICATIONS (Mnemonic: "FLAT BED"):
F = Facial nerve palsy
L = Labyrinthitis (sensorineural hearing loss)
A = Abscess (extradural/intracranial)
T = Thrombosis (lateral sinus)
B = Brain abscess
E = Encephalitis
D = Deafness (sensorineural)

Treatment: SURGERY (mastoidectomy) → no medical treatment
TOPIC 2: HEARING LOSS
CONDUCTIVE vs SENSORINEURAL HEARING LOSS:

RINNE TEST:
Normal: AC > BC (positive test)
Conductive HL: BC > AC (Rinne NEGATIVE = abnormal)
Sensorineural HL: AC > BC but both reduced (still positive, just quieter)

WEBER TEST:
Normal: Central
Conductive HL: Lateralizes to AFFECTED (diseased) ear
Sensorineural HL: Lateralizes to NORMAL (better) ear

MCQ TRICK: Weber to the WORSE ear = CONDUCTIVE loss
           Weber to the BETTER ear = SENSORINEURAL loss
Otosclerosis
Otosclerosis: Abnormal bone remodeling → stapes footplate fixation
• Young adults (especially women), bilateral, conductive HL
• Paracusis Willisii: Hears better in NOISE (unique)
• Schwartze sign: Flamingo pink blush seen through TM (active otosclerosis)
• Audiogram: Carhart's notch at 2kHz
• Treatment: Stapedectomy / Hearing aid
TOPIC 3: NOSE & SINUSES
Epistaxis (Nosebleed)
SITES:
Anterior: Little's area / Kiesselbach's plexus (anterior nasal septum)
          → Most common (90%), easily treated, visible
Posterior: Woodruff's plexus (posterior nasal septum)
           → Serious, elderly, hypertensives, arterial

CAUSES (Mnemonic: "THRILL"):
T = Trauma (most common)
H = Hypertension (severe)
R = Rhinitis, Rhinosinusitis
I = Infections
L = Local causes (deviated septum, polyps)
L = Local causes

TREATMENT:
• Pinch soft part of nose 10-15 minutes (head FORWARD, not back)
• Anterior: Silver nitrate cautery or anterior pack
• Posterior: Posterior pack / Foley catheter balloon
• Definitive: Arterial ligation or embolization
TOPIC 4: TONSILS & THROAT
Tonsillitis
ACUTE TONSILLITIS:
Viral (most common overall): Adenovirus, EBV
Bacterial: Group A Strep (GAS) - Streptococcus pyogenes
           → Most important to treat (prevent Rheumatic fever)

CENTOR CRITERIA (diagnose Strep throat):
1. Tonsillar exudate
2. Tender anterior cervical lymph nodes
3. History of fever
4. ABSENCE of cough
Score ≥3: Treat with antibiotics (Amoxicillin, Penicillin V)
Score <3: Viral, no antibiotics

COMPLICATIONS:
Local: Peritonsillar abscess (quinsy) - COMMONEST complication
       → Unilateral swelling + uvula deviation AWAY from abscess
       → Treatment: Incision and drainage + IV antibiotics
Remote: Rheumatic fever, glomerulonephritis
Tonsillectomy Indications
- 7 episodes/year, OR 5 episodes/year for 2 years, OR 3 episodes/year for 3 years
- Complicated by peritonsillar abscess
- Obstructive sleep apnea
- Febrile convulsions related to tonsillitis
TOPIC 5: ORAL CAVITY (ENT Component)
ENT-Throat LOS from Block 10
CYSTIC LESIONS OF ORAL CAVITY (LOS: ENT-Throat-001):
Mucocele: Minor salivary gland duct obstruction → bluish translucent swelling
          Most common site: Lower lip
          Treatment: Surgical excision

Ranula: Retention cyst of sublingual gland → floor of mouth
        "Plunging ranula" extends below mylohyoid → neck swelling
        Treatment: Marsuplialization or excision

Dermoid cyst: Midline, congenital, submental

SALIVARY GLAND DISORDERS:
Sialadenitis: Parotid > submandibular, bacterial
Sialolithiasis: Submandibular > parotid (Wharton's duct, more tortuous and uphill)
               → Pain on eating (salivation increases)
               → Bimanual palpation → stone felt
               → Management: Hydration, massage, duct dilation, lithotripsy, excision
TOPIC 6: LARYNX
HOARSENESS DIFFERENTIAL:
• Laryngitis (infection) → voice rest + humidification
• Vocal cord nodules ("singer's nodes") → voice abuse, bilateral, anterior 1/3
• Vocal cord polyp → unilateral, hemorrhagic
• Laryngeal carcinoma → smoker + alcohol, elderly male, progressive hoarseness
  → MUST LARYNGOSCOPE any hoarseness >3 weeks in adults
  → Supraglottic: Late presentation (dysphagia), better prognosis after treatment
  → Glottic (true cords): BEST prognosis (early hoarseness)
  → Subglottic: Worst prognosis

MCQ TRAP: Glottic carcinoma = BEST prognosis because hoarseness = early symptom
          = patients present early
PATHOLOGY THEMES ACROSS ALL MODULES (High Yield Histology Images)
Hepatitis B Liver Histology:
Gastric Ulcer Pathology (Endoscopy + Histology):
PHARMACOLOGY QUICK HITS FOR BLOCK 10
GI DRUGS SUMMARY TABLE:
Drug class          Drug             Mechanism              Side effect
PPIs               Omeprazole        H+/K+ ATPase inhibit   C. diff ↑ risk, hypoMg
H2 blockers        Cimetidine        H2 receptor block       Gynecomastia, CYP450 inhib
Prokinetics        Metoclopramide    D2 antagonist           Extrapyramidal (dystonia)
Antidiarrheal      Loperamide        Opioid agonist (gut)    Constipation
Laxative           Lactulose         Osmotic                 Flatulence
Anti-IBD           Mesalazine (5-ASA) COX inhibition        Nephrotoxic
Biologic           Infliximab        Anti-TNF               TB reactivation (screen first!)
Antiemetic         Ondansetron       5-HT3 blocker           QT prolongation

OPHTHALMIC DRUGS:
Drug              Class              Use                Key fact
Timolol           Beta-blocker       Glaucoma           CI in asthma, COPD
Pilocarpine       Miotic (M agonist) AACG               Constricts pupil
Latanoprost       Prostaglandin      OAG (1st line)     Once daily, best IOP reduction
Atropine          Mydriatic          Cycloplegia        CI in narrow angle glaucoma
Acetazolamide     CAI                AACG (systemic)    Sulfa drug, hypokalemia
INTEGRATED MCQ SCENARIO GUIDE
Pattern 1: "Patient with abdominal pain + investigations"
Pattern 2: "Child with ear problems"
Pattern 3: "Community medicine calculation"
Pattern 4: "Eye emergency"
YOUR 18-HOUR BATTLE PLAN (Exam is Monday morning)
TIME ALLOCATION (Be ruthless):
06:30 - 09:00  GIT & Nutrition-II (Pathology: PUD + IBD + Malignancies)
09:00 - 11:00  GIT Pharmacology + Liver (Hepatitis serology + Cirrhosis)
11:00 - 12:00  Community Medicine (Epidemiology + EPI schedule + FP)
12:00 - 13:00  BREAK + Revision Pass 1 (go over mnemonics)
13:00 - 15:00  Ophthalmology (Cataract + Glaucoma + DR + Retinal detachment)
15:00 - 17:00  ENT (Ear: AOM + CSOM + Cholesteatoma; Nose: Epistaxis; Throat: Tonsils)
17:00 - 18:00  Nutrition (PEM + Vitamins) + Oral cavity (Salivary tumors)
18:00 - 19:00  Full BREAK (eat, pray)
19:00 - 21:00  DO 50 past MCQ-style practice scenarios on weak areas
21:00 - 22:00  Final revision - ALL mnemonics and tables only
22:00          SLEEP. No burning midnight oil. Sleep = memory consolidation.
FINAL EXAM-DAY TIPS
- Read MCQ stems from the LAST LINE first - identify what they're asking, then read the scenario.
- Circle keywords: "EXCEPT", "NOT", "MOST COMMON", "FIRST LINE", "EMERGENCY" - these change the answer.
- In paired diseases (CD vs UC, OAG vs AACG): One symptom/sign/investigation will be the differentiator. Find it.
- In pharmacology MCQs: The drug with a UNIQUE side effect or unique CI is usually the answer.
- Never change your first answer unless you suddenly recall a hard fact that proves it wrong.
- In community medicine calculations: Write the formula first, THEN plug in numbers. Never shortcut.
- For eye/ENT scenarios: Age + onset + pain/no pain will narrow it to 1-2 differentials.
Make individual subject notes in detail . Forget that I have test on Monday with same instructions I gave you before.
Crohn disease histology cobblestone mucosa granuloma skip lesions
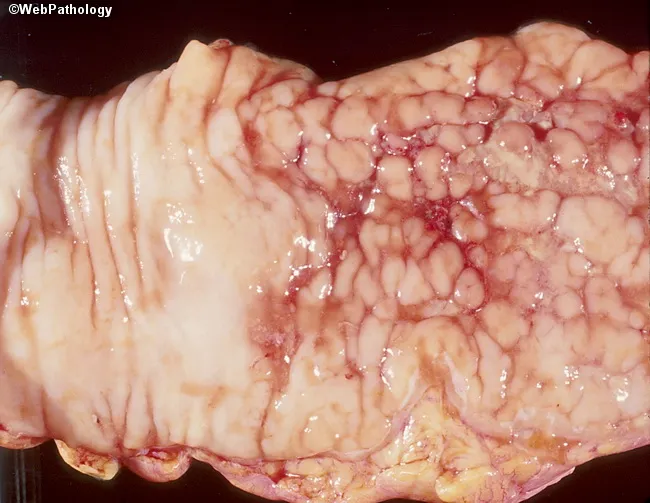
Macroscopic gross image of a resected bowel segment displaying marked mucosal disease. The right-hand mucosa shows a cobblestone pattern with discrete raised islands interspersed by shallow to deep ulcerations; a sharp demarcation separates involved from uninvolved mucosa on the left. These features arise from focal inflammatory changes producing mucosal edema, friability, and fissuring, yielding the characteristic cobblestone appearance. The mucosa appears erythematous with vascular congestion but without visible serosal perforation in this view. The pattern is suggestive of inflammatory bowel disease, most consistent with Crohn disease presenting as patchy skip-lesion involvement of the colon. The observed gross morphology supports clinical correlation and histopathologic confirmation to distinguish Crohn colitis from other causes of segmental ulceration, such as intestinal tuberculosis or ischemic colitis. Depth of ulceration cannot be determined from this surface image alone. This specimen provides essential gross-pathology context for surgical pathology, gastroenterology, and education, and would be indexed under inflammatory bowel disease, cobblestone mucosa, Crohn disease, skip lesions, mucosal ulceration, and colonic involvement. Keywords for search include colon, colonoscopy correlation, macroscopic bowel pathology, Crohn disease pattern, transmural inflammation suspicion, and gross mucosal pattern. Additional histology will optimize differential diagnosis and guide therapy in clinical practice.
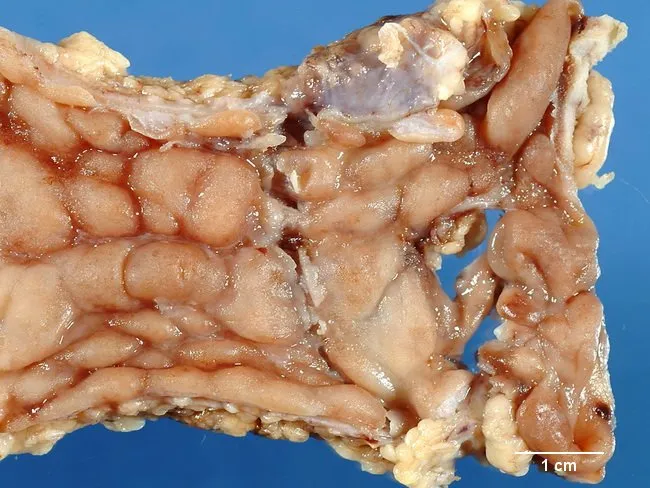
Gross pathology photograph of a Crohn disease-affected colonic segment illustrating classic transmural inflammation with segmental involvement. The specimen reveals discontinuous disease with skip areas and sharp demarcation between inflamed and untouched mucosa. Deep longitudinal ulcers are present, some oriented horizontally in the image, connected by shorter transverse ulcers, producing a serpentine configuration. The mucosa is edematous and may show hemorrhage or exudate; islands of bulging uninvolved mucosa create a cobblestone appearance. With time, chronic inflammation drives fibrosis and muscularis propria hypertrophy, resulting in wall thickening and luminal narrowing known as stricture. Serosal surfaces may show creeping fat, a fat wrapping phenomenon where mesenteric fat encroaches on the serosa. Transmural involvement predisposes to fissures, fistula formation, and, in advanced disease, regional scarring. The specimen likely represents Crohn colitis rather than ulcerative colitis, given the patchy distribution and transmural changes. The gross pattern correlates with potential surgical complications, including obstruction, fistulization, and abscess formation. This image is valuable for education on helical, segmental bowel pathology, highlighting the cobblestone mucosal pattern, serpiginous ulcers, skip lesions, and the characteristic transmural, full-thickness inflammatory process. Correlation with clinical history and radiologic findings reinforces diagnostic confidence and informs therapeutic planning, including medical therapy versus surgical resection strategy.
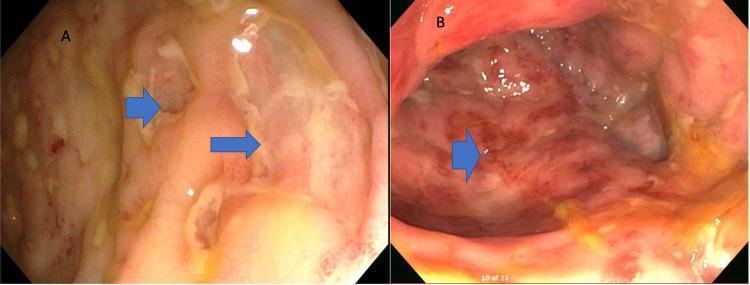
This composite diagnostic image features two endoscopic panels demonstrating manifestations of Crohn’s disease within the gastrointestinal tract. Panel A shows a colonoscopic view of the colonic mucosa, highlighting characteristic 'skip lesions.' Blue arrows indicate deep, linear ulcerative lesions interspersed with areas of relatively spared, normal-appearing mucosa, creating a discontinuous pattern of inflammation. Panel B presents an esophagogastroduodenoscopy (EGD) view of the gastric mucosa. This panel demonstrates significant erythema and a classic 'cobblestone' appearance, where longitudinal and transverse ulcerations separate islands of edematous, inflamed mucosa (noted by the blue arrow). These findings are hallmark endoscopic features of transmural inflammatory bowel disease (IBD), specifically Crohn's disease, showing multi-segmental involvement and mucosal architectural distortion. The image serves as an educational reference for identifying active Crohn's disease during lower and upper endoscopy.
diabetic retinopathy microaneurysms neovascularization fundus photograph
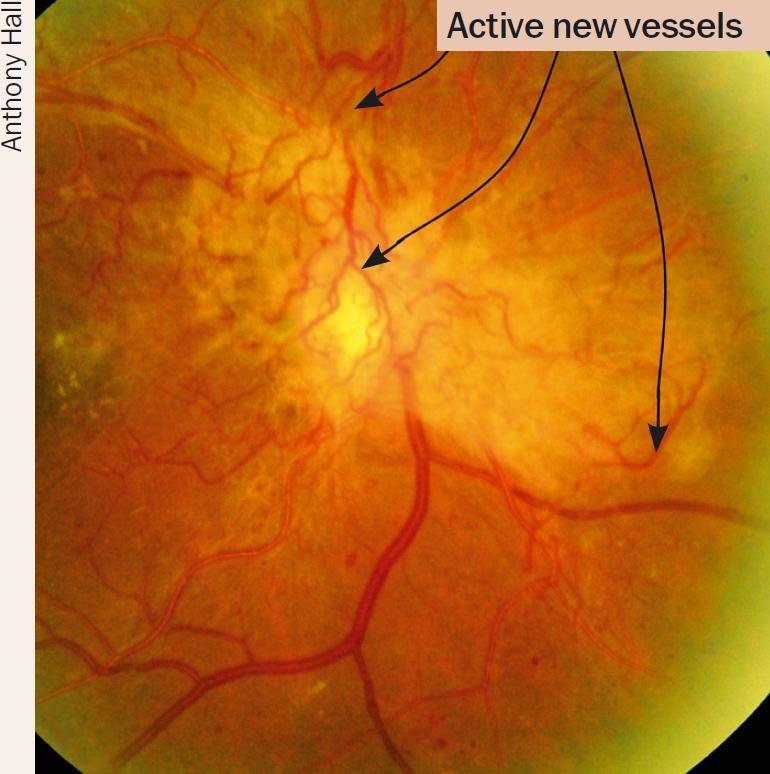
This clinical fundus photograph illustrates the hallmarks of Proliferative Diabetic Retinopathy (PDR). The primary findings are several areas of active neovascularization, specifically neovascularization of the disc (NVD) and neovascularization elsewhere (NVE), indicated by arrows pointing to fine, tufted, and tortuous capillary-like vessels. These new vessels are shown proliferating from the retina and extending onto the posterior vitreous surface. The retinal background exhibits additional signs of diabetic microvascular disease, including small, dark-red punctate lesions consistent with microaneurysms or small dot-and-blot hemorrhages. There are also subtle, lighter-colored yellowish patches suggestive of hard exudates. The overall retinal appearance is mottled, indicating underlying ischemia and chronic vascular damage. This image serves as a clinical example of advanced diabetic eye disease where pathological angiogenesis poses a high risk for vitreous hemorrhage and tractional retinal detachment.
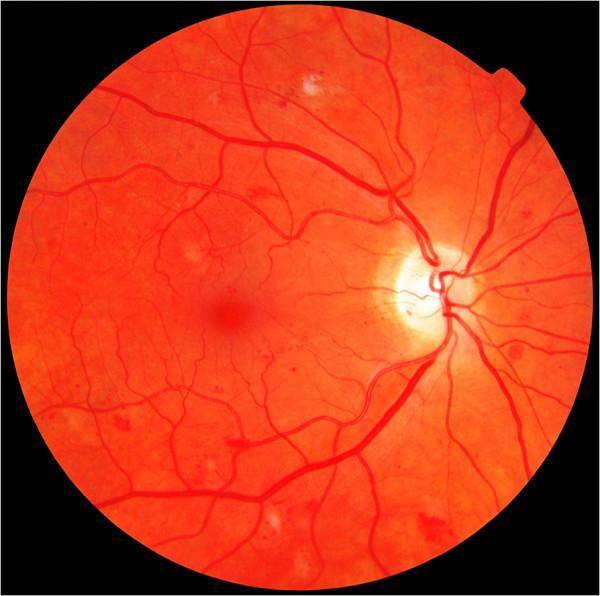
A color fundus photograph of the human retina demonstrating features of moderate non-proliferative diabetic retinopathy (NPDR). The image reveals an orange-red retinal background with several distinct pathological findings. Scattered punctate microaneurysms and small dot-and-blot hemorrhages are visible across the posterior pole. In the superior and peripheral regions, multiple cotton wool spots—characterized as fluffy, white, indistinct lesions—are present, indicating focal areas of retinal nerve fiber layer ischemia. The retinal vasculature exhibits mild to moderate tortuosity without evidence of neovascularization. The optic disc appears pale with well-defined margins and a normal cup-to-disc ratio. The macula appears relatively preserved without gross hard exudates or clinically significant macular edema in this view. This clinical photograph is a primary diagnostic tool for ophthalmologists and medical students to identify the progression of diabetic microvascular disease and differentiate between mild and moderate NPDR stages based on the quantity and variety of lesions such as hemorrhages and cotton wool spots.
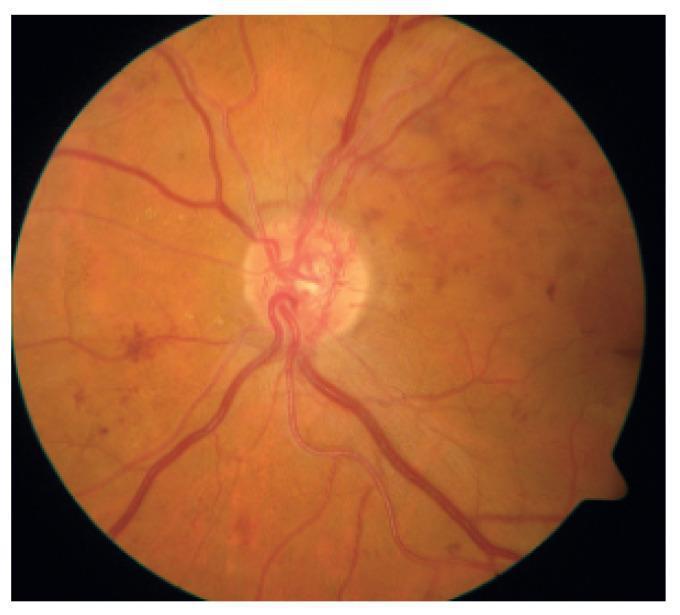
This color fundus photograph displays the posterior pole of a human eye with hallmarks of Proliferative Diabetic Retinopathy (PDR). The optic disc is centrally located and serves as the origin for the major retinal vascular arcades. A key diagnostic feature is the presence of neovascularization of the disc (NVD), characterized by a fine, tangled, and tortuous network of abnormal new blood vessels proliferating on and immediately adjacent to the optic nerve head. The surrounding retina shows multi-focal pathology, including scattered dot-and-blot intraretinal hemorrhages and smaller microaneurysms, particularly prominent in the temporal and nasal quadrants. Faint, yellowish deposits suggestive of hard exudates are visible in the peripapillary region. The vascular caliber appears irregular, and the overall fundus background exhibits a slightly hazy appearance, possibly due to vitreous changes or early preretinal hemorrhage. This image serves as a clinical example of advanced diabetic microvascular disease requiring urgent ophthalmic intervention.
colorectal cancer polyps adenoma ulcerative colitis crypt abscess histology
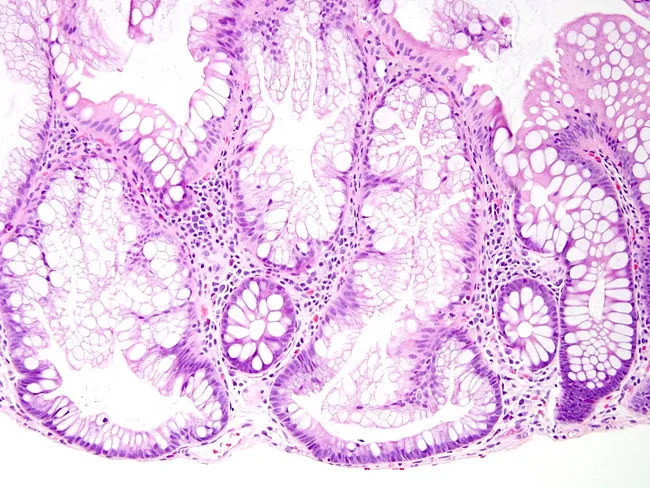
Histopathology image of Hematoxylin and Eosin (H&E) stained colorectal mucosa illustrating a sessile serrated adenoma (SSA) in the right colon. The tissue section shows non-pedunculated, broad-based crypts with characteristic serrated (sawtooth) architecture, especially apparent at the crypt bases where dilatation and lateral spreading occur. The crypts exhibit elongated profiles with intraluminal folds and crowding of basal goblet cells and absorptive columnar cells, each with a basally located nucleus and abundant mucinous cytoplasm. The proliferative zone extends into the middle to upper thirds of the crypts, distinguishing SSA from hyperplastic polyps in which proliferative activity is confined to the lower third. Mucosa demonstrates focal architectural distortion but lacks overt invasion in this field. The lesion is premalignant, linked to the serrated pathway of colorectal carcinogenesis, and contributes to roughly 15% of colorectal cancers; right-sided predominance and association with older female patients are characteristic clinical patterns. Clinically, this histology supports endoscopic identification and complete excision, with implications for surveillance intervals and cancer risk assessment. Differential considerations include hyperplastic polyp and traditional serrated adenoma; correlation with endoscopic appearance and molecular testing (e.g., BRAF mutation, CpG island methylator phenotype) may refine risk stratification. Pathology.
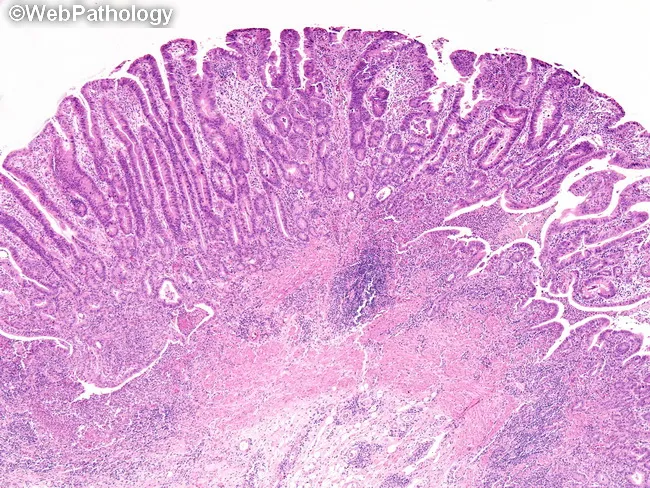
Histopathology image of colonic mucosa from a patient with long-standing ulcerative colitis undergoing surveillance. Prepared tissue is stained with hematoxylin and eosin and examined under light microscopy. The site demonstrates chronic inflammatory changes with mucosal architectural distortion and crypt architectural irregularities characteristic of inflammatory bowel disease, alongside a discrete neoplastic-appearing focus. The lesion exhibits tubular gland formation with elongated, hyperchromatic epithelial nuclei, nuclear stratification, and relative preservation of goblet cells in a dysplastic mucosa, consistent with a tubular adenoma-like focus in the setting of colitis. Adjacent mucosa shows a prominent crypt abscess at the right edge, with neutrophilic infiltrates within crypt lumens and significant inflammatory cell infiltration in the lamina propria. The background mucosa displays ongoing chronic inflammation, regenerative hyperplasia, and fusion of crypts. Clinically this finding is significant because IBD-associated dysplasia can evolve to colorectal carcinoma; distinguishing neoplastic from regenerative changes is essential, requiring careful correlation with endoscopic features and, when feasible, targeted biopsies. The four-quadrant random sampling and targeted biopsies during colonoscopic surveillance aim to detect dysplasia early. In UC with coexistent primary sclerosing cholangitis, cancer risk is higher and surveillance intervals are tightened. End result: dysplastic-appearing area within inflamed mucosa raises concern for DALM or IBD-associated neoplasia.
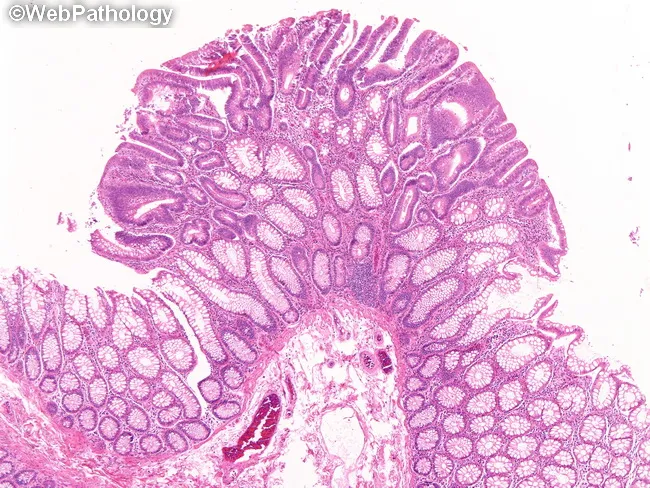
Imaging modality: Bright-field light microscopy of a hematoxylin and eosin (H&E) stained colonic polyp section. The tissue is a polyp from the colon in a patient with familial adenomatous polyposis (FAP). The histology shows colonic mucosa with a proliferation of elongated, crowding tubular glands forming a small, sessile polypoid lesion. Glandular architecture is predominantly tubular, with dysplastic epithelium demonstrating nuclear enlargement, hyperchromasia, and pseudostratification; goblet cells are variably reduced. The lamina propria shows mild stromal edema without invasion, and the crypt epithelium displays mitotic activity limited to the lower two thirds. The overall appearance is consistent with a tubular adenoma arising in the setting of FAP. The image highlights precancerous pathology, important for risk stratification and surveillance planning. Clinically, tubular adenomas in FAP carry a substantial lifetime risk of colorectal cancer and require intensified endoscopic monitoring and genetic counseling. The high-magnification view emphasizes microarchitectural features such as tightly packed, elongated glands and dysplastic cytology that differentiate adenomas from hyperplastic polyps. This micrograph is relevant for educational purposes, pathology teaching, and research into adenoma biology, APC-related tumorigenesis, and polyp progression to colorectal cancer. Correlative clinical management may include APC gene testing, familial counseling, and consideration of colectomy options; this histology aids grading dysplasia and guiding surveillance.
glaucoma optic disc cupping cup disc ratio fundus
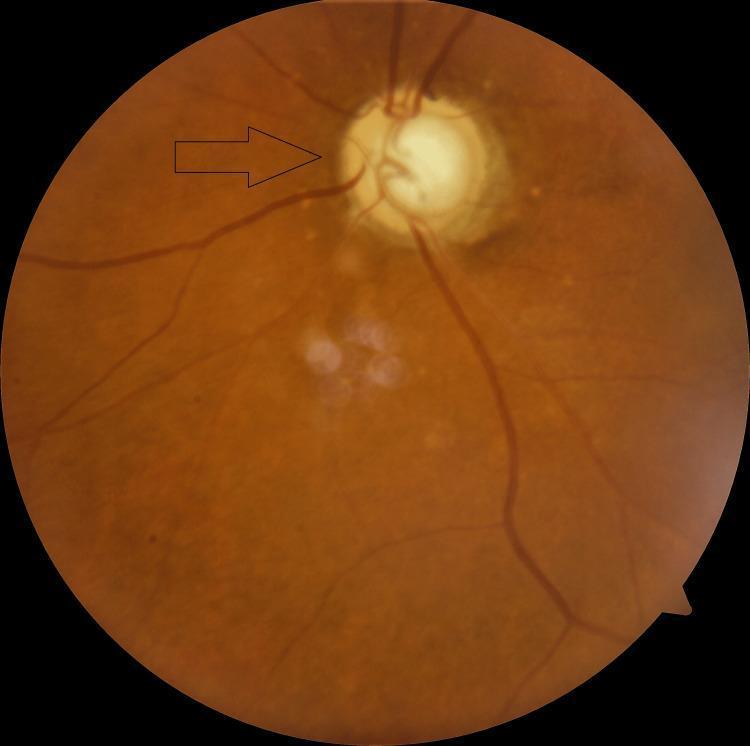
This clinical fundus photograph depicts the posterior pole of the left eye, highlighting significant structural changes to the optic nerve head (ONH). The optic disc exhibits advanced glaucomatous cupping, characterized by a nearly total cup-to-disc ratio (approximately 0.99). The neuroretinal rim is severely thinned and pale, with an arrow indicating the baring of a circumlinear vessel and nasalization of the retinal vasculature. The central cup is deep and markedly enlarged, consistent with end-stage glaucoma. Surrounding the optic disc, there is evidence of peripapillary atrophy. The background fundus shows a reddish-orange hue with several small, yellowish-white lesions localized inferior to the optic disc, which may represent drusen or focal retinal changes. Retinal vessels emerge from the disc with relatively normal caliber but show sharp angulation at the disc margin (bayoneting sign). This image serves as a classic educational example of severe glaucomatous optic neuropathy and its associated vascular and structural manifestations.
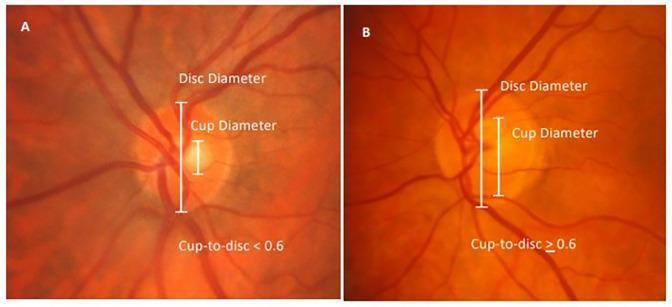
Side-by-side comparative fundus photographs showing the measurement of the optic cup-to-disc ratio (CDR), a critical metric in glaucoma screening and ophthalmic diagnostics. Panel A displays a healthy optic disc with a small central excavation, annotated with vertical bars indicating the 'Disc Diameter' and a significantly smaller 'Cup Diameter,' resulting in a CDR < 0.6. Panel B demonstrates an enlarged optic cup where the excavation occupies a greater vertical proportion of the disc, annotated with a CDR ≥ 0.6. This pathological enlargement, or 'cupping,' indicates neuroretinal rim thinning. In both images, retinal blood vessels are visible originating from the optic disc and branching across the fundus. The comparison highlights morphological changes in the optic nerve head, specifically the expansion of the cup relative to the disc margin. This material is designed for medical educational purposes to teach the quantitative assessment of vertical CDR and the identification of clinical markers for glaucomatous optic neuropathy.
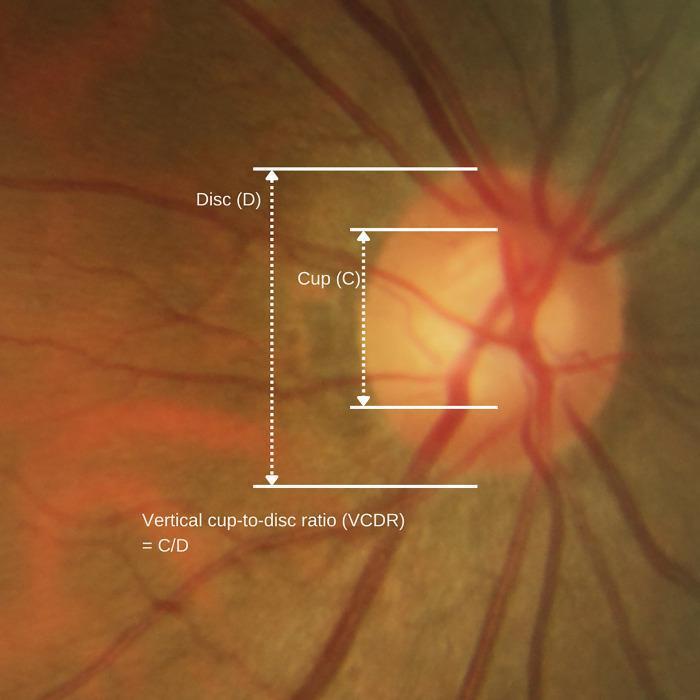
This clinical fundus photograph illustrates the anatomy of the optic nerve head (ONH) and the method for calculating the vertical cup-to-disc ratio (VCDR), a critical metric in glaucoma screening. The image displays a yellowish-orange optic disc with a centralized, lighter-colored depression known as the optic cup. Retinal blood vessels are seen emerging from the center of the cup and radiating across the fundus. Superimposed on the image are white measurement markers: a long vertical dotted line labeled 'Disc (D)' spans the entire vertical diameter of the optic disc, and a shorter vertical dotted line labeled 'Cup (C)' measures the vertical diameter of the cup. The formula 'Vertical cup-to-disc ratio (VCDR) = C/D' is provided to define the relationship between these two measurements. This educational diagram is used to teach medical students and clinicians how to assess optic nerve cupping, where a VCDR ≥ 0.8 is typically considered pathological and suggestive of glaucomatous nerve damage and neuroretinal rim thinning.
otitis media tympanic membrane cholesteatoma ear pathology
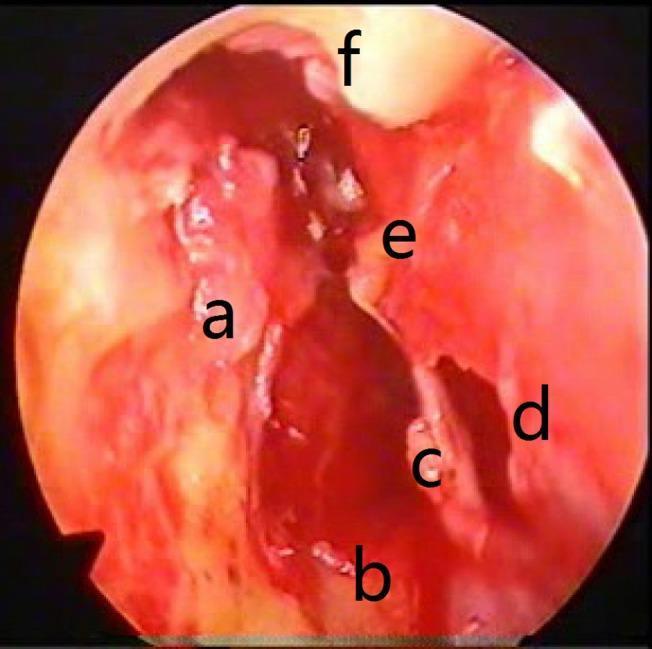
This clinical photograph displays a preoperative endoscopic view of the human middle ear, demonstrating significant pathology associated with chronic otitis media. The image shows a large area of cholesteatoma and inflammatory granulation tissue (a) localized around the stapes and facial recess. Anatomical landmarks include the malleus (e), which remains visible, and the Eustachian tube opening (b) located anteriorly. A prominent tympanic membrane perforation (d) is seen posteriorly, adjacent to the hypotympanum (c). Additionally, there is evident bone destruction in the superior aspect of the canal wall, identified as scutum erosion (f). The mucosal surfaces appear erythematous and thickened, characteristic of chronic inflammation. This image illustrates key diagnostic features used in otolaryngology for assessing the extent of middle ear disease and planning surgical interventions like tympanomastoidectomy.
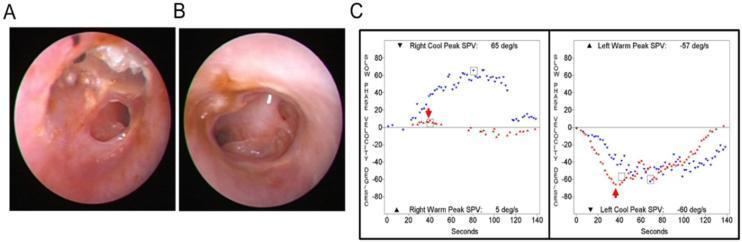
This composite image illustrates diagnostic findings for a 77-year-old patient with bilateral chronic otitis media. Panels A and B are otoendoscopic clinical photographs showing bilateral tympanic membrane pathology. Panel A displays the right ear with a visible epitympanic cholesteatoma and central perforation, while Panel B displays the left ear with a large central tympanic membrane perforation. Panel C contains two graphs from a bithermal caloric test, plotting Slow Phase Velocity (SPV) in degrees per second against time in seconds. The graphs demonstrate 'caloric inversion' during warm air irrigation. Red arrows indicate the peak SPV points where the nystagmus response is opposite in direction to the expected physiological response (inverted). This visual documentation is highly relevant for otolaryngology education, specifically in diagnosing vestibular dysfunction in the presence of middle ear disease and perforated tympanic membranes.
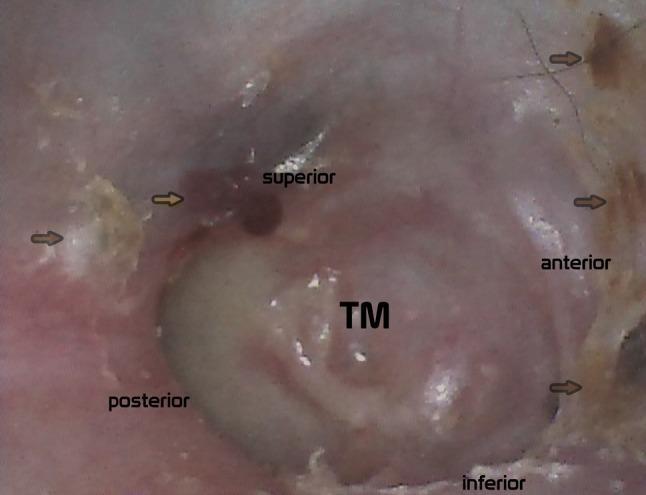
This clinical otoscopic photograph displays a reconstructed tympanic membrane (TM) 24 months post-surgery, likely following a tympanoplasty for chronic otitis media or cholesteatoma. The central reconstructed membrane appears intact, pinkish-white, and opaque, exhibiting visible vascularity and a smooth surface. Anatomical orientation is provided by 'superior', 'anterior', 'inferior', and 'posterior' labels. Key findings include a localized, dark red small hematoma located in the superior-posterior region, identified as an iatrogenic artifact from recent ear cleaning. Furthermore, multiple yellowish-white, irregular patches of keratinized surface epithelium remains are visible, particularly along the posterior and anterior margins of the ear canal and graft junction. The image serves as an educational tool for post-operative monitoring of middle ear reconstruction, illustrating normal graft healing and the identification of non-pathological artifacts versus potential disease recurrence.
vitamin deficiency kwashiorkor marasmus malnutrition child

A side-by-side clinical photograph comparing two distinct presentations of severe acute malnutrition (SAM) in pediatric patients. The child on the left demonstrates non-oedematous malnutrition, also known as marasmus. Visual features include marked muscular wasting, loss of subcutaneous fat, and prominent skeletal structures, particularly the ribs. A peripheral venous cannula is secured to the child's left wrist. The child on the right demonstrates oedematous malnutrition, often referred to as kwashiorkor. Key clinical signs include generalized bilateral pitting oedema and extensive dermatological changes. These skin lesions present as a 'flaky paint' dermatosis, characterized by hyperpigmented patches with areas of desquamation, peeling, and underlying hypopigmentation distributed across the limbs and torso. The image serves as a teaching tool for distinguishing between marasmic wasting and the oedematous/skin-involved manifestations of kwashiorkor in global health and pediatric nutrition contexts.
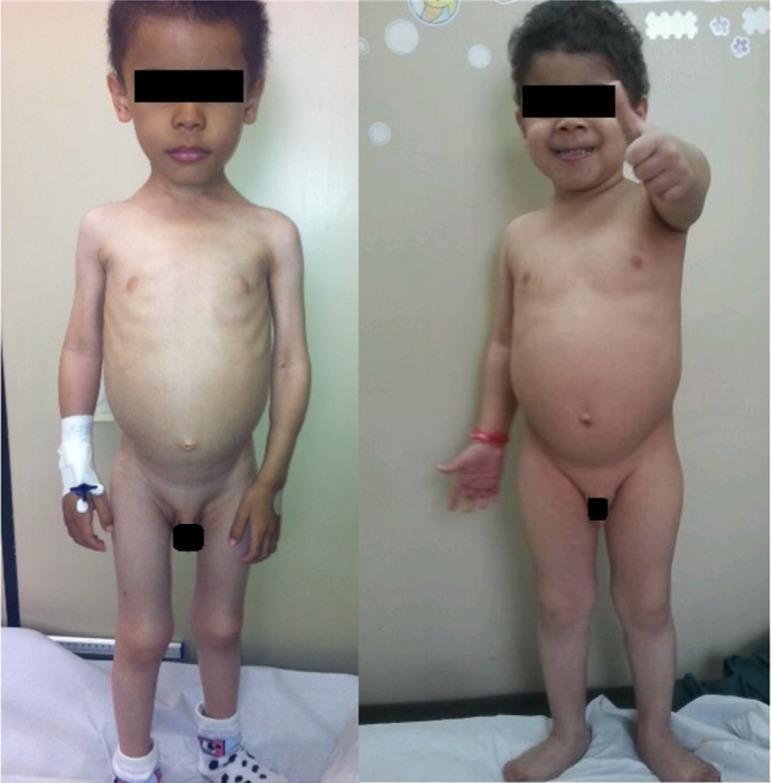
A clinical comparison photograph demonstrating the progression of nutritional recovery in a pediatric patient with severe protein-calorie malnutrition. The left image (initial consultation) shows a male child exhibiting signs of marasmus/kwashiorkor-like features: severe wasting of the limbs, prominent ribcage (skeletal prominence), and a distended, protuberant abdomen. The patient appears apathetic with an intravenous catheter in the right hand. The right image (two months post-intervention) shows the same patient after a high-calorie, high-protein dietary regimen. Visible clinical improvements include significant weight gain, replenishment of subcutaneous fat and muscle mass (limbs appear fuller, ribs no longer visible), and improved postural muscle tone. The patient's facial expression and a 'thumbs-up' gesture indicate improved mood and neurological status. This comparison illustrates the physical manifestations of successful nutritional rehabilitation in cases of severe malnutrition or neglect, serving as an educational example of catch-up growth and clinical recovery in pediatrics.

This clinical photograph illustrates severe pediatric malnutrition, likely marasmus, in a young child. The child exhibits profound emaciation characterized by a 'skin and bones' appearance, visible rib protrusion, and significant loss of subcutaneous fat and muscle mass. The skin is taut and the temporal region shows wasting. Thin, sparse hair is evident, which can be a sign of protein-energy malnutrition (PEM). An adult is seen providing nutritional support by spoon-feeding the child a light-colored, semi-liquid therapeutic porridge from a plastic bowl. This visual serves as an educational example of the physical manifestations of chronic calorie deficiency and global food insecurity. The image is relevant for medical studies in global health, pediatrics, and clinical nutrition, demonstrating the critical need for nutritional rehabilitation in severely malnourished populations.
salivary gland pleomorphic adenoma Warthin tumor parotid histology
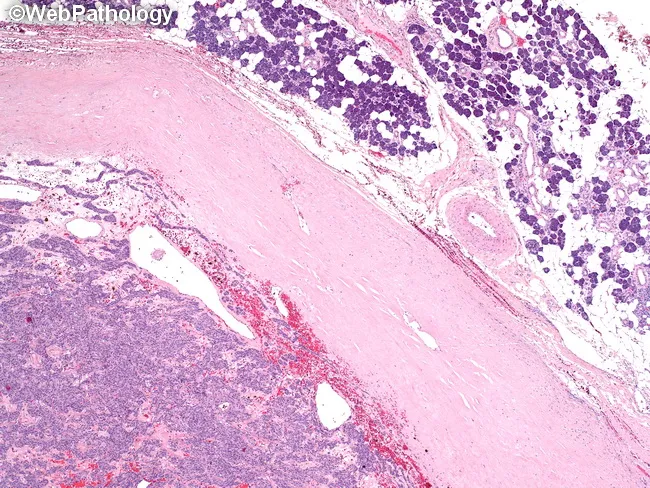
Pleomorphic adenoma of a major salivary gland (parotid) is depicted on hematoxylin and eosin stained histology. The lesion is a well circumscribed, encapsulated neoplasm: a thick fibrous capsule delineates tumor from adjacent normal parotid tissue seen in the upper right, with the mass projecting toward the lower left. The tumor shows biphasic histology with epithelial elements forming duct-like structures and nests, embedded in a variably myxoid to chondromyxoid stroma. Epithelial cells range from cuboidal to columnar, often arranged in sheets and tubules, while myoepithelial cells display plasmacytoid to spindle morphologies, contributing to a heterogeneous, hyalinized background. The stroma may contain cartilaginous or osseous-like foci in places; overall architecture remains orderly rather than infiltrative. Capsule integrity is a key diagnostic cue; the capsule here is thick and typically prevents invasion, although small capsular breaches may explain rare recurrences if not completely excised. No significant necrosis or high mitotic activity is observed. Clinically, this benign mixed tumor presents as a slow-growing, painless parotid mass with preserved facial nerve function. Differential diagnoses include basal cell adenoma and Warthin tumor; mucoepidermoid carcinoma must be considered when ductal differentiation or invasion is suspected. The image highlights the classic pleomorphic adenoma biology: myxoid/chondroid stroma with epithelial/myoepithelial components within a robust capsule.
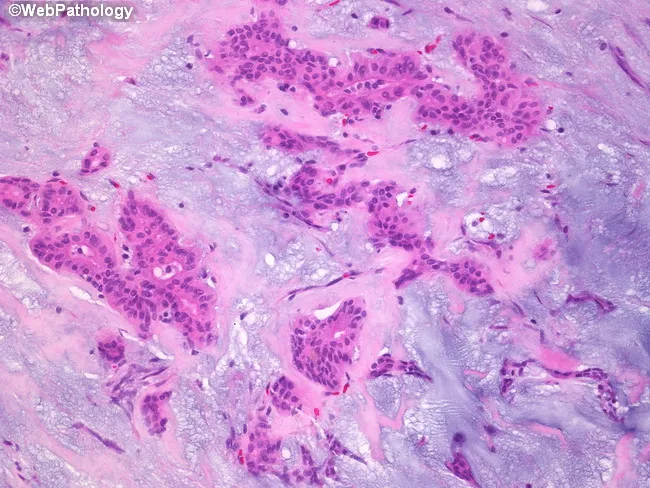
Pleomorphic adenoma histology, parotid salivary gland, examined by bright-field microscopy on Hematoxylin and Eosin stained sections. Imaging modality: Light microscopy; technique: Hematoxylin and Eosin staining. The sample reveals a classic biphasic neoplasm comprising epithelial ductal structures and myoepithelial cells embedded in an abundant stromal backdrop. Epithelial components form cords, ducts, and small island formations lined by cuboidal to columnar cells with eosinophilic cytoplasm and hyperchromatic nuclei. Intermixed myoepithelial cells display plasmacytoid or spindle morphologies, often surrounding epithelial elements. The stroma is a prominent feature, ranging from basophilic, myxoid to more eosinophilic, hyalinized areas. The myxoid matrix is rich in glycosaminoglycans and imparts a loose, gelatinous appearance, while hyalinized zones contribute dense eosinophilic bands. Overall architecture is often well circumscribed with minimal pleomorphism and low mitotic activity, consistent with benign behavior. Clinical significance includes differentiation from malignant salivary tumors; prognosis is favorable with complete surgical excision. Differential considerations include mucoepidermoid carcinoma, adenoid cystic carcinoma, basal cell adenoma, and Warthin tumor. This image is useful for educational purposes in pathology, otolaryngology, and head-and-neck surgery, illustrating quintessential pleomorphic adenoma features: epithelial and myoepithelial proliferation in a chondromyxoid stroma, with duct-like structures and a variable stromal composition. This histologic pattern aids diagnosis and education.
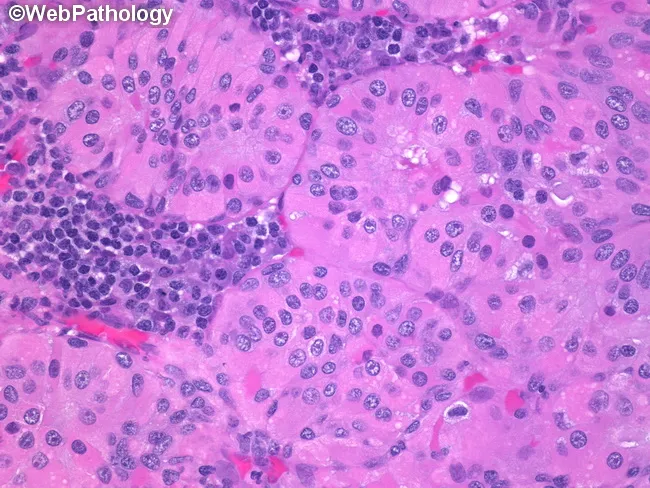
High-magnification light microscopic examination of a salivary gland lesion demonstrates classic Warthin’s tumor (papillary cystadenoma lymphomatosum). The specimen is parotid gland tissue rendered with Hematoxylin and Eosin staining and examined at 400x total magnification (40x objective). The neoplasm shows cystic and papillary architecture lined by a double layer of oncocytic epithelial cells with abundant eosinophilic granular cytoplasm and round, vesicular nuclei bearing prominent nucleoli. Papillary projections project into cystic spaces and are intimately associated with a dense, mature lymphoid stroma; germinal centers may be present within the stroma. The epithelial cells display minimal cytologic atypia and little mitotic activity, consistent with benign behavior. The background lymphoid milieu contains scattered plasma cells, contributing to the characteristic biphasic appearance of Warthin tumor. Overall, the lesion is well circumscribed and lacks invasion of surrounding parotid parenchyma. Clinically, this histology supports a benign salivary gland neoplasm with excellent prognosis following conservative surgical excision (parotidectomy or targeted tumor removal). Differential considerations include pleomorphic adenoma and mucoepidermoid carcinoma, but the combination of oncocytic lining and prominent lymphoid stroma with germinal centers strongly favors Warthin’s tumor. This image is valuable for educational teaching and diagnostic correlation in head and neck pathology. Ideal for radiology-pathology correlation and exams.
hepatitis B liver cirrhosis ascites portal hypertension splenomegaly CT scan
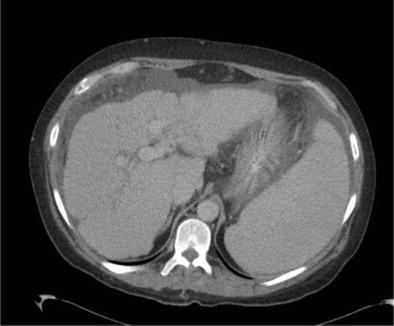
This axial contrast-enhanced CT scan of the abdomen in the portal venous phase illustrates hallmark imaging features of advanced cirrhosis and portal hypertension. The liver demonstrates a markedly irregular, nodular surface contour and a heterogeneous parenchymal appearance. A significant volume of low-attenuation fluid is visible within the peritoneal cavity, representing ascites, which serves to clearly outline the nodular hepatic capsule. On the contralateral side, there is pronounced splenomegaly, a common consequence of increased pressure within the portal venous system. The presence of these combined findings—cirrhotic liver morphology, ascites, and splenomegaly—is highly characteristic of chronic liver disease with secondary portal hypertension. The image serves as a clinical example of how fluid accumulation can enhance the visual assessment of organ surface characteristics in diagnostic radiology.
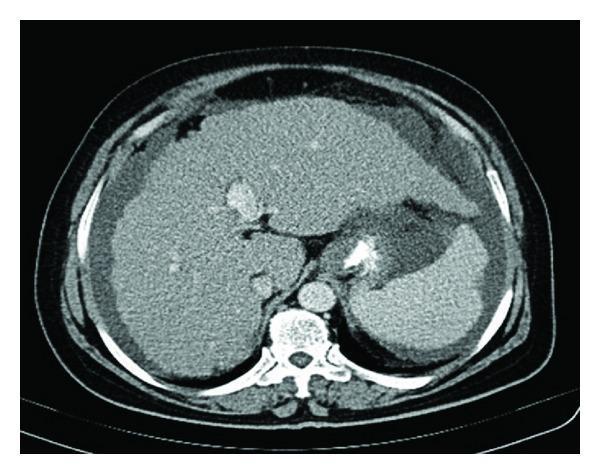
This diagnostic image is an axial slice from a contrast-enhanced computerized tomography (CT) scan of the upper abdomen. The imaging reveals significant signs of chronic liver disease and portal hypertension. The liver exhibits a nodular surface contour and a heterogeneous parenchymal texture characteristic of cirrhosis. Marked splenomegaly is present, with the spleen appearing significantly enlarged. A prominent feature is the large volume of ascites, visualized as a low-attenuation fluid collection surrounding the liver (perihepatic space) and the spleen (perisplenic space). The vertebral body is visible posteriorly, and central vascular structures, including the portal vein and aorta, can be identified. This scan is educationally significant for demonstrating the classic triad of radiological findings in advanced liver cirrhosis: a nodular liver, splenomegaly, and free intraperitoneal fluid (ascites).
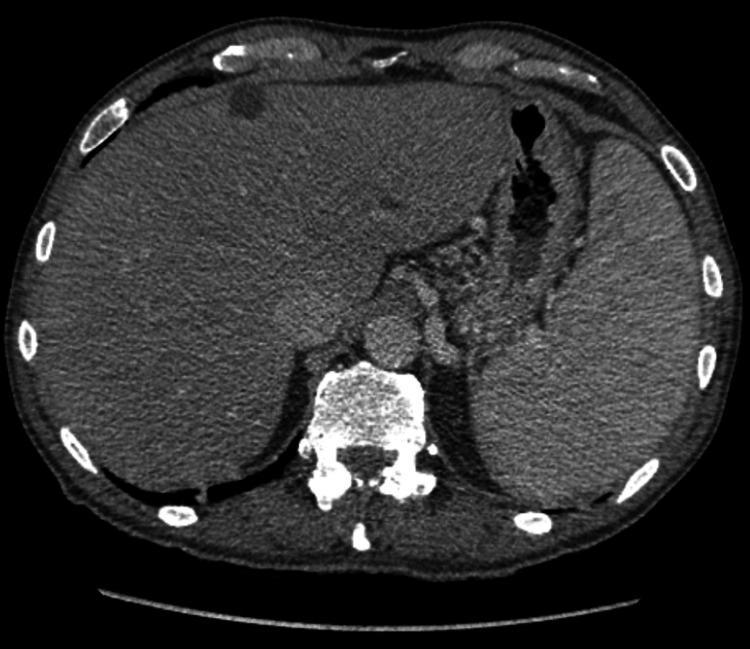
This diagnostic image is an axial slice from a non-contrast Computed Tomography (CT) scan of the upper abdomen. The primary findings are indicative of chronic liver disease and portal hypertension. The liver demonstrates a nodular, irregular contour and heterogeneous parenchymal texture characteristic of cirrhosis. Marked splenomegaly is present, with the spleen significantly enlarged and extending anteriorly and laterally. Several vascular findings suggest portal venous hypertension, including the visualization of prominent collateral vessels and a thickened gallbladder wall. A small amount of perihepatic ascites is visible as a low-attenuation fluid rim. The scan provides clinical evidence of systemic manifestations of liver dysfunction, suitable for medical education regarding the radiological presentation of cirrhotic morphology and secondary effects on the portal venous system.
retinal detachment shadow curtain fundus peripheral vision loss
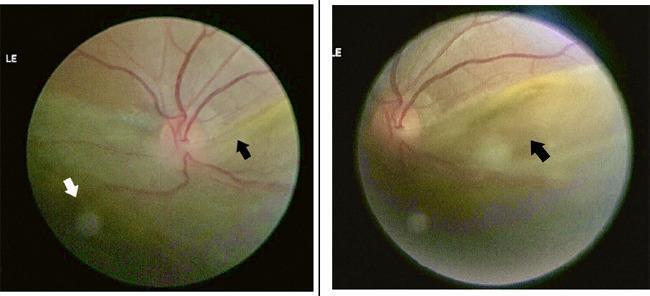
Two side-by-side posterior segment fundus photographs of a left eye demonstrating a rhegmatogenous retinal detachment (RRD) and dialysis of the ora serrata. The images show a clear demarcation between the superiorly attached pinkish-orange retina and the inferiorly detached retina, which appears elevated, pale, and somewhat hazy. The detachment involves the macula (macula-off), which is clinically significant for severe central vision loss. A black arrow points to the leading edge of the subretinal fluid and retinal elevation. A white arrow highlights a dialysis of the ora serrata located in the inferior temporal quadrant, visible as a peripheral retinal break where the retina has disinserted from its base. The optic disc and major retinal vasculature are visible, with the blood vessels seen traversing both the attached and detached portions of the fundus. These clinical findings are characteristic of a primary retinal detachment secondary to spontaneous or traumatic peripheral retinal dialysis.
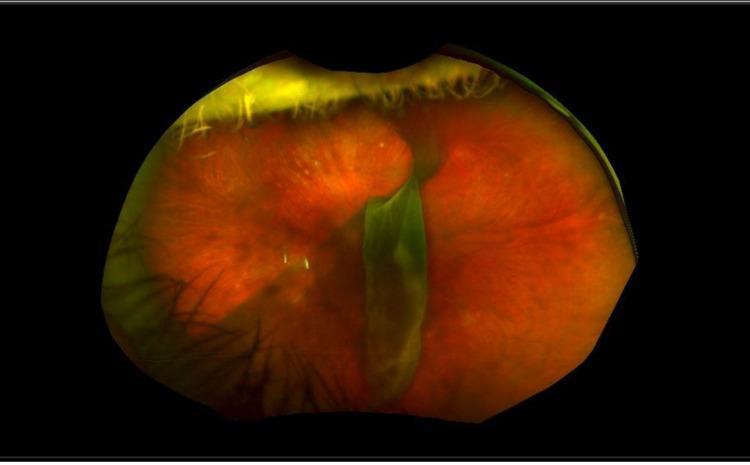
Ultra-widefield fundus photograph showing a complex retinal detachment in the left eye. The retina exhibits a predominantly orange-red hue with notable pathological alterations. A prominent, vertically oriented, bright green band or fold bisects the central retinal field, representing a significant structural irregularity or retinal tear. The superior peripheral retina appears highly elevated, translucent, and wrinkled, characteristic of subretinal fluid accumulation and corrugated retinal folds seen in rhegmatogenous retinal detachment. This diagnostic image demonstrates typical features of a large retinal tear where the neurosensory retina has separated from the underlying retinal pigment epithelium. The visibility of the eyelashes at the superior and lateral margins confirms the procedural nature of the wide-angle imaging. This clinical finding is highly significant for ophthalmological training, illustrating the 'black curtain' phenomenon and structural changes necessitating urgent surgical intervention like vitrectomy and scleral buckling.
epistaxis nosebleed Kiesselbach area anterior nasal septum Little area
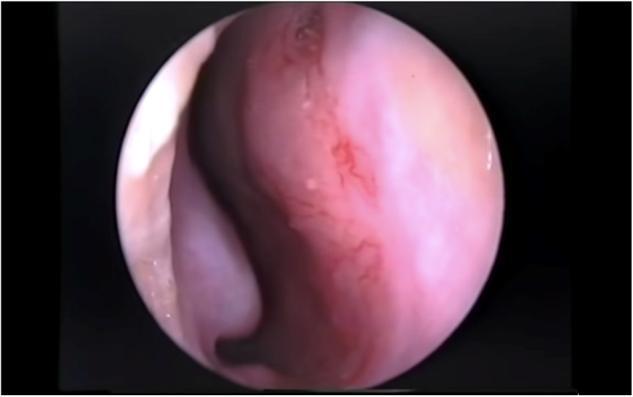
This clinical endoscopic photograph captures the internal anatomy of the nasal cavity, specifically focusing on the anterior nasal septum. The image illustrates the 'Little's area,' which houses the Kiesselbach's plexus, a highly vascularized region where the sphenopalatine, greater palatine, superior labial, and anterior ethmoidal arteries anastomose. The septal mucosa appears pinkish-red and moist. Visible on the surface is a network of fine, branching, and interconnected superficial red blood vessels (telangiectasia). The density of these vessels in this specific anatomical location is the primary clinical source for approximately 80% of anterior epistaxis cases. The image demonstrates the characteristic vascular fragility of this region, which is susceptible to environmental dryness, digital trauma, and inflammation. This visual is intended for ENT specialists and emergency medicine providers to understand the pathophysiology of nosebleeds and identify potential sites for chemical cauterization or topical treatment.
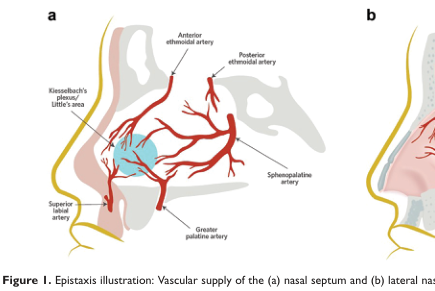
Summary : This illustration shows the vascular supply of the nasal septum, highlighting the main arteries involved in epistaxis (nosebleeds) and their anatomical locations. illustration: # Scene Overview : • Main subject is the vascular anatomy of the nasal septum (left side of the nose in sagittal section). • Perspective is a lateral cross-section, focusing on the internal nasal structures. • Colour palette includes red for arteries, yellow for outline, and blue shading for a specific area (Kiesselbach’s plexus/Little’s area). # Technical Details : • No scale bar or magnification indicated. • Anatomical labels are present for key arteries and regions. # Spatial Relationships : • The following arteries are labeled and shown branching within the nasal septum: • Anterior ethmoidal artery (superior, anterior region) • Posterior ethmoidal artery (superior, posterior region) • Sphenopalatine artery (posterior, central region) • Greater palatine artery (inferior, posterior region) • Superior labial artery (inferior, anterior region) • Kiesselbach’s plexus/Little’s area is highlighted in blue, located anteriorly on the septum, where several arteries converge. # Analysis : • The illustration emphasizes the convergence of multiple arteries at Kiesselbach’s plexus/Little’s area, a common site for anterior nosebleeds (epistaxis). • The vascular supply is shown as dense and interconnected, especially in the anterior septal region, explaining the clinical significance of this area in nasal bleeding. • The lateral nasal wall (panel b) is only partially visible and not labeled in this crop.
use these also for making notes of C.Med
ok
Use these slides to make only C.Med notes from the standard book for reference, according to all instructions I gave you previously
Forget that I have test Tomorrow Then make all subjects notes according to my previous commands at beginning of chat This time take yourself as HOD of every subject