
1. A 32-year-old male present with weakness, Pallor, bleeding gums and hepatosplenomegaly and his Hb was 7gm%, total WBC count was 1,20,000/cumm with many mature WBC's which is positive for MPO. Platelet count was 40,000/cumm. (1+3+3+3=10) 1. What is the most probable diagnosis. 2. Discuss the Etiopathogenesis and morphology of the same condition. 3. Add a note on lab investigations of the same.
CML chronic myeloid leukemia Philadelphia chromosome bone marrow
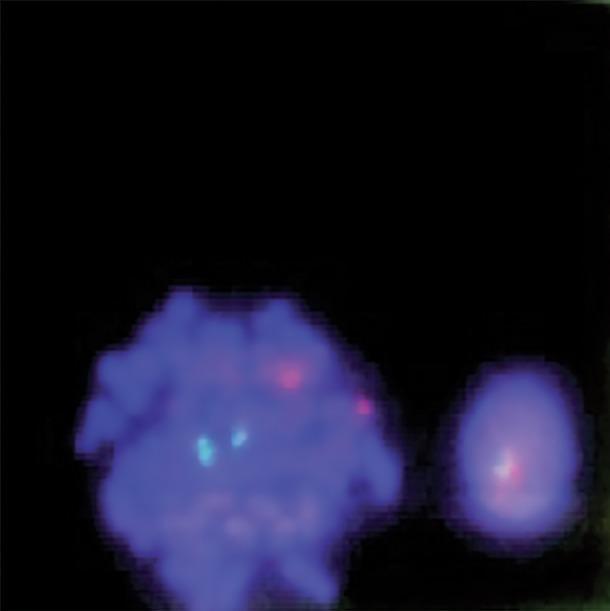
This diagnostic image displays a fluorescence in situ hybridization (FISH) analysis of human bone marrow cells, used primarily for detecting the BCR-ABL1 gene fusion associated with Chronic Myeloid Leukemia (CML). The image shows two blue-stained nuclei (DAPI) against a dark background. On the left, a larger metaphase cell exhibits a normal signal pattern with two distinct cyan/green signals and two distinct red signals (2G2R), representing the normal location of the ABL1 and BCR genes on their respective chromosomes. On the right, a smaller interphase cell demonstrates a fusion signal where a red and a cyan/green signal overlap or are closely apposed, indicative of a chromosomal translocation. This visual is a key educational tool for demonstrating molecular cytogenetics, specifically the dual-color, dual-fusion probe technique used in hematopathology to identify the Philadelphia chromosome.
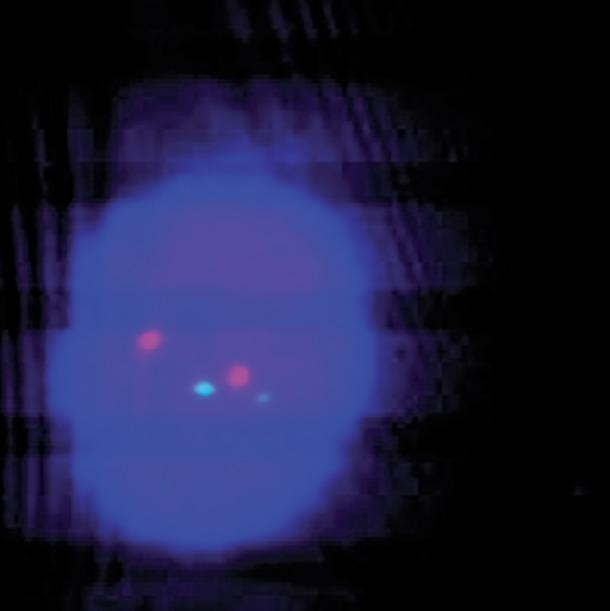
This diagnostic image demonstrates a human bone marrow cell during interphase, analyzed using Fluorescence In Situ Hybridization (FISH) technique. The cell nucleus is stained with a blue DAPI counterstain, providing a background for visualizing chromosomal probes. Within the nucleus, four distinct fluorescent signals are visible: two green (G) signals and two red (R) signals, establishing a '2G2R' pattern. This specific arrangement of discrete, non-fused spots indicates a normal signal pattern, specifically used in hematopathology to rule out chromosomal translocations such as the BCR-ABL1 fusion (Philadelphia chromosome) commonly associated with Chronic Myeloid Leukemia (CML). The absence of overlapping or fused 'yellow' signals confirms the lack of a fusion event in this specific cell. This image serves as an educational reference for normal cytogenetic results in clinical hematology and oncology.
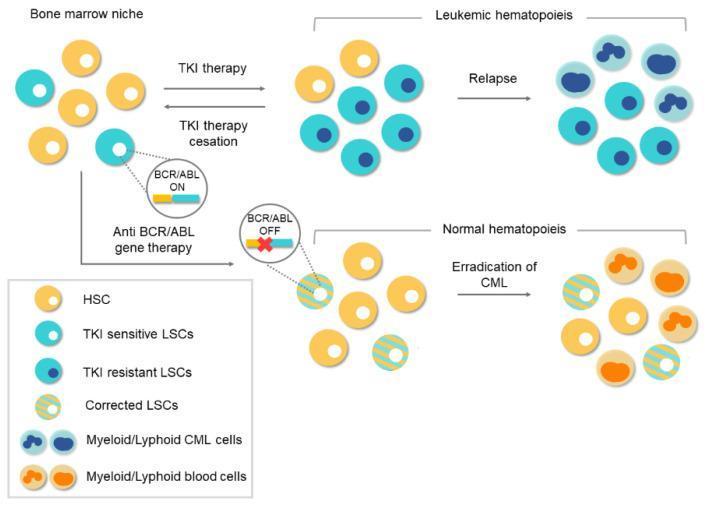
A comparative medical illustration detailing therapeutic pathways for Chronic Myeloid Leukemia (CML) within the bone marrow niche. The diagram contrasts conventional Tyrosine Kinase Inhibitor (TKI) therapy with Anti-BCR/ABL gene therapy. The top pathway illustrates 'Leukemic Hematopoiesis': following TKI therapy, a mixed population of yellow Hematopoietic Stem Cells (HSCs), light blue TKI-sensitive Leukemic Stem Cells (LSCs), and dark blue TKI-resistant LSCs is shown. Treatment cessation or resistance leads to relapse, characterized by the proliferation of myeloid/lymphoid CML cells. The lower pathway depicts the potential of gene therapy: 'Anti-BCR/ABL gene therapy' targets LSCs to silence the oncogene (BCR/ABL OFF). This results in 'Corrected LSCs' (depicted with yellow and blue stripes), which repopulate the niche alongside normal HSCs. The final outcome is 'Normal Hematopoiesis' and the eradication of CML, visualised by the presence of mature myeloid/lymphoid blood cells (orange). The diagram serves as an educational tool for hematology and oncology, emphasizing the limitations of protein-level inhibition versus genome-level editing in stem cell niches.
Chronic Myeloid Leukemia (CML)
1. Most Probable Diagnosis
| Feature | Significance |
|---|---|
| Age 32 years, male | CML peaks in 4th-5th decade but can occur in young adults |
| Hb 7 g% (anemia) | Normocytic normochromic anemia from marrow replacement |
| WBC 1,20,000/cumm | Marked leukocytosis - hallmark of CML |
| Many mature WBCs | Unlike AML, CML cells retain ability to differentiate - a "full spectrum" of maturation |
| MPO positive | Myeloid lineage (rules out ALL/CLL) |
| Platelets 40,000/cumm | Thrombocytopenia (though platelets are often elevated early; may indicate advanced phase) |
| Hepatosplenomegaly | Extensive extramedullary hematopoiesis - massive splenomegaly is a cardinal feature |
| Pallor, weakness, bleeding gums | Anemia + thrombocytopenia effects |
2. Etiopathogenesis and Morphology
Etiopathogenesis
- An elongated chromosome 9 (receives BCR sequences)
- A shortened chromosome 22 - the Philadelphia chromosome
"The Ph chromosome is found in more than 90% of CML patients, whereas approximately 5% of cases have translocations involving chromosomes 9, 22, and others as well. The remaining 5% have undetectable Ph chromosome, but BCR-ABL can be detected by FISH or RT-PCR." - Goldman-Cecil Medicine
- M-BCR (major) - exons e13/e14 or e14/e15 → produces p210BCR-ABL (present in >95% of CML)
- m-bcr (minor) - e1/e2 → produces p190BCR-ABL (more common in Ph+ ALL)
- μ-bcr (micro) → produces p230BCR-ABL (associated with chronic neutrophilic leukemia)
- Associates with the cytoplasmic membrane (rather than shuttling between nucleus and cytoplasm)
- Is constitutively active - unregulated tyrosine kinase activity
- Activates multiple downstream signaling pathways: RAS, MYC, STAT, JUN, PI-3 kinase
- These signals mimic the effects of continuous growth factor receptor activation
- Does not inhibit differentiation (key distinction from AML!) - hence cells mature nearly normally but proliferate excessively
- Promotes cell survival by inhibiting apoptosis
- Causes genomic instability and attenuation of DNA damage response
"Because BCR-ABL does not inhibit differentiation, the early disease course is marked by excessive production of relatively normal blood cells, particularly granulocytes and platelets." - Robbins Basic Pathology
| Phase | Blast % (WHO) | Features |
|---|---|---|
| Chronic | <10% in blood/marrow | Indolent, responds to TKIs |
| Accelerated | 10-19% | Increasing symptoms, additional cytogenetic abnormalities |
| Blast crisis | ≥20% | Resembles acute leukemia (myeloid 70%, lymphoid 30%) |
Morphology
Peripheral Blood Smear
- Leukocyte count often >100,000 cells/μL (as in this case: 1,20,000/cumm)
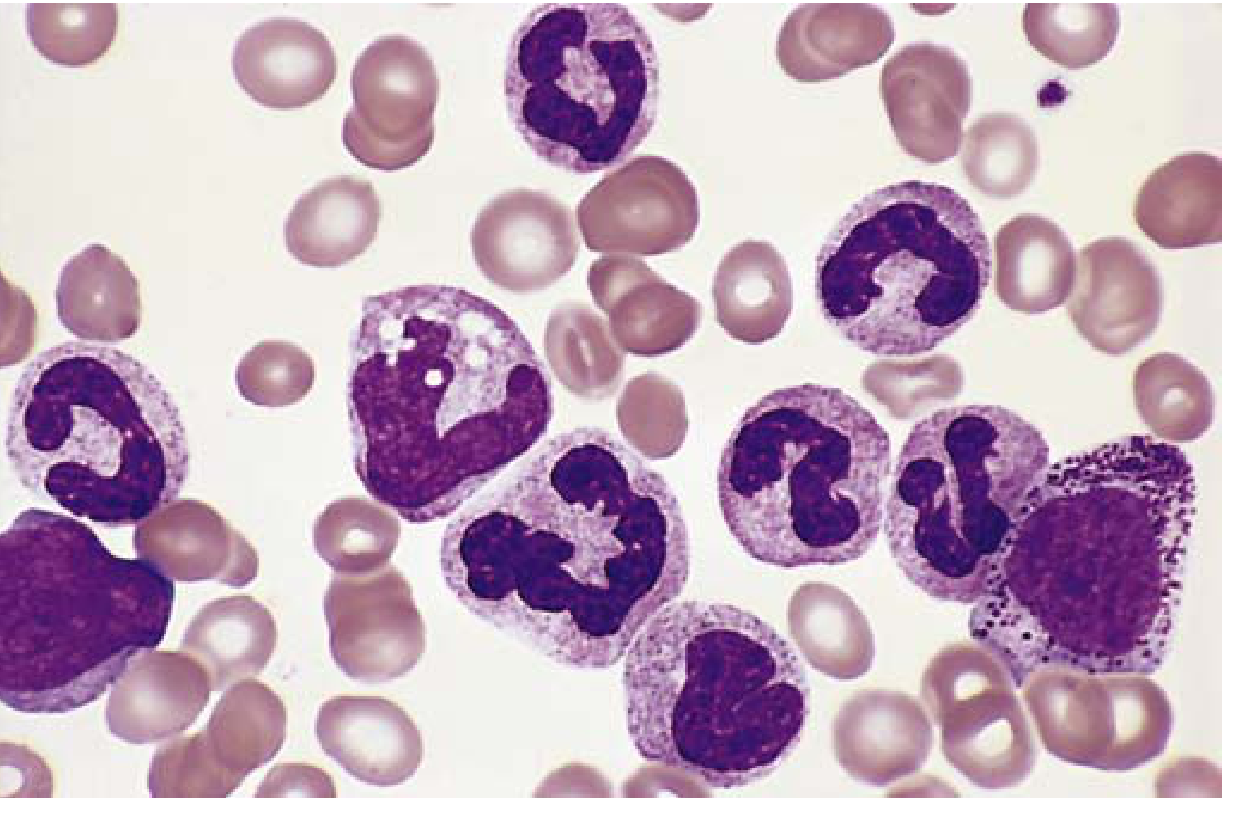
- Full spectrum of myeloid maturation - neutrophils, bands, metamyelocytes, myelocytes, promyelocytes (the "myelocyte bulge" at myelocyte-metamyelocyte stage is classic)
- Basophilia and eosinophilia - almost invariably increased
- Platelets may be increased (in early disease) or decreased (in accelerated phase)
- Normocytic normochromic anemia
- Blasts <10% in chronic phase
Bone Marrow
- Markedly hypercellular (90-100% cellularity, with near-complete replacement of fat)
- Increased maturing granulocytic and megakaryocytic precursors
- Myeloid-to-erythroid ratio often 10:1 to 25:1 (normally 3:1 to 4:1)
- Pseudo-Gaucher cells (lipid-laden macrophages) may be seen
- Reticulin fibrosis may be present
Spleen
- Massive splenomegaly - one of the most prominent physical findings
- The red pulp resembles bone marrow due to extensive extramedullary hematopoiesis
- This burgeoning proliferation often compromises local blood supply, leading to splenic infarcts
- Sinusoids are packed with maturing myeloid cells
Liver
- Hepatomegaly due to extramedullary hematopoiesis in sinusoids (less prominent than spleen)
3. Laboratory Investigations
A. Peripheral Blood
| Test | Finding in CML |
|---|---|
| Hemoglobin | Decreased (normocytic normochromic anemia) |
| WBC count | Markedly elevated (often >50,000-200,000/cumm) |
| Differential | Full spectrum of myeloid cells; absolute basophilia and eosinophilia; <10% blasts in chronic phase |
| Platelets | Variable - can be elevated (early), normal, or decreased |
| Leukocyte Alkaline Phosphatase (LAP) score | Low or absent - key distinction from leukemoid reactions (where LAP is high) |
B. Bone Marrow Examination
- Aspiration and biopsy - hypercellular marrow with myeloid hyperplasia
- Megakaryocytic proliferation with small "dwarf" megakaryocytes (characteristic)
- <10% blasts in chronic phase
- Increased basophil and eosinophil precursors
C. Cytogenetics - GOLD STANDARD for Diagnosis
- Conventional karyotyping: Detects t(9;22)(q34;q11) - the Philadelphia chromosome - in >90% of cases
- Identifies additional cytogenetic abnormalities in accelerated/blast phase (e.g., trisomy 8, isochromosome 17q, trisomy 19)
D. Molecular Diagnostics
- FISH (Fluorescence In Situ Hybridization): Detects BCR-ABL fusion at the DNA level; useful when Ph chromosome is not detected cytogenetically ("Ph-negative CML")
- RT-PCR (Reverse Transcription PCR): Detects the chimeric BCR-ABL mRNA; highly sensitive; quantitative PCR (qPCR) is used for disease monitoring after treatment (measures residual disease in International Scale units)
- Identifies the specific transcript type: p210 (most CML) vs p190 vs p230
E. Special Tests
| Test | Purpose |
|---|---|
| LAP score | Low in CML; high in leukemoid reaction - important differential |
| Serum uric acid | Elevated due to high cell turnover (risk of tumor lysis/gout) |
| Serum LDH | Elevated |
| Serum B12 and B12-binding proteins | Markedly elevated (transcobalamin I released by granulocytes) |
| Flow cytometry | Confirms myeloid lineage; identifies blast percentage and immunophenotype for phase determination |
| HLA typing | Required if allogeneic stem cell transplant is planned |
F. Distinguishing CML from Leukemoid Reaction
| Feature | CML | Leukemoid Reaction |
|---|---|---|
| LAP score | Low | High |
| Basophilia | Present | Absent |
| Splenomegaly | Massive | Mild or absent |
| BCR-ABL | Positive | Negative |
| Cause | Neoplastic | Infection/inflammation |
- Robbins & Kumar - Basic Pathology, pp. 583-585 (Chronic Myeloid Leukemia - Pathogenesis and Morphology)
- Robbins, Cotran & Kumar - Pathologic Basis of Disease (Chronic Myeloid Leukemia section)
- Goldman-Cecil Medicine International Edition (Chapter 170 - Chronic Myeloid Leukemia)
Wrong answer this was AML
AML acute myeloid leukemia blast Auer rod peripheral blood smear bone marrow
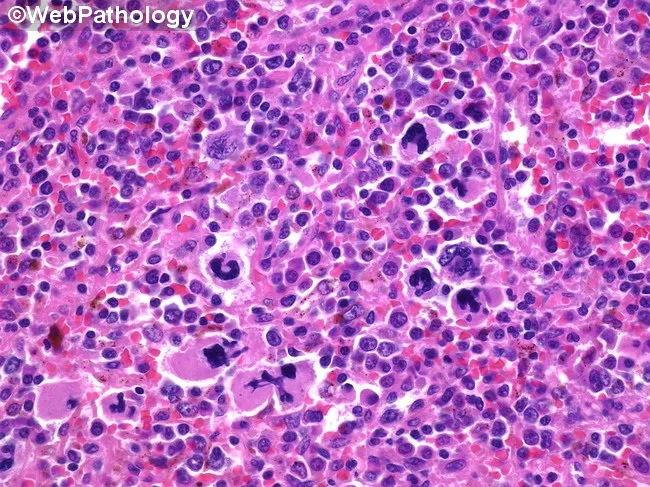
High-magnification brightfield micrograph of a human bone marrow aspirate smear stained with Hematoxylin and Eosin, demonstrating dysplastic megakaryocytes in a hematopoietic background. The megakaryocytes exhibit atypical nuclear morphology, including multinucleation, irregular lobulation, and nuclear fragmentation, with variable cytoplasmic basophilia. Background cellularity shows concurrent dyserythropoiesis and dysplastic myeloid precursors consistent with a myelodysplastic spectrum. Overall architecture may be hypercellular or variably cellular, with scattered normal hematopoietic elements interspersed among abnormal cells. Features are most prominent in the megakaryocytic lineage, where dysplasia is a salient hallmark. The image illustrates morphologic criteria that support a diagnosis in the context of possible progression toward acute leukemia, and should be correlated with peripheral blood counts, marrow blast percentage, cytogenetic and molecular studies. Clinically, such dysplastic megakaryocytes are associated with cytopenias and splenomegaly, and approximately a fifth of patients with related myelodysplastic/myeloproliferative conditions progress to acute myeloid leukemia. This representation is valuable for educational, diagnostic, and research purposes, particularly in studies of megakaryocytic dysplasia, MDS/AML continuum, prognostication, and therapeutic planning focused on palliation and cytopenia management. Careful documentation of features and context enhances reproducibility, supports standardized reporting, and facilitates cross-institutional data sharing for outcome studies and biomarker-driven clinical trials.
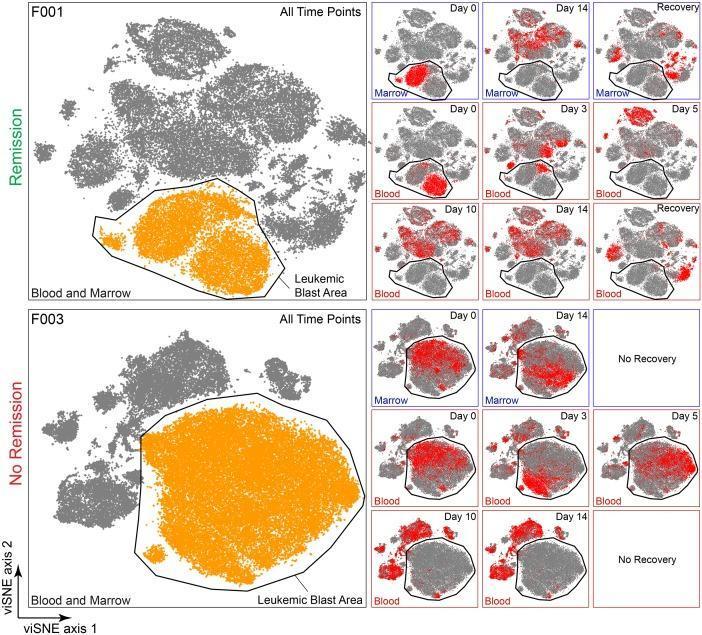
This infographic presents a 27-dimensional viSNE (visual t-distributed Stochastic Neighbor Embedding) analysis of mass cytometry data from two Acute Myeloid Leukemia (AML) patients, labeled F001 and F003, visualizing clinical response over time. The primary visualization for each patient includes a combined viSNE map of all live cells from all time points. A black outline demarcates the 'Leukemic Blast Area,' highlighted in orange, representing the phenotypic space occupied by malignant cells. Patient F001 is labeled 'Remission,' while Patient F003 is labeled 'No Remission.' To the right, series of longitudinal viSNE maps represent specific time points (Day 0, 3, 5, 10, 14, and Recovery) from both bone marrow and peripheral blood. In these temporal maps, cells from the specific time point are highlighted in red against a grey background of all historical cells. The visualization demonstrates educational concepts in hematology-oncology, specifically the clearance of malignant blasts in the remission patient (F001) versus the persistence of the leukemic population within the blast area in the non-remission patient (F003) across induction therapy.
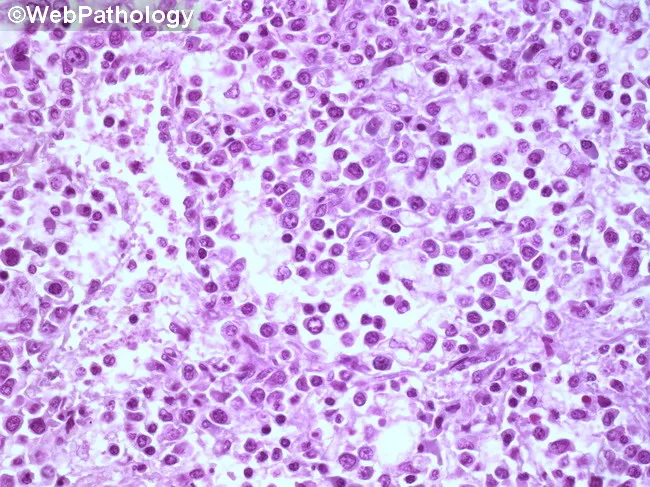
Imaging modality: light microscopy of a hematopathology slide from a bone marrow aspirate smear. Stain: Hematoxylin and Eosin (H&E). Magnification: high-power field (~400x total; 40x objective with 10x ocular). Anatomical location: bone marrow within the medullary cavity (hematopoietic tissue). Visual features: sheets of immature blasts with high nuclear-to-cytoplasmic ratio, round to oval nuclei, fine chromatin, prominent nucleoli, and scant basophilic cytoplasm; increased cellularity with near-complete effacement of normal hematopoiesis; occasional mitotic figures; minimal cytoplasmic granularity; sparse residual neutrophils, erythroid precursors, and megakaryocytes. Pathologic interpretation: diffuse marrow infiltration by blasts, consistent with an acute leukemia until immunophenotyping and genetic studies delineate subtype. Diagnostic significance: morphologic hallmark of an acute hematologic malignancy; requires ancillary tests (flow cytometry, immunohistochemistry, cytogenetics/molecular studies) for lineage classification (myeloid vs lymphoid), prognosis, and treatment planning. Differential considerations: ALL (acute lymphoblastic leukemia), AML (acute myeloid leukemia), lymphoblastic lymphoma with marrow involvement, myelodysplastic syndrome with excess blasts, or nonhematopoietic marrow infiltration. Clinical correlation: commonly presents with cytopenias, fatigue, infections, and bleeding; pediatric ALL vs adult AML guidance; urgent hematology-oncology workup is indicated. Educational use: foundational blast morphology recognition, marrow infiltration patterns, and the need for confirmatory immunophenotyping. This image is valuable for training in blast morphology, differential diagnosis, and education in hematopathology.
Important Note on the Diagnosis
- In AML, the WBC is elevated due to immature blasts (which are MPO-positive at >3% in M1/M2), not mature cells. Hepatosplenomegaly is also less prominent in AML.
- In CML, mature granulocytes dominate and counts routinely exceed 1,00,000/cumm with massive splenomegaly.
- The LAP score and bleeding gums (gingival infiltration) would help distinguish - gingival infiltration is a classic feature of AML M4/M5 (monocytic), not CML.
Acute Myeloid Leukemia (AML)
1. Most Probable Diagnosis: Acute Myeloid Leukemia (AML)
| Clinical Feature | Relevance to AML |
|---|---|
| Age 32 years, male | AML occurs at all ages; younger adults often have favorable-cytogenetic subtypes |
| Hb 7 g% | Anemia from bone marrow replacement by blasts |
| WBC 1,20,000/cumm, MPO+ | Leukemic proliferation of myeloid lineage; MPO confirms myeloid blasts |
| Platelets 40,000/cumm | Thrombocytopenia from marrow failure - causes bleeding gums |
| Bleeding gums | Classic mucosal hemorrhage from thrombocytopenia; gingival infiltration in M4/M5 |
| Hepatosplenomegaly | Extramedullary infiltration by leukemic blasts |
| Pallor, weakness | Anemia and neutropenia effects |
"AML is a tumor of hematopoietic progenitors caused by acquired oncogenic mutations that impede differentiation, leading to the accumulation of immature myeloid blasts in the marrow. The replacement of the marrow with blasts produces marrow failure and complications related to anemia, thrombocytopenia, and neutropenia." - Robbins & Kumar Pathologic Basis of Disease
2. Etiopathogenesis and Morphology
Etiopathogenesis
Cell of Origin
Two-Hit Model of Pathogenesis
- t(8;21) - creates RUNX1::RUNX1T1 fusion gene; disrupts the RUNX1/CBFB transcription factor essential for normal hematopoiesis → blocks maturation of myeloid cells (AML-M2; 5-12% of AML)
- inv(16) or t(16;16) - creates CBFB::MYH11 fusion; blocks the same RUNX1/CBFB complex (AML-M4Eo)
- t(15;17) - creates PML::RARα fusion protein that blocks retinoic acid-mediated differentiation at the promyelocyte stage → Acute Promyelocytic Leukemia (APL/AML-M3) - responds dramatically to ATRA
- FLT3-ITD (internal tandem duplication) - most common mutation in AML (~30%); constitutively activates FLT3 receptor tyrosine kinase
- RAS mutations - constitutive MAP kinase signaling
- KIT mutations - especially in core binding factor AMLs
- These mutations alone are insufficient to cause AML but cooperate with class II mutations
- IDH1/IDH2 mutations - produce the oncometabolite 2-hydroxyglutarate, causing abnormal DNA methylation
- NPM1 mutations (most common single gene mutation, ~30%) - affects nuclear-cytoplasmic transport
- Cohesin complex mutations
- Associated with complex karyotype, erythroid differentiation, and very poor prognosis
Etiology / Risk Factors
| Risk Factor | Mechanism |
|---|---|
| Ionizing radiation | DNA damage → chromosomal rearrangements |
| Cytotoxic chemotherapy (alkylating agents) | Therapy-related AML; monosomy 5/7 |
| Topoisomerase II inhibitors (etoposide, doxorubicin) | Therapy-related AML; KMT2A (11q23) rearrangements |
| Benzene / organic solvents | Marrow toxin |
| Smoking | Carcinogen exposure |
| Myelodysplastic syndrome (MDS) | Clonal evolution |
| Down syndrome (trisomy 21) | GATA1 mutation → megakaryoblastic AML |
| Prior hematologic disorders | PNH, aplastic anemia, PV can evolve to AML |
Morphology
Peripheral Blood Smear
- Leukocytosis with circulating blasts (>20% required for diagnosis)
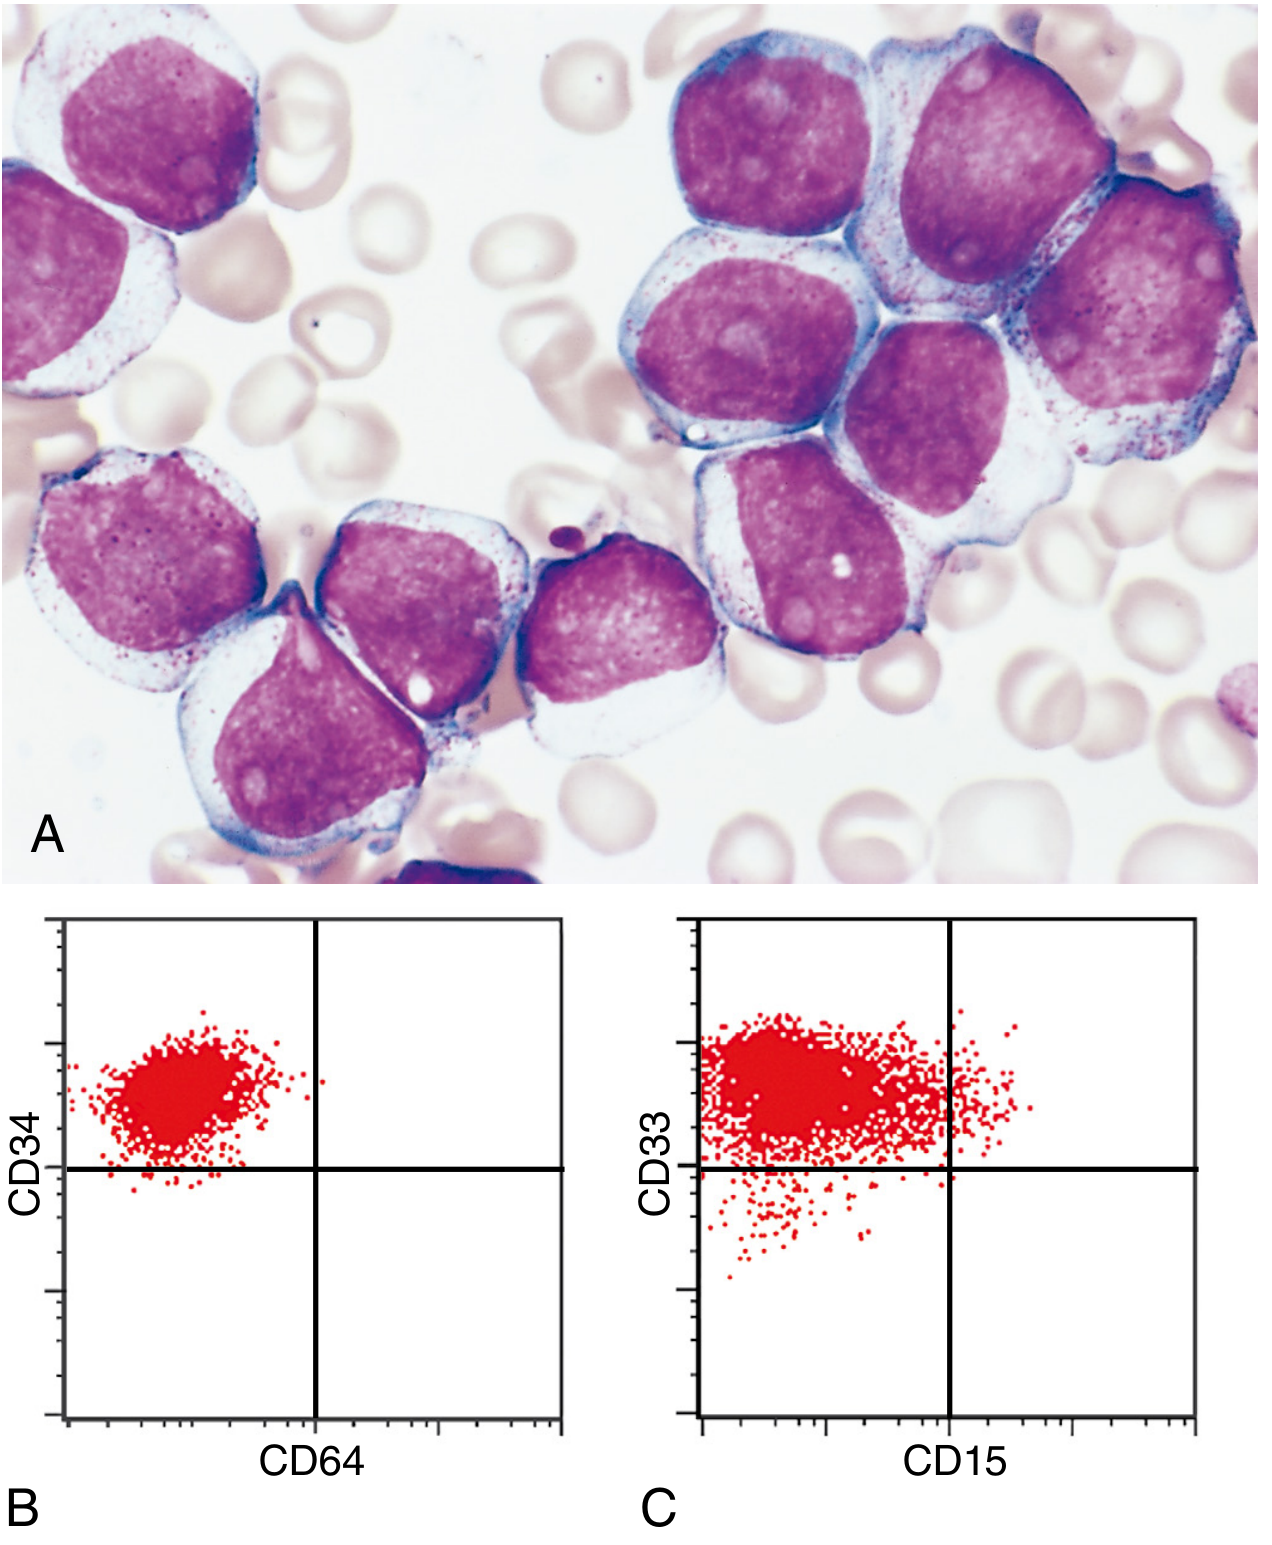
- Myeloblasts: Large cells with delicate nuclear chromatin, 2-4 prominent nucleoli, scant-to-moderate cytoplasm with fine azurophilic granules
- Auer rods: Pathognomonic needle-like azurophilic cytoplasmic inclusions (fused primary granules) - diagnostic of AML when present (seen in ~50% of AML cases, especially M2 and M3)
- In APL (M3): "Faggot cells" with bundles of Auer rods - virtually diagnostic
- Normocytic normochromic anemia
- Thrombocytopenia
- Aleukemic presentation: Occasionally blasts are absent from blood but present in marrow
Bone Marrow
- Hypercellular with ≥20% blasts (WHO 2022 criterion)
- Near-complete effacement of normal hematopoiesis
- Variable differentiation depending on subtype (FAB M0-M7)
- Auer rods in myeloblasts/promyelocytes
- In APL: Bone marrow packed with hypergranular promyelocytes; high risk of DIC from procoagulants released by granules
- In AML-M5 (monocytic): Large monoblasts with folded/lobulated nuclei, abundant pale cytoplasm - often infiltrate gingiva and skin
Organs
- Gingival infiltration - characteristic of monocytic AML (M4/M5); monocytic cells home to tissues
- Skin - leukemia cutis (monocytic AML)
- Spleen/liver - hepatosplenomegaly from leukemic infiltration (less massive than CML)
- CNS - meningeal involvement (less common than ALL)
- Myeloid sarcoma (chloroma) - localized soft tissue mass of myeloid blasts; may precede systemic AML
3. Laboratory Investigations
A. Complete Blood Count (CBC)
| Parameter | Finding |
|---|---|
| Hemoglobin | Decreased (normocytic normochromic anemia) |
| WBC | Variable - elevated (leukocytosis), normal, or decreased (aleukemic) |
| Differential | Blasts prominent; myeloid maturation gap ("hiatus leukemicus") |
| Platelets | Decreased (thrombocytopenia) |
B. Peripheral Blood Smear
- Identification of blast morphology - the starting point
- Look for Auer rods (diagnostic of myeloid lineage)
- Note degree of differentiation, basophilia, eosinophilia
C. Bone Marrow Examination (MANDATORY)
- Aspiration: 500-cell differential count; ≥20% blasts required for AML diagnosis (except for AML with defining genetic abnormalities like t(8;21), inv(16), t(15;17) where any blast % qualifies)
- Biopsy (trephine): Cellularity, architecture, fibrosis (especially in megakaryoblastic AML-M7)
- Look for Auer rods, promyelocyte content, monocytic differentiation
D. Cytochemistry
| Stain | Positive in | Significance |
|---|---|---|
| Myeloperoxidase (MPO) | Myeloblasts (M1-M4) | Myeloid lineage; ≥3% positivity in blasts = myeloid |
| Sudan Black B (SBB) | Same as MPO | Phospholipids; parallels MPO |
| Chloroacetate Esterase (CAE) | Granulocytic blasts | Specific esterase for neutrophil lineage |
| Non-specific esterase (NSE / α-naphthyl acetate) | Monocytic blasts (M4, M5) | Inhibited by sodium fluoride - confirms monocytic lineage |
| PAS (Periodic Acid-Schiff) | Erythroid AML (M6) | Coarse block positivity |
| Leukocyte Alkaline Phosphatase (LAP) | Low or zero in AML | Distinguishes from leukemoid reaction (high LAP); also low in CML |
E. Immunophenotyping by Flow Cytometry (ESSENTIAL)
| Marker | Expression in AML |
|---|---|
| CD13, CD33 | Positive (pan-myeloid markers) |
| CD117 (c-KIT) | Positive in most AML |
| HLA-DR | Positive (except APL/M3 - negative) |
| CD34 | Positive (except APL and more differentiated AML) |
| MPO by flow | Positive (most specific myeloid marker) |
| CD14, CD64, CD11b | Monocytic differentiation (M4/M5) |
| CD41, CD61 | Megakaryoblastic AML (M7) |
| Lymphoid markers (CD3, CD19, CD20) | Negative (unless aberrant co-expression) |
"Because it can be difficult to distinguish myeloblasts and lymphoblasts morphologically, the diagnosis of AML is confirmed by performing stains for myeloid-specific antigens." - Robbins & Kumar Pathologic Basis of Disease
F. Cytogenetics - Karyotyping (GOLD STANDARD for classification and prognosis)
| Abnormality | Subtype | Prognosis |
|---|---|---|
| t(8;21) | AML-M2 (RUNX1::RUNX1T1) | Favorable |
| inv(16) / t(16;16) | AML-M4Eo (CBFB::MYH11) | Favorable |
| t(15;17) | APL/M3 (PML::RARα) | Very favorable (with ATRA) |
| t(11q23) - KMT2A | M4/M5 monocytic | Poor |
| -5/del(5q), -7 | Therapy-related AML | Very poor |
| Normal karyotype | AML-NOS | Intermediate |
| Complex karyotype (≥3 abnormalities) | Often TP53 mutated | Very poor |
G. Molecular/Genetic Testing
| Test | What it detects |
|---|---|
| FLT3-ITD / FLT3-TKD | Present in ~30% AML; adverse prognosis; guides targeted therapy (midostaurin, gilteritinib) |
| NPM1 mutation | ~30%; favorable if FLT3-ITD negative |
| CEBPA mutation | Biallelic = favorable prognosis |
| IDH1/IDH2 mutation | ~20%; targetable with ivosidenib/enasidenib |
| TP53 mutation | Very poor prognosis |
| RT-PCR for PML::RARα | Confirms APL; monitors MRD after therapy |
| FISH | Detects cryptic translocations |
| Next-generation sequencing (NGS) | Comprehensive mutation profiling |
H. Special Tests
| Test | Purpose |
|---|---|
| Coagulation screen (PT, APTT, fibrinogen, D-dimer) | Screen for DIC - especially critical in APL/M3 (high risk of fatal hemorrhage) |
| Serum uric acid | Elevated (cell turnover); risk of tumor lysis syndrome |
| Serum LDH | Elevated; marker of disease burden |
| Serum lysozyme (muramidase) | Markedly elevated in monocytic AML (M4/M5) - causes tubular nephropathy |
| CSF analysis | If CNS involvement suspected |
| HLA typing | Pre-transplant workup |
| Serum ferritin, LFTs, RFTs | Baseline organ function before chemotherapy |
Summary Table: Lab Diagnosis of AML
| Investigation | Key Finding |
|---|---|
| PBS | Blasts with/without Auer rods, anemia, thrombocytopenia |
| Bone marrow | ≥20% myeloblasts (hypercellular) |
| MPO cytochemistry | ≥3% blasts positive |
| NSE | Positive (monocytic M4/M5); inhibited by NaF |
| Flow cytometry | CD13+, CD33+, CD117+, HLA-DR+, MPO+ |
| Cytogenetics | t(15;17), t(8;21), inv(16), etc. |
| Molecular | FLT3, NPM1, IDH1/2, CEBPA mutations |
| LAP score | Low (same as CML - both ≠ leukemoid reaction) |
| Coagulation | DIC screen (critical in APL) |
- Robbins, Cotran & Kumar - Pathologic Basis of Disease (AML - Pathogenesis and Morphology, pp. 579-581)
- Henry's Clinical Diagnosis and Management by Laboratory Methods (AML laboratory investigations, Chapter 34)
- Tietz Textbook of Laboratory Medicine, 7th Edition (AML classification and cytogenetics, Chapter 70)
- Quick Compendium of Clinical Pathology, 5th Edition (AML FAB subtypes and immunophenotype)