

Solve
thin skin histology layers epidermis dermis diagram
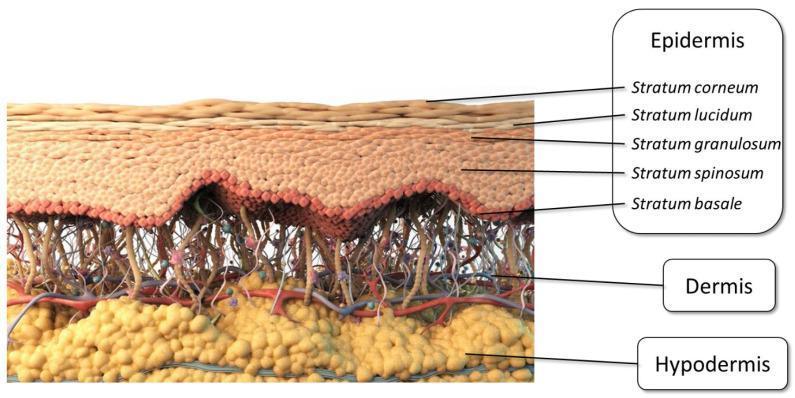
Anatomical diagram providing a detailed cross-sectional schematic of human skin layers, categorized into three primary regions: epidermis, dermis, and hypodermis. The epidermis is further subdivided into its five constituent layers, labeled from superficial to deep: stratum corneum (outermost barrier), stratum lucidum, stratum granulosum, stratum spinosum, and stratum basale (innermost germinative layer). The dermis is depicted with a complex network of connective tissue fibers, blood vessels (arterioles and venules), and neural elements. The hypodermis (subcutaneous layer) is shown at the base, characterized by yellow globular clusters representing adipose tissue. This illustration serves as an educational resource for understanding skin histology and is relevant to dermatology, pharmaceutics (specifically transdermal drug delivery), and clinical anatomy. The visual highlights the structural complexity of the skin barrier, particularly the dense stratum corneum which serves as the primary rate-limiting step for topical absorption.
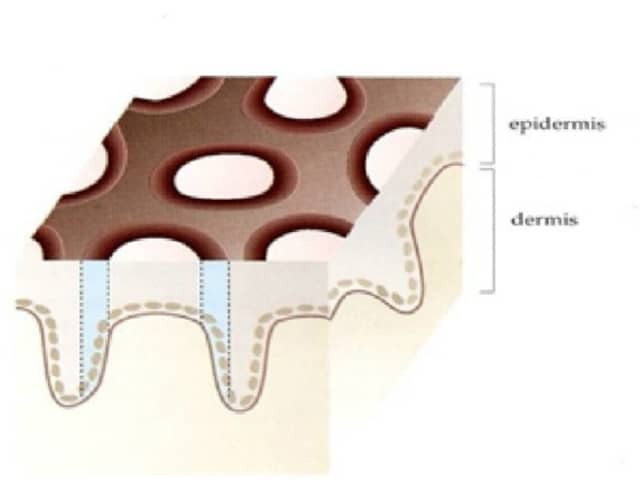
This image is a high-level educational illustration illustrating the layered structure of human skin. Modalities: schematic diagram; Anatomical location: integumentary system, cutaneous skin; The figure demonstrates the epidermis on the exterior and the underlying dermis, highlighting the epidermal-dermal junction and the wavy interface that forms dermal papillae. The epidermis is depicted as a stratified squamous epithelium with a pebbled appearance, while the dermis below shows connective tissue with dotted outlines suggesting collagen fibers and vascularized support. The cross-sectional perspective emphasizes tissue organization, basement membrane, and the boundary between the two layers. Although not a diagnostic imaging study, the depiction is valuable for education, illustrating normal architecture, cellular arrangement, and structural relationships that underlie wound healing and dermatopathology. This visualization assists learners to relate clinical features, biopsy findings, and histology slides, and it supports radiologic correlation in broader teaching contexts. It is particularly useful for medical students, residents, and allied health trainees seeking clear references for epidermal thickness, rete ridges, and dermal papillae; foundational for dermatology, pathology, and histology curricula. This description aids comparative anatomy studies, biopsy interpretation practice, and patient education resources by clarifying normal skin layering, junctional zones, and the relative depth of epidermal layers today.
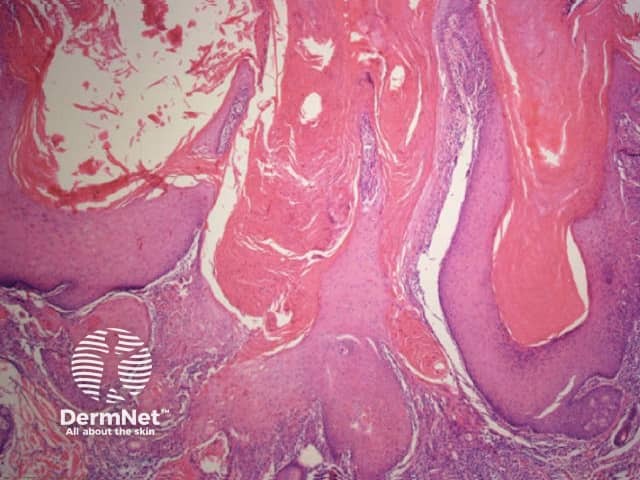
Histology image of human skin stained with Hematoxylin and Eosin (H&E) captured under light microscopy. The specimen presents a vertical cross‑section through cutaneous tissue, highlighting the epidermis overlying the dermis and extending into subcutaneous elements. The epidermal layers appear as a layered, basophilic stratum basale and strata spinosum and granulosum transitioning to a more eosinophilic stratum corneum; the dermoepidermal junction is visible as a wavy interface. The superficial dermis shows dense collagen fibers with a network of blood vessels and occasionally hair follicle–associated structures. Overall architecture resembles normal skin histology without evident dysplasia, neoplastic proliferation, or pronounced inflammatory infiltrate. The staining accentuates nuclei in blue (hematoxylin) and cytoplasmic and extracellular components in pink (eosin). This image is valuable as a reference for dermatopathology education, enabling learners to identify epidermal stratification, dermal connective tissue, adnexal structures, and the typical architecture of healthy skin. Clinically, it supports differential diagnosis consideration in cases of dermatitis, epidermal disorders, and cutaneous tumors by providing a baseline for comparison. It is suitable for medical students, residents, and researchers studying histology, dermatology, and pathology. This image also facilitates recognition of anatomical landmarks such as the epidermal-dermal junction and dermal papillae, supporting examination preparation and image-based teaching for residents and students.
bacteria growth curve phases lag exponential stationary death
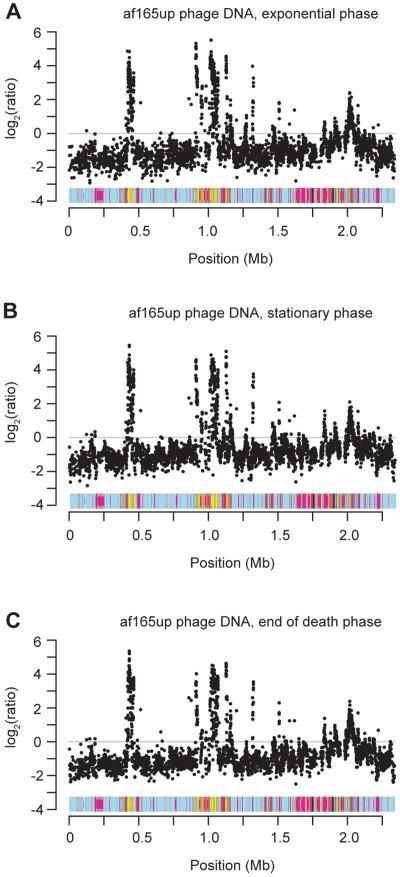
This Comparison Chart illustrates the results of microarray hybridization experiments comparing bacteriophage DNA to cellular DNA from Bartonella grahamii strain af165up across three growth phases: (A) exponential phase, (B) stationary phase, and (C) end of death phase. Each panel features a scatter plot where the x-axis represents the bacterial genome position in megabases (Mb), ranging from 0 to approximately 2.3 Mb. The y-axis indicates the log2 ratio of phage DNA to cellular DNA hybridization signals, ranging from -4 to 6. Below each x-axis is a color-coded genomic map identifying specific regions, including prophage loci. Across all phases, distinct signal peaks (log2 ratio between 4 and 6) are observed at approximately 0.4–0.5 Mb and 1.0–1.2 Mb, indicating significant over-representation of phage sequences at these sites regardless of growth stage. This visual data demonstrates that prophage induction and replication are consistent biological processes throughout the bacterial life cycle, even in viable exponential phase cells, supporting the understanding of horizontal gene transfer mechanisms in Bartonella species.
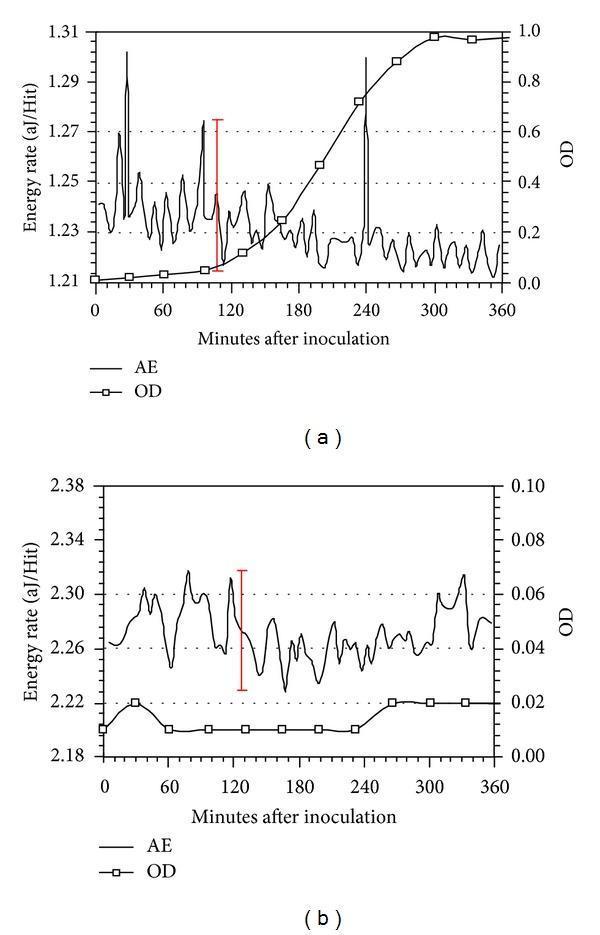
This figure presents two comparison charts, (a) and (b), depicting the growth kinetics and metabolic activity of Lactococcus lactis over 360 minutes. The primary metrics are Optical Density (OD), indicating bacterial concentration, and Energy Rate measured via Acoustic Emission (AE) in attojoules per hit (aJ/Hit). Graph (a) shows normal bacterial growth: the OD curve follows a characteristic sigmoidal pattern with lag, log, and stationary phases, while the AE data exhibits significant fluctuations and distinct peaks (e.g., around 108 and 240 minutes) representing metabolic energy release. Graph (b) demonstrates the effect of the metabolic inhibitor Sodium Azide (NaN3). In this panel, the OD remains near-baseline (indicating total inhibition of growth), and the AE signal shows only low-level background fluctuations without significant metabolic peaks. Red bars indicate ±3σ deviation standards for noise assessment. These graphs are utilized in microbiology and biomedical engineering to evaluate non-invasive methods for monitoring microbial activity and metabolic inhibition.
KATHMANDU UNIVERSITY - July 2025
Bachelor of Physiotherapy | Paper I | Full Solutions
SECTION "B" - Short Answer Questions
ANATOMY
Q1. Types of Cartilaginous Joints with Examples [2 marks]
- Bones are united by hyaline cartilage
- Usually temporary - ossifies with age
- Allows little or no movement
- Examples:
- Epiphyseal (growth) plates of long bones
- Spheno-occipital synchondrosis at the base of skull
- First sternocostal joint (permanent synchondrosis)
- Costochondral junctions
- Bones are united by fibrocartilage disc, supported by periarticular ligaments
- Slightly movable (amphiarthrodial)
- Examples:
- Pubic symphysis
- Intervertebral discs (between vertebral bodies)
- Manubriosternal joint
BIOCHEMISTRY
Q2. Define Carbohydrates and Classify with Examples [2 marks]
| Class | Description | Examples |
|---|---|---|
| Monosaccharides | Single sugar units; cannot be hydrolyzed further | Glucose, Fructose, Galactose, Ribose |
| Disaccharides | Two monosaccharide units joined by glycosidic bond | Sucrose (glucose + fructose), Lactose (glucose + galactose), Maltose (glucose + glucose) |
| Oligosaccharides | 3-10 monosaccharide units | Raffinose, Stachyose |
| Polysaccharides | >10 monosaccharide units; homopolysaccharides or heteropolysaccharides | Starch, Glycogen (homopolysaccharides); Heparin, Hyaluronic acid (heteropolysaccharides) |
Q3. Sources, Functions, and Deficiency Manifestations of Vitamin C [2 marks]
- Rich sources: Citrus fruits (lemons, limes, oranges), guava, amla (Indian gooseberry)
- Other sources: Berries, tomatoes, green leafy vegetables, capsicum, broccoli
- Animal sources: Liver, kidney (small amounts)
- Note: Destroyed by prolonged cooking/storage
- Collagen synthesis - required for hydroxylation of proline and lysine (cofactor for prolyl and lysyl hydroxylase)
- Antioxidant - protects against free radical damage
- Iron absorption - enhances non-heme iron absorption in the gut (reduces Fe³⁺ to Fe²⁺)
- Immune function - promotes leukocyte function
- Wound healing and bone formation
- Synthesis of carnitine, catecholamines, bile acids
- Perifollicular hemorrhages (earliest sign)
- Corkscrew hair
- Bleeding/swollen gums (gingivitis), loss of teeth
- Poor wound healing
- Subperiosteal hemorrhages (especially in children - "frog-leg" position)
- Anemia (due to impaired iron absorption)
- Woody leg (hardening due to hemorrhage)
- Hyperkeratosis of hair follicles
Q4. Define and Classify Neurotransmitters [2 marks]
- Amino Acids: Glutamate (excitatory), GABA, Glycine (inhibitory), Aspartate
- Biogenic Amines (Monoamines):
- Catecholamines: Dopamine, Norepinephrine, Epinephrine
- Indolamine: Serotonin (5-HT)
- Others: Histamine
- Acetylcholine - cholinergic neurotransmitter
- Neuropeptides: Substance P, Enkephalins, Endorphins, Dynorphin, Somatostatin
- Purines: Adenosine, ATP
- Gaseous: Nitric oxide (NO), Carbon monoxide (CO)
- Excitatory: Glutamate, Acetylcholine, Norepinephrine, Dopamine
- Inhibitory: GABA, Glycine, Serotonin (in some pathways)
MICROBIOLOGY
Q5. Differentiate between RNA and DNA Viruses [2 marks]
| Feature | DNA Viruses | RNA Viruses |
|---|---|---|
| Genetic material | Double-stranded DNA (mostly) | Single-stranded RNA (mostly) |
| Site of replication | Nucleus (mostly) | Cytoplasm (mostly) |
| Mutation rate | Low (DNA polymerase proofreading) | High (RNA polymerase lacks proofreading) |
| Size | Generally larger | Generally smaller |
| Stability | More stable | Less stable, more prone to variation |
| Enzyme used | DNA-dependent DNA polymerase | RNA-dependent RNA polymerase |
| Oncogenic potential | Several are oncogenic (HPV, EBV, HBV) | Some (HTLV-1, HCV) |
| Examples | Herpes viruses (HSV, CMV, EBV), HPV, Poxvirus, Adenovirus, HBV | HIV, Influenza, Measles, Rabies, Poliovirus, Hepatitis A, C, E, Dengue |
| Transformation | Insert DNA into host chromosome directly | Retroviruses use reverse transcriptase |
Q6. Explain Bacteria Growth Curve [2 marks]
- Bacteria adapt to the new environment
- No cell division; metabolic activity high
- Synthesis of enzymes, proteins, and cofactors
- Duration depends on age of inoculum and media composition
- Rapid cell division at maximum rate
- Constant generation time (doubling time)
- Bacteria are most susceptible to antibiotics in this phase
- Metabolically most active
- Growth rate equals death rate (net growth = zero)
- Nutrients depleted; toxic waste products accumulate
- Spore formation may begin
- Death rate exceeds growth rate
- Nutrients exhausted, toxic metabolites accumulated
- Exponential decrease in viable cells
Q7. Koch's Postulates + Define Sterilization [1+1 marks]
- The microorganism must be found in all cases of the disease
- The microorganism must be isolated from the diseased host and grown in pure culture
- The pure culture must cause disease when introduced into a healthy, susceptible host
- The same microorganism must be re-isolated from the experimentally diseased host
PATHOLOGY
Q8. Four Differences Between Benign and Malignant Tumors [2 marks]
| Feature | Benign Tumor | Malignant Tumor |
|---|---|---|
| Differentiation | Well differentiated; resembles tissue of origin | Poorly to undifferentiated; anaplastic |
| Growth rate | Slow; expansile | Rapid; infiltrative/invasive |
| Capsule | Usually encapsulated | Non-encapsulated, invades surrounding tissue |
| Metastasis | Does NOT metastasize | DOES metastasize (hallmark of malignancy) |
| Mitoses | Rare; normal | Frequent; atypical/abnormal mitoses |
| Recurrence | Rare after removal | Common after removal |
| Necrosis | Absent | Often present centrally |
| Prognosis | Usually favorable | Often serious/fatal |
Q9. Define Necrosis + Types of Necrosis with Examples [1+1 marks]
| Type | Morphology | Cause | Example |
|---|---|---|---|
| Coagulative | Tissue architecture preserved; ghost outlines of cells; firm texture | Ischemia in solid organs | Myocardial infarction, renal infarct |
| Liquefactive | Complete digestion → liquid, pus-filled cavity | Bacterial infection (neutrophil enzymes); ischemic brain | Brain abscess, ischemic stroke |
| Caseous | Cheese-like, friable white material; no tissue architecture | Granulomatous inflammation (TB) | Tuberculosis lymph node |
| Fat Necrosis | Chalky white deposits (saponification); calcium soaps | Lipase action (trauma/pancreatitis) | Acute pancreatitis, breast trauma |
| Fibrinoid | Amorphous pink fibrin-like deposits in vessel walls | Immune complexes, malignant hypertension | Autoimmune vasculitis, PAN |
| Gangrenous | Coagulative + superimposed infection | Limb ischemia with infection | Diabetic foot, wet/dry gangrene |
Q10. Pathophysiology of Edema [2 marks]
- Fluid moves OUT of capillaries at arterial end (hydrostatic pressure > oncotic pressure)
- Fluid returns INTO capillaries at venous end (oncotic pressure > hydrostatic pressure)
- Excess returned by lymphatics
| Mechanism | Pathology | Example |
|---|---|---|
| ↑ Hydrostatic pressure | Venous outflow obstruction; raised venous pressure forces fluid out | Cardiac failure, deep vein thrombosis |
| ↓ Plasma oncotic (colloid osmotic) pressure | Less albumin → less fluid drawn back | Nephrotic syndrome, liver cirrhosis, malnutrition |
| ↑ Vascular permeability | Inflammatory mediators (histamine, bradykinin) open tight junctions | Inflammation, burns, anaphylaxis |
| Lymphatic obstruction | Lymph cannot drain interstitial fluid | Filariasis (elephantiasis), post-mastectomy |
| Na⁺ and water retention | Renal retention of salt and water → increased blood volume | Renal failure, aldosteronism, cardiac failure (RAAS activation) |
PHARMACOLOGY
Q11. Factors Influencing Drug Absorption [2 marks]
- Lipid solubility - lipophilic drugs cross membranes easily
- Ionization (pKa) - unionized form is absorbed (Henderson-Hasselbalch equation): weak acids absorbed in stomach; weak bases in intestine
- Molecular weight - smaller molecules absorbed faster
- Formulation - solution > suspension > capsule > tablet > coated tablet
- Surface area - small intestine has largest SA (villi, microvilli)
- Blood flow - higher blood flow at absorption site = faster absorption
- GI motility - increased motility decreases absorption time
- pH of GI tract - affects ionization
- Presence of food - food may delay or reduce absorption (e.g., tetracyclines chelated by calcium)
- First-pass metabolism - hepatic metabolism before reaching systemic circulation (e.g., propranolol, morphine)
- Gut flora - can metabolize drugs
- IV > inhalation > sublingual > IM > SC > oral > rectal > transdermal
Q12. Define Agonist and Antagonist with Suitable Examples [2 marks]
- Full agonist: Produces maximum response (e.g., Morphine at opioid receptors, Salbutamol at β₂ receptors)
- Partial agonist: Binds and activates receptor but produces submaximal response even at full receptor occupancy (e.g., Buprenorphine at opioid receptors, Buspirone at 5-HT₁A)
- Inverse agonist: Binds receptor and produces opposite effect to agonist (e.g., beta-carboline at GABA-A receptor)
- Competitive antagonist (reversible): Competes with agonist; overcome by increasing agonist dose; shifts dose-response curve to right (e.g., Atropine at muscarinic receptors, Naloxone at opioid receptors)
- Non-competitive antagonist (irreversible): Binds irreversibly; reduces maximum response (e.g., Phenoxybenzamine at α receptors)
- Physiological antagonist: Two drugs act on different receptors with opposing effects (e.g., Insulin vs. Glucagon; Histamine vs. Adrenaline)
Q13. Classify Beta Blockers with Examples [2 marks]
| Type | Description | Examples |
|---|---|---|
| Non-selective (β₁ + β₂) | Block both β₁ and β₂ | Propranolol, Nadolol, Timolol, Sotalol, Pindolol |
| Cardioselective (β₁ selective) | Preferentially block β₁ (cardiac); less bronchoconstriction | Atenolol, Metoprolol, Acetbutolol, Bisoprolol, Esmolol ("AMABE") |
| β₁ + β₂ + α₁ blockers | Mixed alpha and beta blockade | Carvedilol, Labetalol |
- With ISA: Pindolol, Acebutolol, Oxprenolol (less bradycardia at rest)
- Without ISA: Propranolol, Atenolol, Metoprolol
- Membrane stabilizing: Propranolol
- Vasodilating: Carvedilol, Nebivolol (NO release)
Q14. Pharmacological Management of Organophosphorus Poisoning [2 marks]
- Muscarinic: Salivation, Lacrimation, Urination, Defecation, GI cramps, Emesis + Bradycardia, Bronchospasm, Miosis
- Nicotinic: Muscle fasciculations, weakness, paralysis
- CNS: Anxiety, seizures, coma
- Remove from exposure; remove contaminated clothing
- Secure airway, ensure ventilation
- Wash skin thoroughly
| Drug | Mechanism | Dose/Notes |
|---|---|---|
| Atropine (mainstay) | Competitive antagonist at muscarinic receptors | 2-4 mg IV, repeated every 5-10 min until secretions dry; no maximum dose. End point: dry secretions, clear chest |
| Pralidoxime (2-PAM) | Reactivates AChE by displacing OP from the enzyme | 30 mg/kg IV; must be given EARLY before "ageing" of OP-AChE bond (within 24-48 hrs). Acts on nicotinic effects (paralysis) |
| Diazepam/Benzodiazepines | Controls seizures; reduces CNS excitation | 10 mg IV for convulsions |
Key point: Atropine has no effect on nicotinic (muscle) symptoms. Pralidoxime is effective only before ageing occurs. After ageing, supportive care + dialysis needed.
PHYSIOLOGY
Q15. Explain Active Transport Across Membrane [2 marks]
- Moves solutes against electrochemical gradient
- Requires energy (ATP hydrolysis)
- Uses specific carrier proteins (pumps)
- Saturable, specific, inhibited by metabolic poisons
- Directly uses ATP hydrolysis
- Example: Na⁺/K⁺-ATPase pump
- Pumps 3 Na⁺ OUT and 2 K⁺ IN per ATP molecule
- Maintains resting membrane potential (-70 mV)
- Found in all body cells
- Other examples: Ca²⁺-ATPase (SERCA), H⁺/K⁺-ATPase (stomach parietal cells)
- Uses the electrochemical gradient created by primary transport (indirectly uses ATP)
- Co-transport (Symport): Both solutes move in the same direction
- Example: Na⁺-glucose co-transporter (SGLT) in intestinal epithelium; Na⁺-amino acid transport
- Counter-transport (Antiport): Solutes move in opposite directions
- Example: Na⁺/H⁺ exchanger (NHE) in kidneys and intestine
- Maintains cell volume and ionic composition
- Drives nutrient absorption (glucose, amino acids)
- Enables nerve impulse generation and conduction
- Drives secondary transport systems
SECTION "B" - Clinical Based Questions
Q16. Clinical Case - Anatomy [10 marks]
Q16a. Well-Labeled Diagram of Histological Features of Thin Skin [3 marks]
SURFACE (Exterior)
        |
┌───────────────────────────────────────┐
│  STRATUM CORNEUM                      │ ← Dead, anucleate squamous cells (keratin)
│  (Horny layer)                        │   Absent in thin skin: Stratum Lucidum
├───────────────────────────────────────┤
│  STRATUM GRANULOSUM                   │ ← Keratohyalin granules; cells dying
│  (Granular layer)                     │
├───────────────────────────────────────┤
│  STRATUM SPINOSUM                     │ ← Prickle cells; desmosomes; Langerhans cells
│  (Prickle cell layer)                 │
├───────────────────────────────────────┤
│  STRATUM BASALE                       │ ← Single layer; mitotic cells; melanocytes
│  (Basal layer / Germinative layer)    │   Merkel cells
├───────────────────────────────────────┤
│  BASEMENT MEMBRANE (Dermo-epidermal  │
│  junction)                            │
├───────────────────────────────────────┤
│  DERMIS (Papillary layer)             │ ← Loose CT; capillaries; nerve endings
│     - Dermal papillae                 │
│     - Meissner's corpuscles           │
├───────────────────────────────────────┤
│  DERMIS (Reticular layer)             │ ← Dense irregular CT; collagen/elastin
│     - Hair follicles                  │   Pacinian corpuscles; sebaceous glands
│     - Sweat glands                    │
│     - Arrector pili muscle            │
└───────────────────────────────────────┘
│  HYPODERMIS / SUBCUTANEOUS LAYER      │ ← Adipose tissue; large blood vessels
- Thin skin: 4 layers (NO stratum lucidum), thinner stratum corneum, HAS hair follicles
- Thick skin (palms/soles): 5 layers (HAS stratum lucidum), no hair follicles
Q16b. Short Notes on Appendages of Skin [2 marks]
- Present in thin skin; absent in palms, soles, lips
- Hair shaft = dead keratinized cells produced by matrix cells at the hair bulb
- Parts: hair shaft, hair root, hair bulb, dermal papilla
- Associated with arrector pili muscle (smooth muscle causing "goosebumps")
- Function: Thermal insulation, protection, sensation
- Holocrine glands (entire cell disintegrates to release secretion)
- Open into hair follicle (pilosebaceous unit)
- Absent in palms and soles
- Produce sebum (lipid mixture): lubricates and waterproofs skin; has bactericidal/antifungal properties
- Stimulated by androgens (active at puberty)
- Dysfunction: acne vulgaris
- Eccrine (merocrine): Found all over body; most numerous on palms, soles, forehead; simple coiled tubular; secrete watery sweat for thermoregulation; open directly onto skin surface
- Apocrine: Located in axilla, groin, areola; open into hair follicle; secretion initially odorless but metabolized by bacteria → body odor; functional at puberty; modified apocrine glands = ceruminous glands (ear), mammary glands
- Plates of hard keratin on dorsal surface of terminal phalanges
- Parts: nail plate, nail bed, nail root (matrix), lunula, eponychium (cuticle), hyponychium
- Function: Protect fingertips, assist fine grip
- Accessory reproductive glands; function in lactation
Summary Table - All Questions at a Glance
| Q# | Topic | Key Points |
|---|---|---|
| 1 | Cartilaginous joints | Synchondrosis (hyaline) + Symphysis (fibrocartilage) |
| 2 | Carbohydrates | Mono-, Di-, Oligo-, Polysaccharides |
| 3 | Vitamin C | Citrus fruits; collagen synthesis; Scurvy |
| 4 | Neurotransmitters | Amino acids, Biogenic amines, ACh, Neuropeptides, Gaseous |
| 5 | RNA vs DNA viruses | Stability, mutation rate, replication site, examples |
| 6 | Bacterial growth curve | Lag, Log, Stationary, Decline phases |
| 7 | Koch's postulates + Sterilization | 4 postulates; complete destruction of ALL microbes |
| 8 | Benign vs Malignant | Encapsulation, metastasis, differentiation, mitoses |
| 9 | Necrosis | Coagulative, Liquefactive, Caseous, Fat, Fibrinoid |
| 10 | Edema pathophysiology | ↑Hydrostatic, ↓Oncotic, ↑Permeability, Lymphatic block, Na retention |
| 11 | Drug absorption | Lipid solubility, pKa, surface area, blood flow, first-pass effect |
| 12 | Agonist/Antagonist | Affinity + efficacy vs affinity only; examples |
| 13 | Beta blockers | Non-selective, Cardioselective (AMABE), Mixed α+β |
| 14 | OP poisoning | Atropine (muscarinic) + Pralidoxime (reactivate AChE) + Diazepam |
| 15 | Active transport | Primary (Na/K pump) + Secondary (co/counter-transport) |
| 16a | Thin skin histology | 4 layers; detailed labeled diagram |
| 16b | Skin appendages | Hair, Sebaceous glands, Sweat glands, Nails, Mammary glands |
All answers are based on standard medical textbooks (Robbins Pathology, Guyton & Hall Physiology, Jawetz Microbiology, Goodman & Gilman Pharmacology). Good luck with your exam!