Excellent! I now have very comprehensive content from both Guyton & Hall and Harrison's. I have enough to write a thorough, well-organized ECG explanation. Let me now compose the full answer.
Electrocardiogram (ECG) - A Complete Guide
An electrocardiogram (ECG or EKG) is a graphical recording of the electrical activity generated by the heart. When a cardiac impulse passes through the heart, small electrical currents spread into the surrounding tissues and reach the skin surface. Electrodes placed on the skin detect these potentials, which are amplified and recorded by the electrocardiograph device.
- Guyton and Hall Textbook of Medical Physiology, p. 142
- Harrison's Principles of Internal Medicine 22E, Chapter 247
1. The Cardiac Conduction System - The Basis of the ECG
Before understanding the ECG, you must understand what generates the electrical signals it records.
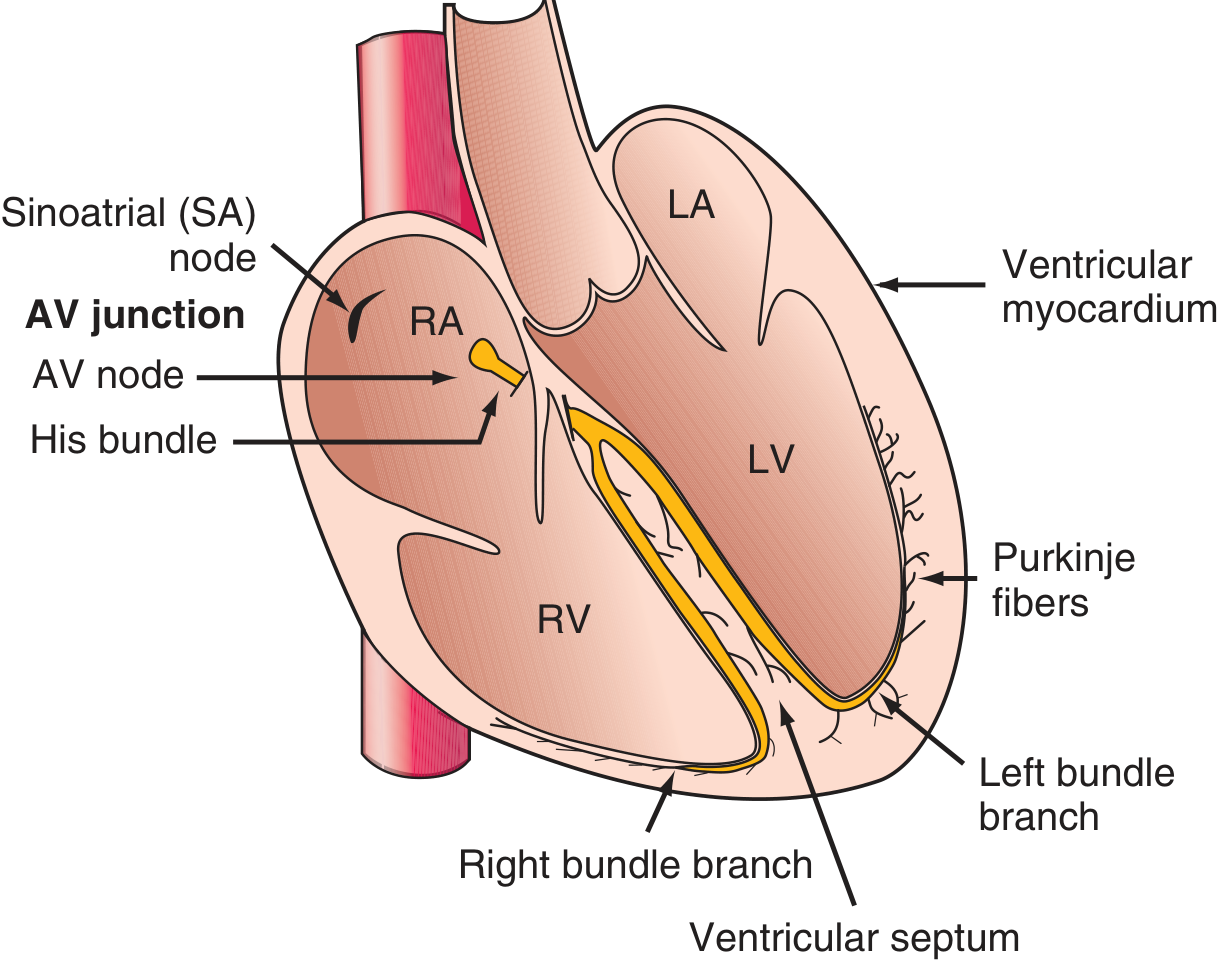
The normal heartbeat originates in the sinoatrial (SA) node, located in the right atrium. It has spontaneous automaticity (self-excitation). The sequence of conduction:
- SA Node fires → depolarizes both atria (generates the P wave)
- AV Node - the impulse slows here (physiologic delay = the PR interval)
- Bundle of His - a single trunk that bifurcates into:
- Right bundle branch (to right ventricle)
- Left bundle branch (divides into left anterior and left posterior fascicles)
- Purkinje fibers - rapidly conduct impulse to ventricular myocardium (endocardium to epicardium)
- Ventricular myocardium contracts (generates the QRS complex)
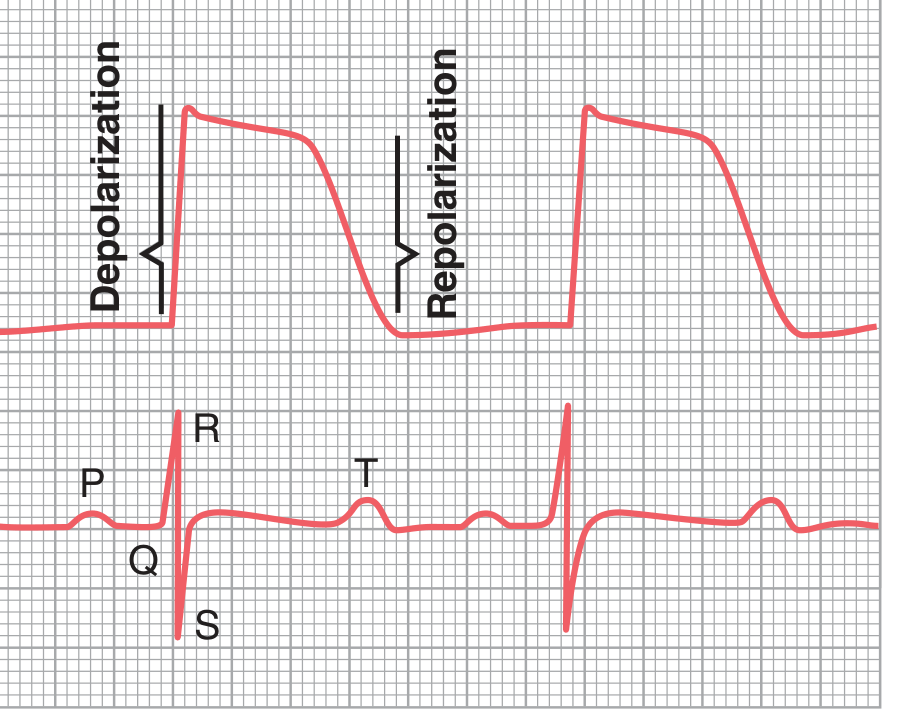
- Repolarization of ventricles (generates the T wave)
The ECG records only the depolarization and repolarization of the working atrial and ventricular myocardium. It does NOT directly record impulse generation in the SA node, AV node, or His-Purkinje system because their currents are too small.
2. The Normal ECG Waveform
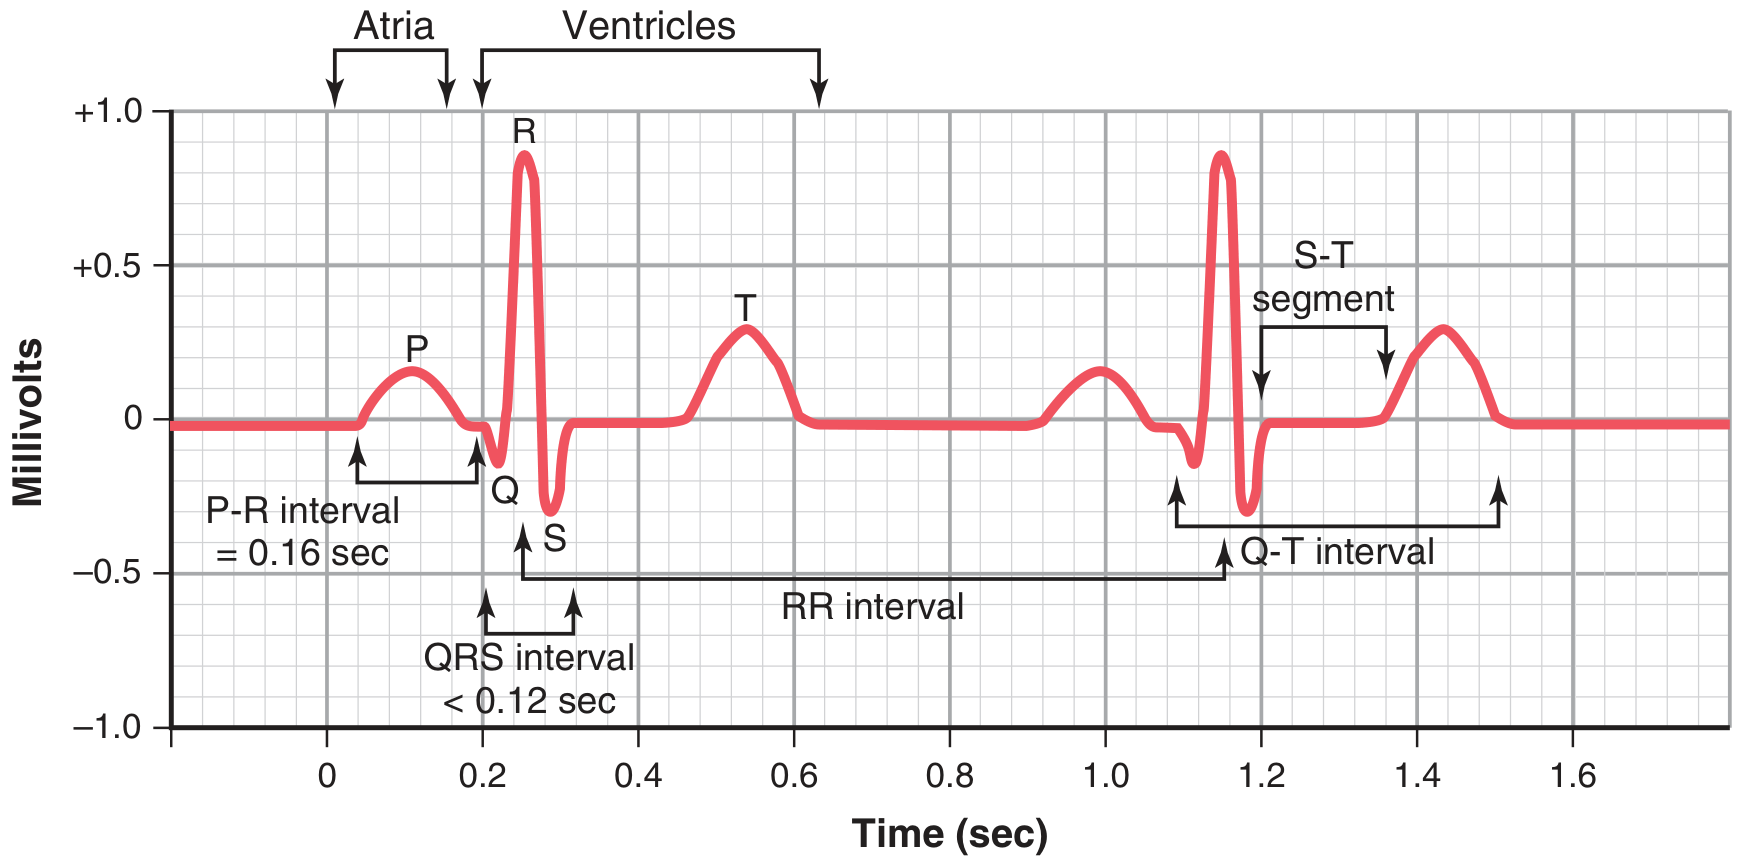
The normal ECG has these main components:
P Wave
- Origin: Atrial depolarization
- Shape: Small, rounded, upright in leads I, II, aVF
- Duration: < 0.12 sec (120 ms)
- Amplitude: < 2.5 mm in limb leads, < 1.5 mm in precordial leads
- Represents the spread of the electrical impulse from the SA node across both atria
- Clinical note: Absent in atrial fibrillation; inverted in junctional rhythms
PR Interval
- Origin: Measured from onset of P wave to onset of QRS
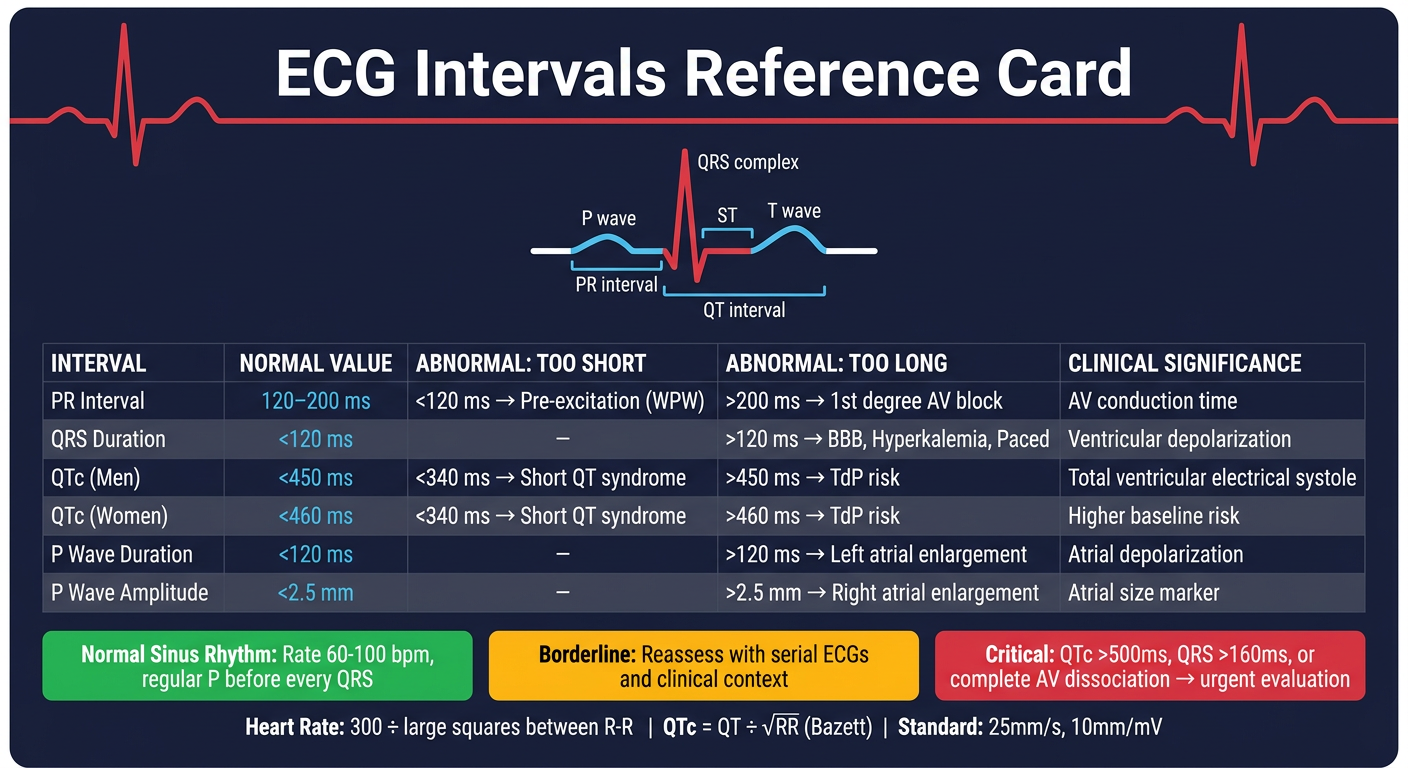
- Normal duration: 120-200 ms (0.12-0.20 sec)
- Represents the time of AV conduction including the physiologic delay at the AV node
- Prolonged PR = first-degree AV block
- Shortened PR = pre-excitation (e.g., Wolff-Parkinson-White syndrome)
QRS Complex
- Origin: Ventricular depolarization
- Normal duration: 100-110 ms or less (< 0.12 sec)
- Three components:
- Q wave: First downward deflection before R; small normal Q waves from septal depolarization
- R wave: First upward deflection; largest component
- S wave: Downward deflection after R wave
- Widened QRS (> 120 ms): Bundle branch block, ventricular pacemaker, hyperkalemia, preexcitation
- Pathological Q waves: Wide (> 40 ms) or deep (> 25% of R wave height) Q waves suggest prior myocardial infarction
ST Segment
- Origin: Isoelectric period between end of QRS and start of T wave (corresponds to action potential plateau, Phase 2)
- J point: Junction between QRS end and ST segment start
- Normal: Isoelectric (flat at baseline)
- ST elevation: Transmural ischemia/infarction, pericarditis, Brugada syndrome, early repolarization
- ST depression: Subendocardial ischemia, digoxin effect, reciprocal changes
T Wave
- Origin: Ventricular repolarization (Phase 3 of action potential)
- Shape: Asymmetric, gradually ascending then sharply descending
- Polarity: Normally upright in leads I, II, V3-V6; inverted in aVR
- Duration: 0.25-0.35 sec after ventricular depolarization
- The T wave is a repolarization wave
- T wave inversions: Ischemia, bundle branch block, ventricular hypertrophy, PE (V1-V4), raised intracranial pressure
U Wave
- Origin: Possibly repolarization of Purkinje fibers or "after-depolarizations"
- Small, positive deflection after T wave (best seen in V2-V3)
- Prominent U waves: Hypokalemia, bradycardia, drugs (quinidine, sotalol)
QT Interval
- Origin: Measured from onset of QRS to end of T wave; represents total ventricular electrical systole (depolarization + repolarization)
- Normal: Varies with heart rate; QTc (corrected) < 460 ms in women, < 450 ms in men
- QTc formula (Bazett): QTc = QT / √RR (in seconds)
- Prolonged QT: Drugs (amiodarone, sotalol, macrolides, antipsychotics), electrolyte disturbances (hypokalemia, hypomagnesemia, hypocalcemia), congenital long QT syndromes - risk of torsades de pointes
- Short QT: Hypercalcemia, digoxin toxicity, congenital short QT syndrome
RR Interval
- Distance between two consecutive R waves; used to calculate heart rate
- Heart rate = 300 / number of large squares between R waves (at 25 mm/s)
- Or: Heart rate = 1500 / number of small squares between R waves
3. The 12-Lead ECG System
The standard 12-lead ECG provides 12 different "views" of cardiac electrical activity from different angles.
Limb Leads (Frontal Plane - 6 leads)
Standard Bipolar Limb Leads (Einthoven's triangle):
| Lead | Positive electrode | Negative electrode | Axis |
|---|
| Lead I | Left arm | Right arm | 0° |
| Lead II | Left leg | Right arm | +60° |
| Lead III | Left leg | Left arm | +120° |
Einthoven's Law: Lead II = Lead I + Lead III (at any instant)
Augmented Unipolar Limb Leads:
| Lead | Positive electrode | Views |
|---|
| aVR | Right arm | Cavity (right shoulder) |
| aVL | Left arm | Left shoulder |
| aVF | Left foot/leg | Inferior (diaphragmatic) surface |
- aVR normally shows a negative (inverted) QRS because the mean cardiac vector points away from the right arm
- Leads II, III, aVF: "Inferior leads" - look at the inferior wall of left ventricle (RCA territory)
- Leads I, aVL: "Lateral leads" - lateral wall
Precordial (Chest) Leads (Horizontal Plane - 6 leads)
Placed across the chest to view the heart in the horizontal plane:
| Lead | Placement | Views |
|---|
| V1 | 4th intercostal space, right sternal border | Right ventricle / septal |
| V2 | 4th intercostal space, left sternal border | Septal |
| V3 | Between V2 and V4 | Anterior |
| V4 | 5th intercostal space, midclavicular line | Anterior |
| V5 | Anterior axillary line | Lateral |
| V6 | Midaxillary line | Lateral |
- V1-V2: Right heart and septum; QRS mainly negative (depolarization wave moves away from base)
- V4-V6: Left heart; QRS mainly positive (depolarization moves toward apex)
- R-wave progression: R wave gradually increases in amplitude from V1 to V5/V6. The transition zone (where R = S) is normally at V3-V4
Additional Leads
- Right-sided leads (V3R, V4R): Used to detect right ventricular infarction (especially in inferior STEMI)
- Posterior leads (V7-V9): Used to detect posterior MI (tall R in V1-V2 is reciprocal change)
4. ECG Paper and Calibration
The ECG is recorded on graph paper:
- Horizontal axis = Time: 1 small box = 1 mm = 40 ms (0.04 sec); 1 large box = 5 mm = 200 ms (0.20 sec) at standard paper speed of 25 mm/s
- Vertical axis = Voltage (amplitude): 1 mm = 0.1 mV; standard calibration = 10 mm = 1 mV
- Always check the calibration marker (1 mV = 10 mm box at start of trace)
5. Calculating Heart Rate
- Regular rhythm: 300 ÷ (number of large squares between R-R) = BPM
- 1 large box between R waves = 300 bpm
- 2 large boxes = 150 bpm
- 3 = 100, 4 = 75, 5 = 60, 6 = 50 bpm
- Irregular rhythm: Count QRS complexes in a 10-second strip × 6
6. The Electrical Axis
The mean QRS axis represents the average direction of ventricular depolarization in the frontal plane.
| Axis | Degrees |
|---|
| Normal | -30° to +90° |
| Left axis deviation (LAD) | More negative than -30° |
| Right axis deviation (RAD) | More positive than +90° |
| Extreme axis deviation | -90° to ±180° |
Quick method - use leads I and aVF:
- Both positive → Normal axis
- Lead I positive, aVF negative → LAD (check lead II; if negative, LAD confirmed)
- Lead I negative, aVF positive → RAD
- Both negative → Extreme axis deviation ("no man's land")
Causes of LAD: Left ventricular hypertrophy (LVH), left anterior fascicular block, inferior MI, LBBB
Causes of RAD: Right ventricular hypertrophy (RVH), left posterior fascicular block, lateral MI, RBBB, pulmonary embolism, dextrocardia
7. Systematic ECG Interpretation (The Step-by-Step Approach)
Harrison's recommends a systematic 14-step approach for clinical ECG interpretation:
- Rate - Bradycardia (< 60) vs tachycardia (> 100)
- Rhythm - Regular or irregular? Sinus vs non-sinus
- PR interval - Normal, short, or long?
- QRS duration - Narrow (< 120 ms) or wide (> 120 ms)?
- QT/QTc - Prolonged or short?
- Mean QRS electrical axis - Normal, LAD, or RAD?
- P waves - Present, morphology, relation to QRS?
- QRS voltages - Low (< 5 mm in limb leads) or high?
- Precordial R-wave progression - Normal transition zone?
- Abnormal Q waves - Pathological?
- ST segments - Elevation or depression?
- T waves - Normal, inverted, peaked?
- U waves - Prominent?
- Compare with previous ECGs whenever available
8. Hypertrophy Patterns
Left Ventricular Hypertrophy (LVH)
Voltage criteria (Sokolow-Lyon): S in V1 + R in V5 or V6 > 35 mm (or > 3.5 mV)
- Associated with: ST depression, T wave inversion in lateral leads ("strain" pattern)
- Causes: Hypertension, aortic stenosis, hypertrophic cardiomyopathy
Right Ventricular Hypertrophy (RVH)
- Dominant R wave in V1 (R > S in V1)
- Right axis deviation
- T wave inversion V1-V3
- Causes: Pulmonary hypertension, pulmonary stenosis, cor pulmonale
Left Atrial Enlargement (P mitrale)
- Broad, bifid (notched) P wave in lead II (> 120 ms)
- Biphasic P wave in V1 with prominent negative terminal component
Right Atrial Enlargement (P pulmonale)
- Tall, peaked P wave in lead II (> 2.5 mm)
- Causes: COPD, tricuspid valve disease, pulmonary hypertension
9. Bundle Branch Blocks
Right Bundle Branch Block (RBBB)
- QRS > 120 ms
- rSR' ("M" or "rabbit ears") pattern in V1-V2
- Wide S wave in leads I, V5, V6
- T wave inversion in V1-V2 (secondary repolarization change)
- Causes: Normal variant, right heart strain, congenital heart disease, anterior MI
Left Bundle Branch Block (LBBB)
- QRS > 120 ms
- Broad, notched R wave in lateral leads (I, aVL, V5-V6) - "M" shape
- rS or QS pattern in V1-V2
- T wave opposite to the main QRS deflection (discordant)
- In LBBB, standard ischemia criteria are unreliable (Sgarbossa criteria used instead)
- Causes: Ischemic heart disease, hypertension, cardiomyopathy, aortic stenosis
Fascicular Blocks (Hemiblocks)
- Left anterior fascicular block (LAFB): QRS < 120 ms, marked LAD (axis more negative than -45°), small Q in I/aVL, small R in II/III/aVF - most common cause of marked LAD in adults
- Left posterior fascicular block (LPFB): RAD (axis > +110°), rare as isolated finding
10. Ischemia and Infarction
Evolution of STEMI (ST-Elevation Myocardial Infarction)
| Time | ECG Changes |
|---|
| Minutes (hyperacute) | Tall, peaked "hyperacute" T waves |
| Hours | ST segment elevation, reciprocal ST depression in opposite leads |
| 6-24 hours | Q waves begin to form, T wave inversion |
| Days-weeks | Q waves persist, ST normalizes, T waves may stay inverted |
| Months | Q waves may persist permanently |
Localizing the Infarct
| Leads with changes | Territory | Artery |
|---|
| II, III, aVF | Inferior wall | RCA (85%) or LCx (15%) |
| V1-V4 | Anterior wall | LAD |
| V1-V2 + right-sided leads | Septal / RV | Proximal RCA |
| I, aVL, V5-V6 | Lateral wall | LCx |
| Tall R in V1-V2 (reciprocal) | Posterior wall | RCA or LCx |
NSTEMI / Unstable Angina
- ST depression (subendocardial ischemia - ST vector points toward the cavity)
- T wave inversions without ST elevation
- No Q waves
Wellens Syndrome
- Deep, symmetric T wave inversions in V1-V4 (often with preserved R waves)
- Indicates critical stenosis of the proximal LAD
- Called the "Wellens T wave sign"
11. Common Arrhythmias and their ECG Patterns
Sinus Arrhythmias
- Sinus tachycardia: Rate > 100, P before every QRS, normal P morphology
- Sinus bradycardia: Rate < 60, otherwise normal
- Sinus arrhythmia: Irregular variation in R-R interval with breathing (normal in young people)
Atrial Arrhythmias
- Atrial fibrillation (AF): No discrete P waves, irregularly irregular R-R intervals, fibrillatory baseline
- Atrial flutter: Sawtooth flutter waves at 300/min (usually 2:1, 3:1 or 4:1 block), regular or regularly irregular rate
- SVT (AVNRT/AVRT): Narrow QRS tachycardia, rate 150-250/min, P waves often buried in or just after QRS
AV Blocks
| Type | ECG features |
|---|
| First-degree AV block | PR > 200 ms; all P waves conduct |
| Second-degree, Mobitz I (Wenckebach) | Progressively lengthening PR until a QRS drops |
| Second-degree, Mobitz II | Constant PR with sudden dropped QRS (more serious) |
| Third-degree (complete) AV block | Complete AV dissociation - P waves and QRS have no relationship; escape rhythm |
Ventricular Arrhythmias
- PVCs (premature ventricular contractions): Wide QRS, no preceding P wave, compensatory pause
- Ventricular tachycardia (VT): Wide QRS tachycardia (> 120 ms), rate > 100, AV dissociation (independent P waves)
- Ventricular fibrillation (VF): Chaotic, irregular waveforms with no identifiable QRS - cardiac emergency
- Torsades de pointes: Polymorphic VT with "twisting" QRS axis around the isoelectric line; associated with prolonged QT
12. ECG Changes in Electrolyte Disturbances
| Disturbance | Key ECG Changes |
|---|
| Hypokalemia | Flattened/inverted T waves, prominent U waves, ST depression, prolonged QU interval |
| Hyperkalemia | Peaked T waves → widened QRS → loss of P waves → sine wave → VF |
| Hypocalcemia | Prolonged QT (prolonged ST segment) |
| Hypercalcemia | Shortened QT interval |
| Hypomagnesemia | Similar to hypokalemia; also predisposes to torsades |
13. ECG in Special Conditions
Pericarditis
- Diffuse (saddle-shaped) ST elevation in multiple leads (not just one territory)
- PR depression (especially in lead II)
- No reciprocal ST changes (except aVR and V1)
Pulmonary Embolism (PE)
- Sinus tachycardia (most common)
- Classic but rare: S1Q3T3 (deep S in lead I, Q wave and T inversion in lead III)
- New RBBB
- T wave inversions V1-V4
- Right axis deviation
Digoxin Effect
- "Reverse tick" or "Salvador Dali moustache" ST depression (scooped ST)
- Shortened QT interval
- Flattened/inverted T waves
Digoxin Toxicity
- Any arrhythmia, especially: PAT with block, bidirectional VT, junctional tachycardia
Hypothermia
- Osborn wave (J wave): Distinctive convex hump at the J point
- QRS and QT prolongation
- Sinus bradycardia
WPW (Wolff-Parkinson-White)
- Short PR interval (< 120 ms)
- Delta wave (slurred upstroke of QRS)
- Wide QRS
- Secondary ST-T changes
- Mechanism: Pre-excitation via accessory pathway (Bundle of Kent)
Brugada Pattern
- Right bundle branch block morphology
- ST elevation in V1-V2 (coved or saddle-back pattern)
- Associated with sudden cardiac death risk, especially in young Asian males
Long QT Syndrome
- QTc > 460 ms (women) or > 450 ms (men)
- Risk of torsades de pointes and sudden cardiac death
- Congenital (LQT1, LQT2, LQT3) or acquired (drugs, electrolytes)
14. Ambulatory ECG Monitoring
Standard ECGs record only a brief snapshot. For transient arrhythmias, extended monitoring is used:
- Holter monitor: Continuous 24-48 hour recording during normal daily activities
- Event recorder: Patient-activated, worn for weeks; records when symptoms occur
- Implantable loop recorder (ILR): Subcutaneous device, can monitor for up to 3 years
- Indications: Unexplained syncope, palpitations, cryptogenic stroke (to detect paroxysmal AF), monitoring after antiarrhythmic therapy
15. Limitations of the ECG
- A normal ECG does not exclude ischemia or even acute infarction
- LBBB makes ischemia diagnosis unreliable on standard criteria
- A single ECG is a snapshot - serial ECGs are important
- Sensitivity and specificity limitations in diagnosing both acute and chronic ischemic heart disease
- ECG cannot directly measure mechanical function (echocardiography needed for that)
Summary Table: Key Normal Values
| Parameter | Normal Range |
|---|
| Heart rate | 60-100 bpm |
| PR interval | 120-200 ms |
| QRS duration | < 120 ms (ideally < 110 ms) |
| QTc (men) | < 450 ms |
| QTc (women) | < 460 ms |
| P wave duration | < 120 ms |
| P wave amplitude (limb) | < 2.5 mm |
| QRS axis | -30° to +90° |
| R-wave progression | Transition at V3-V4 |
Sources:
- Guyton and Hall Textbook of Medical Physiology, Chapters 11-12 (Fundamentals of Electrocardiography, Cardiac Arrhythmias)
- Harrison's Principles of Internal Medicine 22E (2025), Chapter 247 (Electrocardiography)
- Goldman-Cecil Medicine, Chapter on Conduction Abnormalities and Axis Deviation
- Medical Physiology (Boron & Boulpaep), Chapter on Cardiac Electrophysiology