Why chills occurs in fever

Reading File
Finding Sources
Finding Sources
Finding Sources
Finding Sources
Reading File
Reading File
Reading File
Reading File
Searching Images

fever pathogenesis pyrogens hypothalamus set point chills shivering diagram
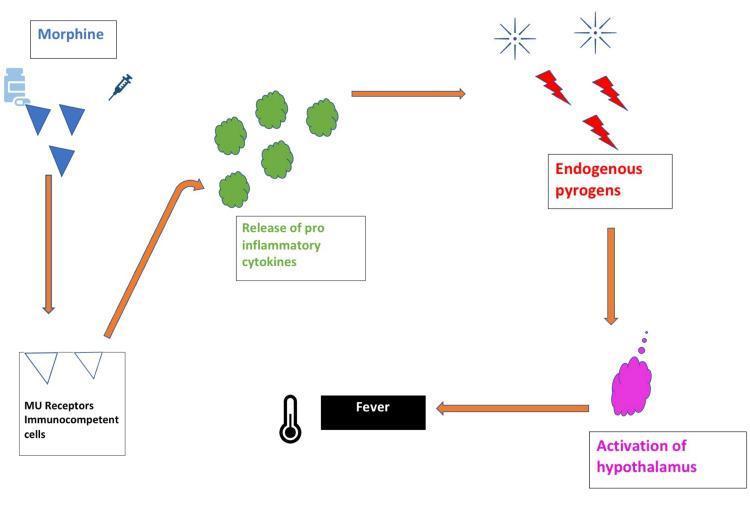
This pathophysiology diagram illustrates the biological mechanism of opioid-induced fever. The pathway is depicted as a series of steps connected by orange directional arrows. It begins with morphine (represented by blue triangles, a pill bottle, and a syringe icon) binding to Mu (μ) receptors on immunocompetent cells. This interaction triggers the release of pro-inflammatory cytokines, visualized as green spherical clusters. These cytokines promote the production of endogenous pyrogens, depicted by red lightning bolts and sunburst icons. The pyrogens act upon the central nervous system, specifically leading to the activation of the hypothalamus (shown as a purple anatomical cloud). The final physiological outcome is fever, symbolized by a black box labeled 'Fever' and a clinical thermometer icon. This schematic is designed for medical education to explain the rare adverse effect where opioids bypass typical thermoregulation to induce a febrile state via immune system mediation.
This pathophysiology diagram illustrates the biological mechanism of opioid-induced fever. The pathway is depicted as a series of steps connected by orange directional arrows. It begins with morphine (represented by blue triangles, a pill bottle, and a syringe icon) binding to Mu (μ) receptors on immunocompetent cells. This interaction triggers the release of pro-inflammatory cytokines, visualized as green spherical clusters. These cytokines promote the production of endogenous pyrogens, depicted by red lightning bolts and sunburst icons. The pyrogens act upon the central nervous system, specifically leading to the activation of the hypothalamus (shown as a purple anatomical cloud). The final physiological outcome is fever, symbolized by a black box labeled 'Fever' and a clinical thermometer icon. This schematic is designed for medical education to explain the rare adverse effect where opioids bypass typical thermoregulation to induce a febrile state via immune system mediation.

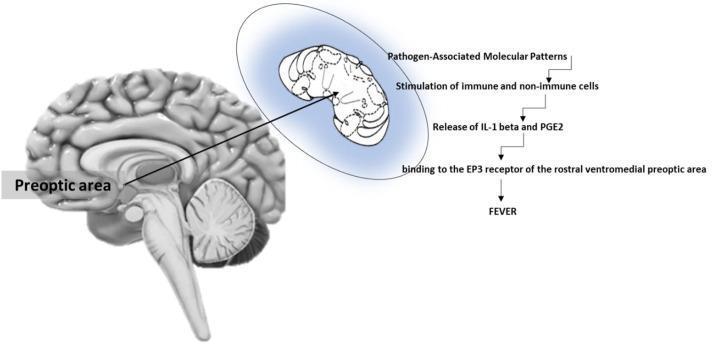
This medical illustration depicts the pathophysiology of fever induction at the brain level. On the left, a sagittal view of the human brain identifies the preoptic area (POA) within the hypothalamus, positioned anterior to the brainstem. An inset zoom highlights the rostral ventromedial preoptic area (rvmPOA) as the specific target for pyrogenic mediators. To the right, a sequential flowchart outlines the molecular mechanism: 1) Exposure to Pathogen-Associated Molecular Patterns (PAMPs); 2) Stimulation of immune and non-immune cells; 3) Release of pro-inflammatory cytokines, specifically Interleukin-1 beta (IL-1 beta), and Prostaglandin E2 (PGE2); 4) Binding of PGE2 to EP3 receptors in the rvmPOA. This signaling cascade leads to the clinical manifestation of fever. The diagram serves as an educational summary of the endocrine and neural pathways involved in thermoregulation and the systemic inflammatory response, highlighting the critical role of the hypothalamus and EP3 receptor signaling in pyrogenesis.
This medical illustration depicts the pathophysiology of fever induction at the brain level. On the left, a sagittal view of the human brain identifies the preoptic area (POA) within the hypothalamus, positioned anterior to the brainstem. An inset zoom highlights the rostral ventromedial preoptic area (rvmPOA) as the specific target for pyrogenic mediators. To the right, a sequential flowchart outlines the molecular mechanism: 1) Exposure to Pathogen-Associated Molecular Patterns (PAMPs); 2) Stimulation of immune and non-immune cells; 3) Release of pro-inflammatory cytokines, specifically Interleukin-1 beta (IL-1 beta), and Prostaglandin E2 (PGE2); 4) Binding of PGE2 to EP3 receptors in the rvmPOA. This signaling cascade leads to the clinical manifestation of fever. The diagram serves as an educational summary of the endocrine and neural pathways involved in thermoregulation and the systemic inflammatory response, highlighting the critical role of the hypothalamus and EP3 receptor signaling in pyrogenesis.

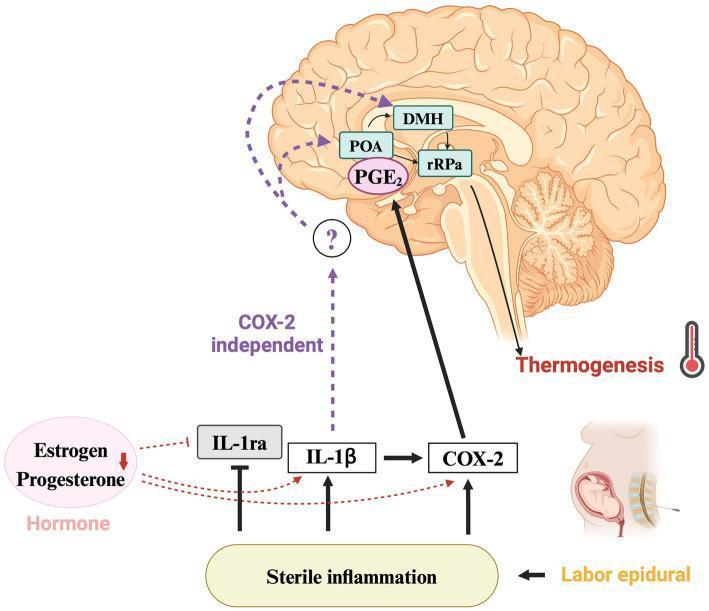
This pathophysiology diagram illustrates the thermoregulatory pathway implicated in epidural-related maternal fever (ERMF). The visual is divided into a molecular/hormonal section and a neuroanatomical section within a midsagittal view of the human brain. The lower portion depicts that 'Labor epidural' triggers 'Sterile inflammation,' which increases levels of IL-1̠ and COX-2 while suppressing the anti-inflammatory cytokine IL-1ra. Simultaneously, declining levels of estrogen and progesterone further inhibit IL-1ra and promote IL-1̠ and COX-2 expression. In the neuroanatomical section, the pathway shows PGE2 acting upon the preoptic area (POA), which then signals the dorsomedial hypothalamus (DMH). The DMH projects to the rostral raphe pallidus (rRPa) in the brainstem, ultimately leading to thermogenesis. A dashed line representing a COX-2 independent pathway from IL-1̠ to the hypothalamus is marked with a question mark, indicating a mechanism under investigation. This diagram serves as an educational tool for understanding the endocrine and immunological modulation of the central nervous system's febrile response during childbirth.
This pathophysiology diagram illustrates the thermoregulatory pathway implicated in epidural-related maternal fever (ERMF). The visual is divided into a molecular/hormonal section and a neuroanatomical section within a midsagittal view of the human brain. The lower portion depicts that 'Labor epidural' triggers 'Sterile inflammation,' which increases levels of IL-1̠ and COX-2 while suppressing the anti-inflammatory cytokine IL-1ra. Simultaneously, declining levels of estrogen and progesterone further inhibit IL-1ra and promote IL-1̠ and COX-2 expression. In the neuroanatomical section, the pathway shows PGE2 acting upon the preoptic area (POA), which then signals the dorsomedial hypothalamus (DMH). The DMH projects to the rostral raphe pallidus (rRPa) in the brainstem, ultimately leading to thermogenesis. A dashed line representing a COX-2 independent pathway from IL-1̠ to the hypothalamus is marked with a question mark, indicating a mechanism under investigation. This diagram serves as an educational tool for understanding the endocrine and immunological modulation of the central nervous system's febrile response during childbirth.

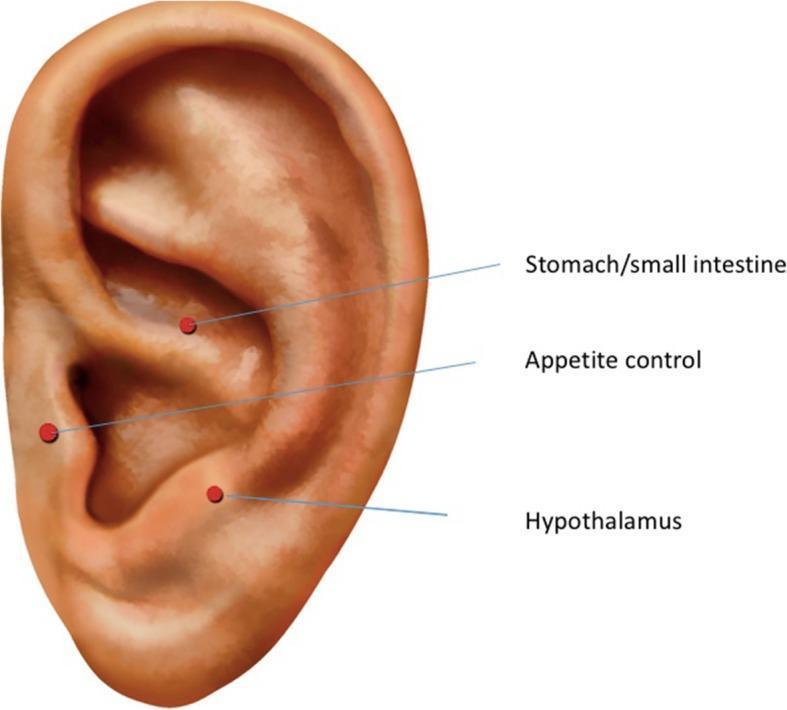
Anatomical diagram of a human right auricle illustrating specific auricular acupuncture points. The image highlights three targeted areas within the concha of the ear, marked with red circular dots and corresponding text labels. The 'Stomach/small intestine' point is located in the superior portion of the concha, near the crus of the helix. The 'Appetite control' point is positioned centrally within the auricular concha. The 'Hypothalamus' point is located in the inferior concha, adjacent to the tragus and the external auditory canal entrance. This diagram serves as a clinical reference for Auricular Electroacupuncture (AEA) protocols, demonstrating the topographic relationship between external ear anatomy (helix, antihelix, concha, and lobe) and traditional acupuncture sites used for physiological regulation, such as managing appetite or hormonal symptoms.
Anatomical diagram of a human right auricle illustrating specific auricular acupuncture points. The image highlights three targeted areas within the concha of the ear, marked with red circular dots and corresponding text labels. The 'Stomach/small intestine' point is located in the superior portion of the concha, near the crus of the helix. The 'Appetite control' point is positioned centrally within the auricular concha. The 'Hypothalamus' point is located in the inferior concha, adjacent to the tragus and the external auditory canal entrance. This diagram serves as a clinical reference for Auricular Electroacupuncture (AEA) protocols, demonstrating the topographic relationship between external ear anatomy (helix, antihelix, concha, and lobe) and traditional acupuncture sites used for physiological regulation, such as managing appetite or hormonal symptoms.

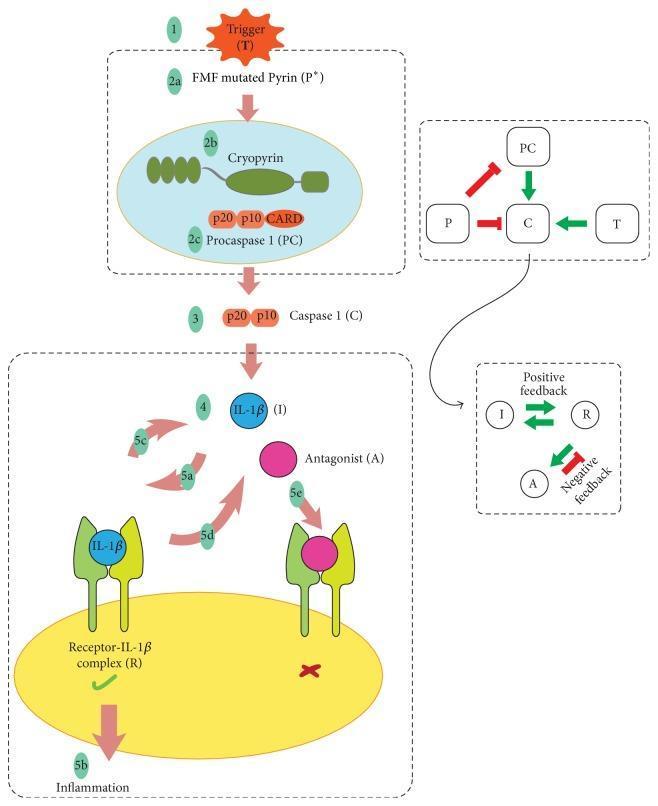
A detailed pathophysiology diagram illustrating the pathogenesis of Familial Mediterranean Fever (FMF) and the associated inflammasome signaling pathway. The diagram is divided into steps: (1) An external Trigger (T) initiates the process. (2a) FMF mutated Pyrin (P*) fails to inhibit the assembly. (2b-2c) Cryopyrin and Procaspase 1 (PC) complex into an active inflammasome. (3) Procaspase 1 is cleaved into active Caspase 1 (C), consisting of p20 and p10 subunits. (4) Caspase 1 matures IL-1β (I). (5a-5b) IL-1β binds to its receptor, forming the Receptor-IL-1β complex (R), triggering a signaling cascade that leads to systemic inflammation. Insets show regulatory feedback loops: a 'Positive feedback' loop where the IL-1β complex promotes further IL-1β production, and a 'Negative feedback' loop involving an Antagonist (A) that blocks the receptor (5e) to prevent signaling. Secondary logic diagrams highlight the mathematical modeling components, showing how mutated Pyrin (P) and Trigger (T) influence the conversion of PC to C. This diagram is designed for intermediate to advanced immunology and genetics education.
A detailed pathophysiology diagram illustrating the pathogenesis of Familial Mediterranean Fever (FMF) and the associated inflammasome signaling pathway. The diagram is divided into steps: (1) An external Trigger (T) initiates the process. (2a) FMF mutated Pyrin (P*) fails to inhibit the assembly. (2b-2c) Cryopyrin and Procaspase 1 (PC) complex into an active inflammasome. (3) Procaspase 1 is cleaved into active Caspase 1 (C), consisting of p20 and p10 subunits. (4) Caspase 1 matures IL-1β (I). (5a-5b) IL-1β binds to its receptor, forming the Receptor-IL-1β complex (R), triggering a signaling cascade that leads to systemic inflammation. Insets show regulatory feedback loops: a 'Positive feedback' loop where the IL-1β complex promotes further IL-1β production, and a 'Negative feedback' loop involving an Antagonist (A) that blocks the receptor (5e) to prevent signaling. Secondary logic diagrams highlight the mathematical modeling components, showing how mutated Pyrin (P) and Trigger (T) influence the conversion of PC to C. This diagram is designed for intermediate to advanced immunology and genetics education.

This medical illustration is a sagittal-view anatomical diagram of the human brain, serving as a functional map of the orexinergic system. The diagram highlights the lateral hypothalamus (LHA) as a central origin point for orexin-producing neurons. Using a color-coded arrow system, the schematic demonstrates the extensive neural projections to various cortical and subcortical regions involved in reward processing and hedonic tone. Blue arrows specifically denote orexin projections, while black arrows represent hypothesized modulation pathways. Key anatomical targets depicted include cortical regions such as the anterior cingulate cortex (ACG), dorsolateral prefrontal cortex (dlPFG), orbitomedial and ventromedial prefrontal cortex (omPFC, vmPFC), and the insula (I). Subcortical targets include the nucleus accumbens (NA), ventral tegmental area (VTA), amygdala (A), thalamus (T), and brainstem nuclei like the raphe nucleus (RN) and locus coeruleus (LC). This diagram is designed for educational use in neurobiology and psychiatry to illustrate the interplay between the hypothalamus and the limbic-cortical-striatal-pallidal-thalamic circuits in regulating mood and motivation.

This medical illustration is a sagittal-view anatomical diagram of the human brain, serving as a functional map of the orexinergic system. The diagram highlights the lateral hypothalamus (LHA) as a central origin point for orexin-producing neurons. Using a color-coded arrow system, the schematic demonstrates the extensive neural projections to various cortical and subcortical regions involved in reward processing and hedonic tone. Blue arrows specifically denote orexin projections, while black arrows represent hypothesized modulation pathways. Key anatomical targets depicted include cortical regions such as the anterior cingulate cortex (ACG), dorsolateral prefrontal cortex (dlPFG), orbitomedial and ventromedial prefrontal cortex (omPFC, vmPFC), and the insula (I). Subcortical targets include the nucleus accumbens (NA), ventral tegmental area (VTA), amygdala (A), thalamus (T), and brainstem nuclei like the raphe nucleus (RN) and locus coeruleus (LC). This diagram is designed for educational use in neurobiology and psychiatry to illustrate the interplay between the hypothalamus and the limbic-cortical-striatal-pallidal-thalamic circuits in regulating mood and motivation.

Loading Image
I now have all the information needed for a thorough answer. Here it is:

Why Chills Occur in Fever

The Core Concept: The Thermostat Reset

The hypothalamus acts as the body's thermostat. It maintains a set-point temperature of ~37°C. During fever, this set point is raised to a higher level. The key insight is: chills happen because the body perceives itself as colder than the new set point, even though its actual temperature may already be above normal.
As Guyton & Hall describes:
"Because the blood temperature is now less than the set point of the hypothalamic temperature controller, the usual responses that cause elevation of body temperature occur. During this period, the person experiences chills and feels extremely cold, even though their body temperature may already be above normal."
  • Guyton and Hall Textbook of Medical Physiology, p. 901

Step-by-Step Mechanism

1. Infection Triggers Pyrogens

When bacteria, viruses, or other pathogens enter the body, immune cells (macrophages, monocytes, Kupffer cells) phagocytose them and release pyrogenic cytokines - primarily:
  • IL-1β (the classic endogenous pyrogen)
  • IL-6
  • TNF-α
  • IFN-β, IFN-γ
Exogenous pyrogens (e.g., bacterial endotoxin/LPS from gram-negative bacteria) also trigger this cascade. As little as 2-3 ng/kg of LPS injected into humans produces fever, leukocytosis, and malaise. (Harrison's Principles of Internal Medicine 22E, p. 178)

2. Prostaglandin E2 Resets the Hypothalamic Set Point
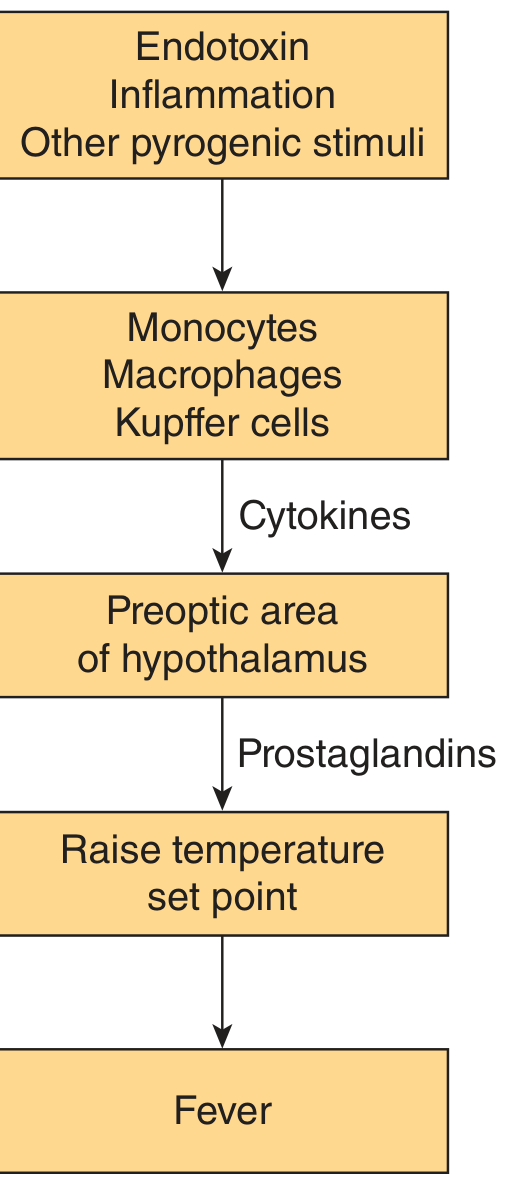
Pyrogenic cytokines act on the preoptic area of the anterior hypothalamus - they cannot easily cross the blood-brain barrier directly, so they act on the OVLT (organum vasculosum of the lamina terminalis), a circumventricular organ. This triggers local production of Prostaglandin E2 (PGE2) via the COX pathway.
PGE2 acts on EP3 receptors in the hypothalamus and raises the thermoregulatory set point - say from 37°C to 39-40°C.
Fever pathogenesis flowchart - Ganong's Review of Medical Physiology
Figure: Pathogenesis of fever - from Ganong's Review of Medical Physiology, 26th Ed.

3. The Body "Thinks" It Is Too Cold → Chills Begin

Once the set point is elevated, the hypothalamus now compares the actual body temperature against this new, higher target. Since actual temperature (say 37°C) is now below the new set point (say 39°C), the hypothalamus sends out heat-generating and heat-conserving signals exactly as it would in a cold environment:
ResponseMechanismWhat You Feel
ShiveringRapid skeletal muscle contractionsShaking chills, rigors
Cutaneous vasoconstrictionSympathetic tone increases, skin blood vessels constrictSkin becomes cold and pale
Piloerection"Goosebumps"Skin feels cold
Reduced sweatingHeat retentionNo sweating despite rising temperature
BehavioralCurling up, seeking warmthFeeling cold
These responses generate and conserve heat to drive the body temperature up to the new set point.
Costanzo Physiology explains it precisely:
"The anterior hypothalamus... actuates heat-generating mechanisms (e.g., shivering) to raise body temperature to the new set point."
  • Costanzo Physiology, 7th Edition

4. Chills End When the New Set Point is Reached

Once body temperature climbs to match the new set-point (e.g., 39°C), the shivering and vasoconstriction stop. The person now feels neither hot nor cold even at this elevated temperature - this is the sustained fever phase.

5. The "Crisis" or Defervescence (Flushing)

When the infection is cleared (or antipyretics are given), PGE2 production drops, and the set point falls back to normal. Now the body temperature is above the set point, so heat-dissipating mechanisms activate:
  • Vasodilation (flushed, warm skin)
  • Profuse sweating
This is why patients sweat heavily when a fever "breaks."

Why Aspirin/NSAIDs Stop Chills

Aspirin and NSAIDs inhibit cyclooxygenase (COX), blocking prostaglandin synthesis. This prevents PGE2 from raising the hypothalamic set point. With a lower set point, the body now "sees" its temperature as too high and activates heat-dissipating mechanisms (vasodilation, sweating) - hence the sweating that follows taking an antipyretic.

Summary

Pathogen → Macrophages release IL-1/IL-6/TNF 
         → Hypothalamic PGE2 production 
         → Set point raised (e.g., 37°C → 39°C)
         → Actual temp < new set point 
         → CHILLS (shivering + vasoconstriction) 
         → Body temperature rises to new set point 
         → Sustained fever (no chills)
         → Infection cleared / antipyretic given 
         → Set point drops 
         → SWEATING / flushing (defervescence)
The chills are not a sign of cold - they are the body's active mechanism to generate heat and reach the new, elevated thermoregulatory target.

Sources: Guyton and Hall Textbook of Medical Physiology; Costanzo Physiology, 7th Ed.; Ganong's Review of Medical Physiology, 26th Ed.; Harrison's Principles of Internal Medicine, 22nd Ed.
This is a shared conversation. Sign in to Orris to start your own chat.