
Ischemia of heart
myocardial ischemia heart diagram coronary artery
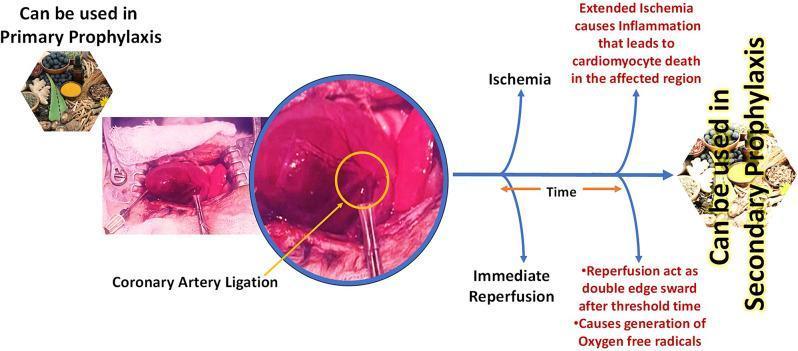
This medical infographic illustrates the experimental induction and pathophysiology of Myocardial Ischemia-Reperfusion Injury (MIRI) in an in vivo model. On the left, a clinical photograph displays a surgical field where coronary artery ligation is performed on an exposed heart; a circular inset uses an arrow to highlight the precise site of vessel occlusion. To the right, a horizontal timeline diagram outlines the resulting pathological sequence. The initial ligation leads to ischemia, which if extended, triggers inflammation and subsequent cardiomyocyte death. The diagram also illustrates 'Immediate Reperfusion' as a 'double-edged sword' that, after a threshold time, causes the generation of oxygen-free radicals (reactive oxygen species). The flowchart integrates pharmacological intervention points, indicating where natural compounds (likely flavonoids based on the icons) can be utilized in 'Primary Prophylaxis' prior to the ischemic event or 'Secondary Prophylaxis' during the reperfusion phase. This visual resource is designed to teach the mechanisms of acute cardiac injury and the potential role of antioxidants in cardiovascular protection.
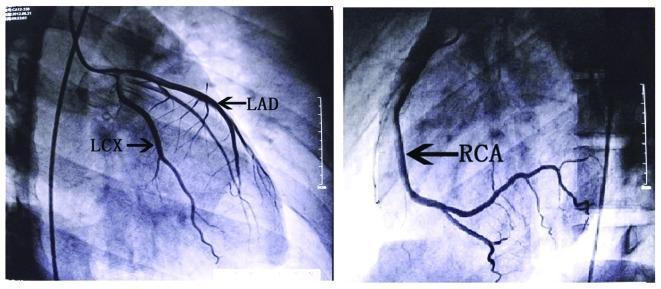
Two diagnostic images showing coronary angiography findings in a patient with suspected myocardial ischemia. The left panel displays the left coronary system, with labels identifying the Left Anterior Descending (LAD) artery and the Left Circumflex (LCX) artery. The LAD is seen descending toward the cardiac apex with visible diagonal branches, while the LCX courses posteriorly along the atrioventricular groove with visible marginal branches. The right panel displays the Right Coronary Artery (RCA) in a C-shaped configuration, showing its descent along the right side of the heart and its posterior interventricular branches. Both panels demonstrate smooth vessel contours, normal physiological tapering, and unobstructed contrast flow through the epicardial coronary arteries. There are no signs of significant stenosis, occlusion, or coronary artery disease, which helps differentiate myocarditis from acute myocardial infarction in a clinical setting.
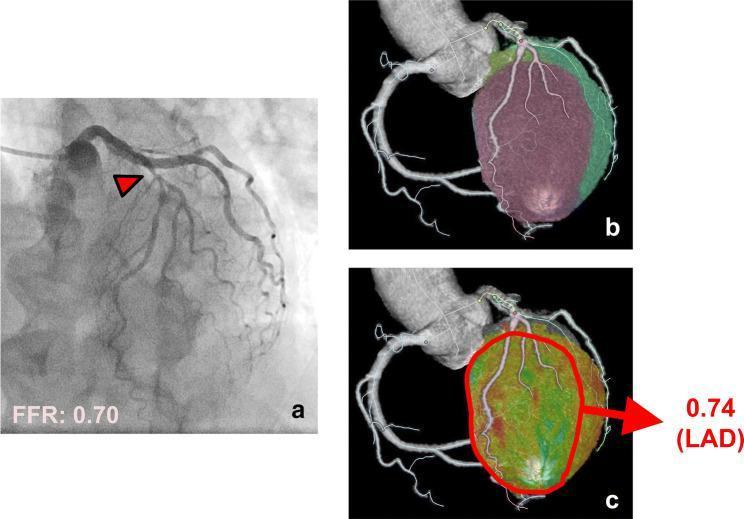
This composite medical image illustrates the diagnostic evaluation of coronary artery disease using invasive and non-invasive modalities. Image (a) is an invasive coronary angiography (ICA) frame showing significant stenosis in the left anterior descending (LAD) artery, highlighted by a red arrowhead. A text annotation at the bottom indicates a fractional flow reserve (FFR) of 0.70, signifying hemodynamically significant ischemia. Images (b) and (c) present three-dimensional computed tomography (CT) reconstructions of the heart. Image (b) utilizes a Voronoi diagram to delineate myocardial territories, with a purple-shaded region representing the stenosis-related area. Image (c) provides a color-coded myocardial perfusion map; the red-outlined region identifies the area of reduced blood flow corresponding to the LAD lesion. An arrow points to this region with a quantitative perfusion ratio (CT-QPR) value of 0.74, demonstrating high correlation with the invasive FFR measurement. These panels collectively demonstrate how advanced CT post-processing can identify ischemia-prone myocardial territories distal to a coronary stenosis.
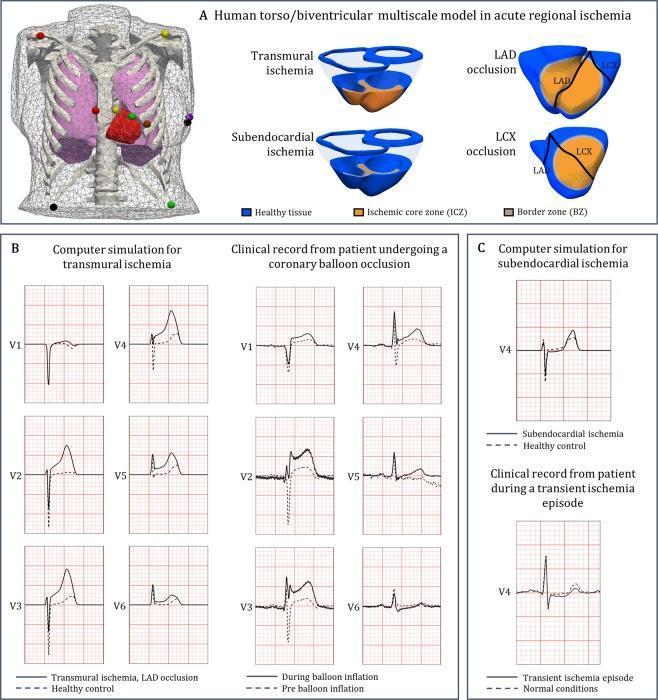
This infographic and diagnostic diagram illustrates a human torso and biventricular electrophysiology model for simulating acute regional myocardial ischemia and its effects on ECG signals. Panel A displays a 3D mesh torso model with standard 12-lead ECG electrode placements and cross-sectional schematic representations of the heart. These schematics distinguish between transmural ischemia (affecting the full thickness of the myocardium) and subendocardial ischemia (confined to the inner layer), highlighting the Ischemic Core Zone (ICZ) and Border Zone (BZ) in relation to LAD and LCX coronary artery occlusions. Panel B provides a side-by-side comparison of computer-simulated ECG signals and clinical recordings from a patient with LAD occlusion, demonstrating characteristic ST-segment elevation in precordial leads V1-V6 during transmural ischemia. Panel C compares simulated and clinical ECG data for subendocardial ischemia, focusing on lead V4 to show characteristic ST-segment depression. This resource serves as an educational tool for understanding the electrophysiological correlation between the depth of myocardial injury and surface ECG manifestations.
myocardial ischemia pathophysiology management
Ischemia of the Heart (Ischemic Heart Disease)
Definition
- Harrison's Principles of Internal Medicine 22E, p. 145
Epidemiology
- Robbins, Cotran & Kumar Pathologic Basis of Disease, p. 509
Causes and Pathogenesis
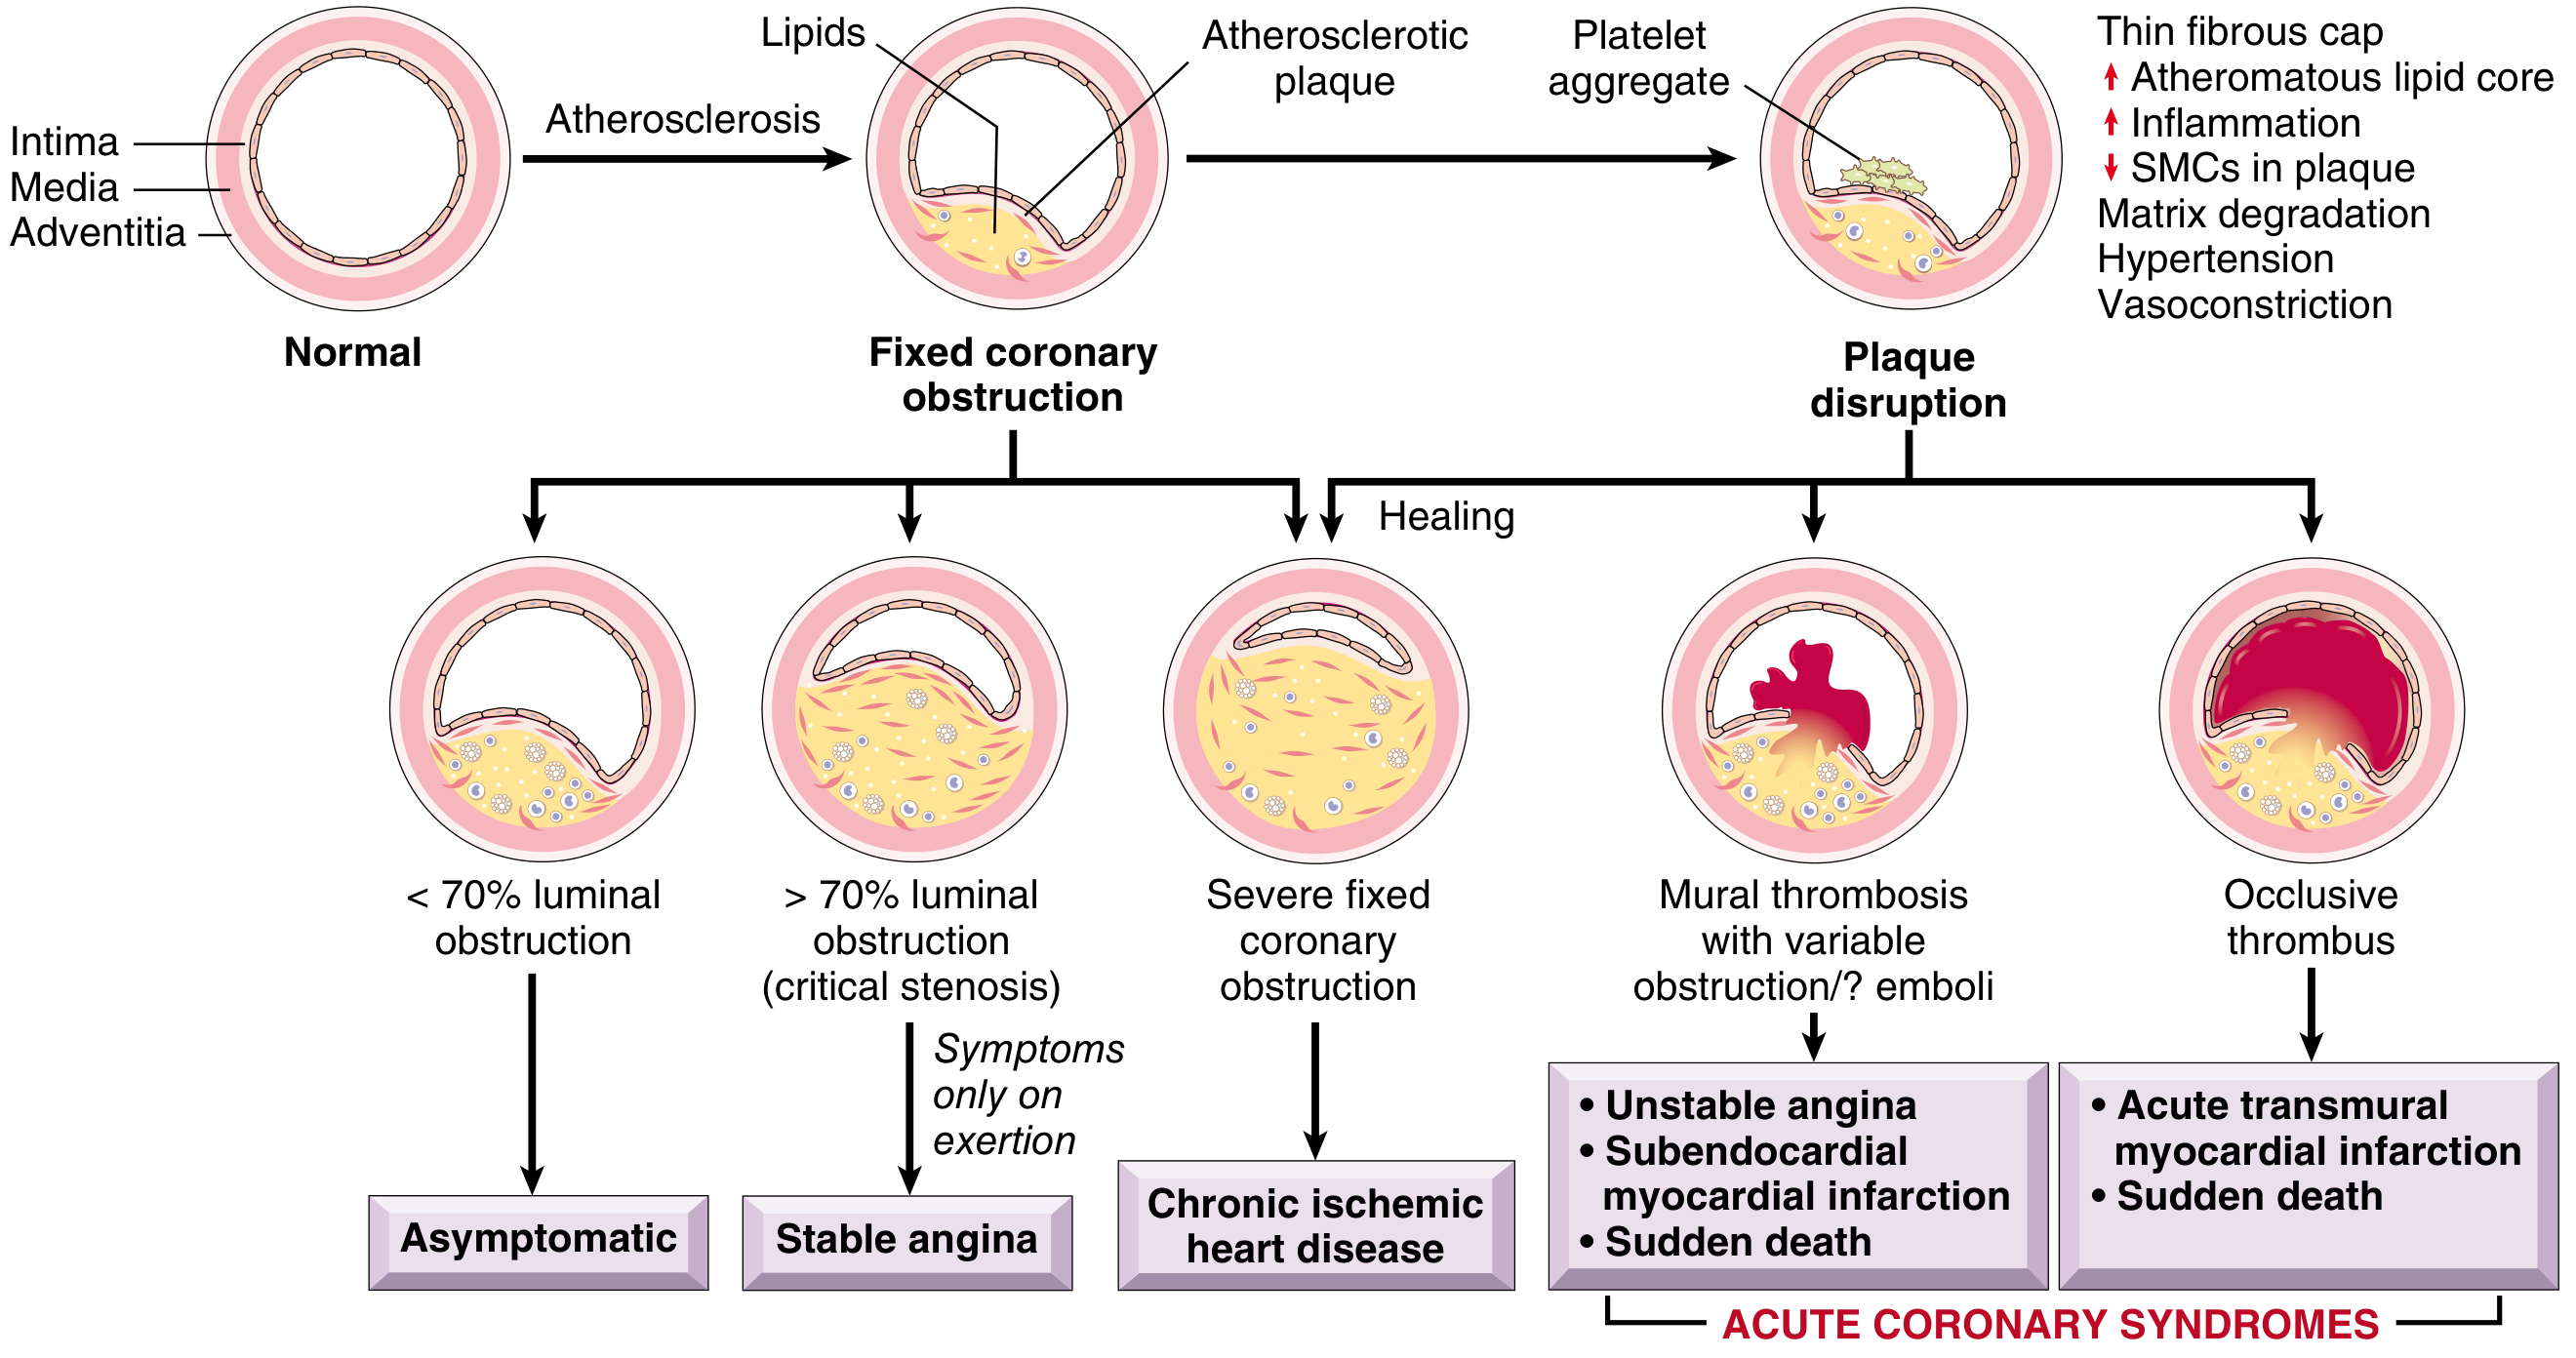
Two Main Mechanisms:
- Obstruction >70% of vascular cross-section = "critical stenosis" - symptoms on exertion (stable angina)
- Obstruction >90% - ischemia even at rest
- Slowly developing obstruction allows collateral channel formation, which can compensate even for high-grade stenosis
- The LAD, LCX, and RCA are most commonly affected, especially within the first few centimeters of the LAD and LCX
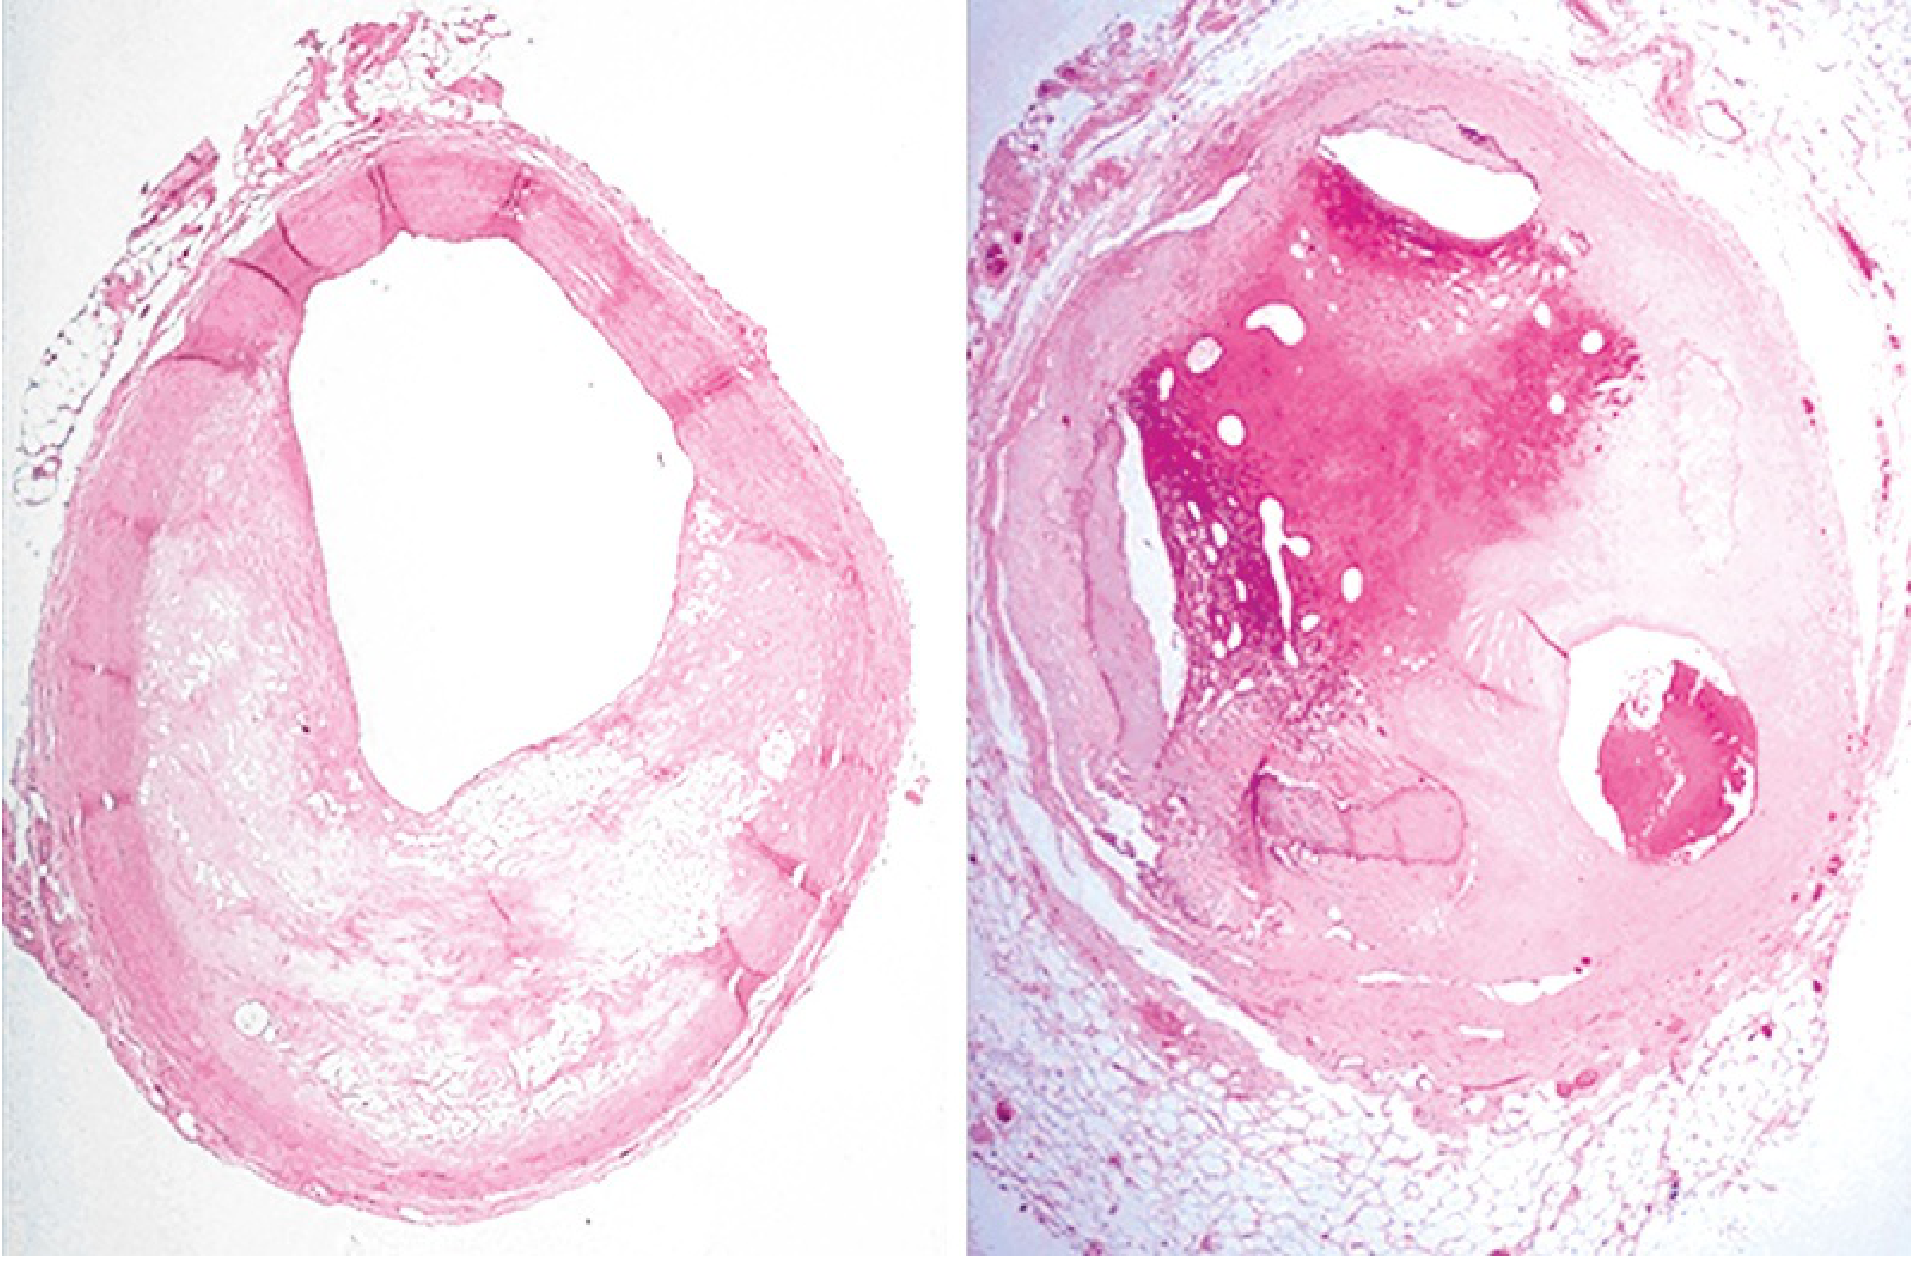
- Sudden rupture, fissuring, ulceration, or erosion of a plaque exposes thrombogenic constituents
- Rapid thrombosis ensues - mural thrombus causes unstable angina/NSTEMI; occlusive thrombus causes STEMI and sudden death
- Hemorrhage into a plaque core can acutely expand its volume and worsen luminal stenosis
Oxygen Supply-Demand Imbalance
| Increases O2 Demand | Decreases O2 Supply |
|---|---|
| Tachycardia | Coronary stenosis / thrombosis |
| Increased contractility | Anemia |
| LV wall stress / hypertrophy | Hypoxemia |
| Hypertension | Hypotension / shock |
| Fever, thyrotoxicosis | Vasospasm |
Pathophysiology: Cellular Events
- Aerobic metabolism ceases
- ATP drops, lactic acid accumulates
- Contractility is lost within minutes
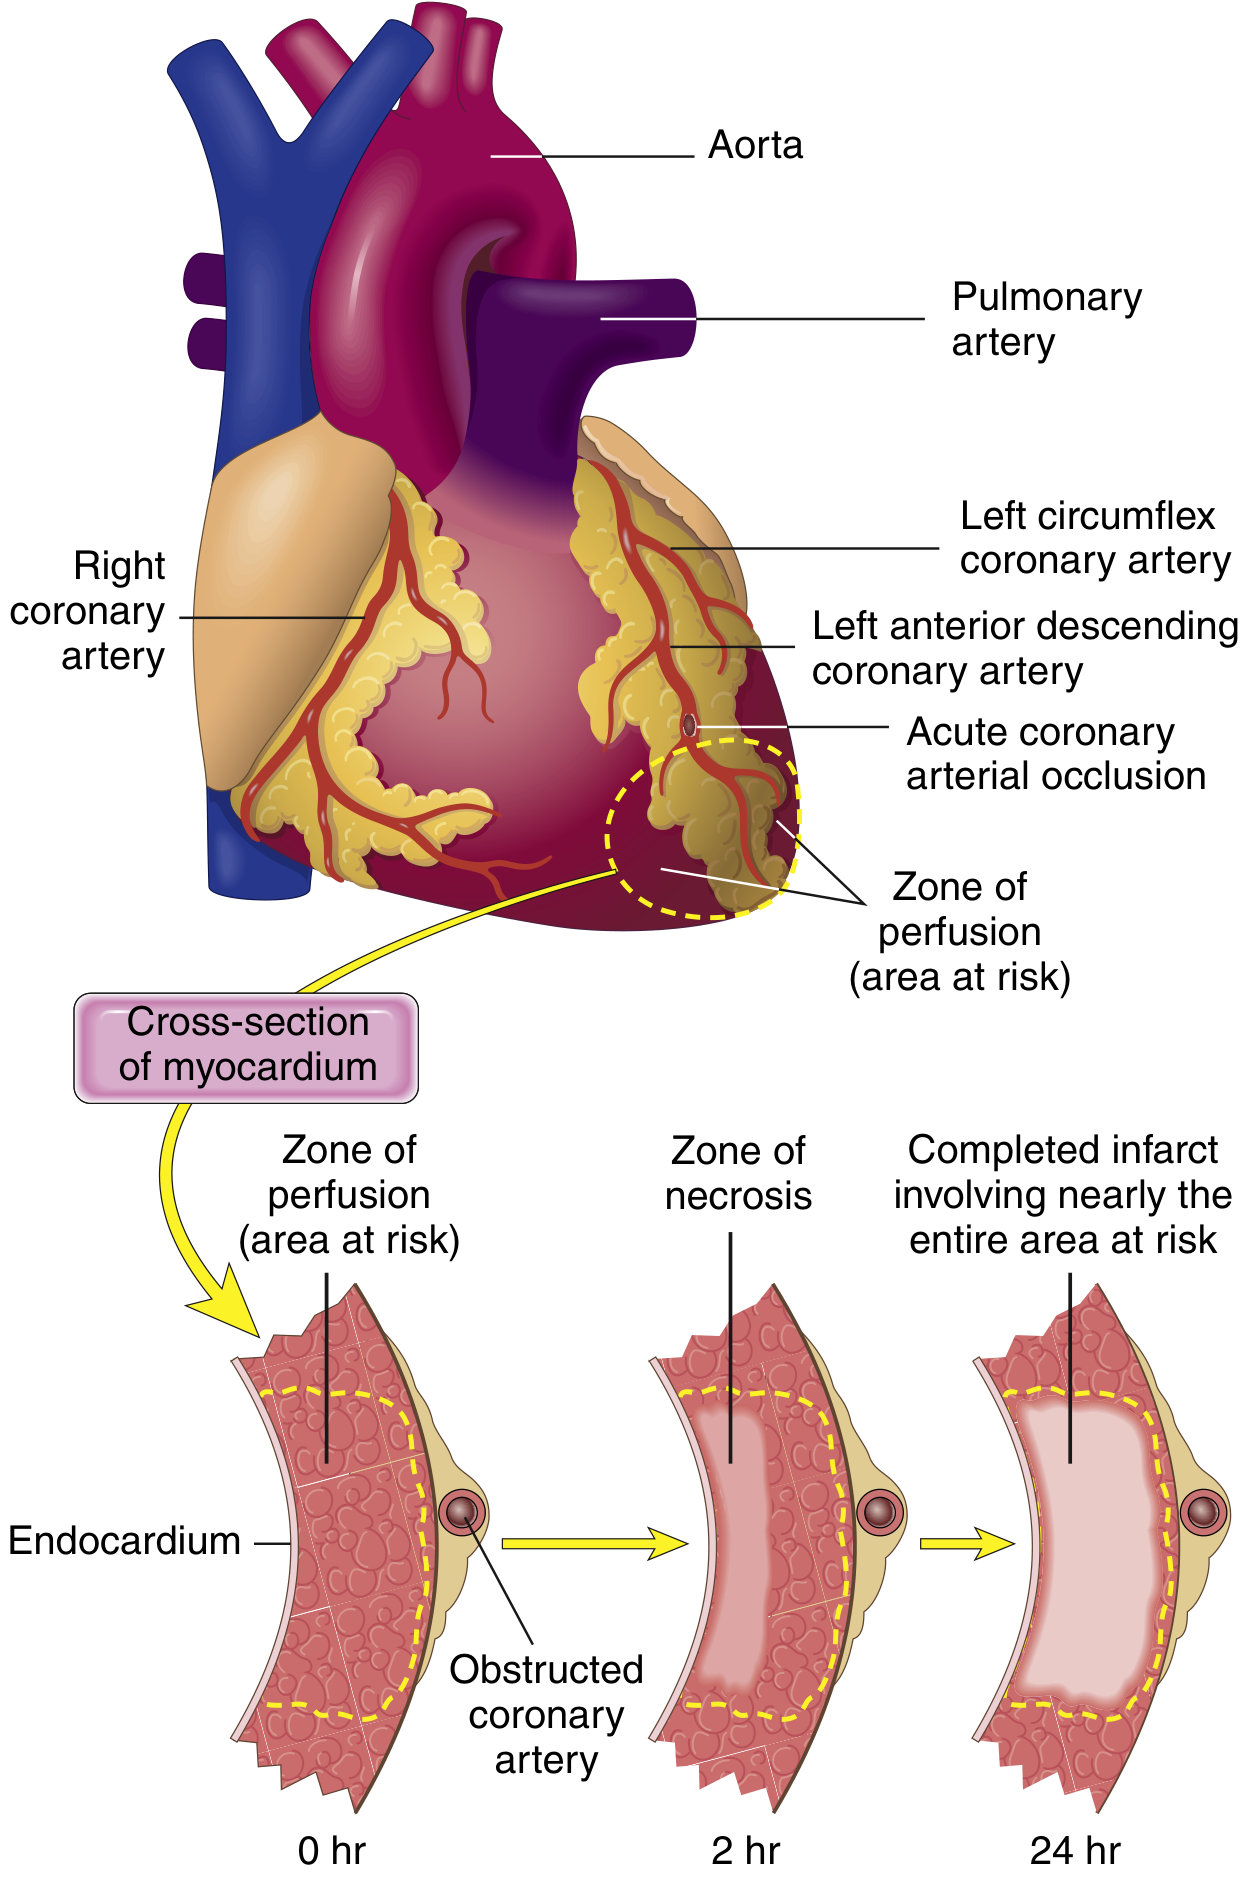
- Irreversible myocyte damage (coagulative necrosis) begins
- Sarcolemmal membrane disrupts, releasing intracellular enzymes (troponins, CK-MB) into the circulation
Key Pathophysiologic Concepts:
- Stunned myocardium: If reperfusion occurs before irreversible injury, myocardium is preserved but can remain non-contractile for days due to persistent biochemical abnormalities
- Arrhythmias: Ischemic electrical instability/irritability is responsible for 80-90% of cardiac deaths in IHD (ventricular fibrillation), not mechanical failure per se
- Reperfusion injury: Restoration of flow can itself cause additional damage via reactive oxygen species
Microscopic Pathology
Clinical Syndromes of IHD
| Syndrome | Mechanism | Key Feature |
|---|---|---|
| Stable angina | Fixed stenosis >70%, demand exceeds fixed supply | Predictable exertional chest pain, relieved by rest/nitrates |
| Unstable angina | Plaque disruption + partial/mural thrombus | Rest pain, new onset, crescendo pattern; no myocardial necrosis (troponin negative) |
| NSTEMI | Partial occlusion / mural thrombus | Subendocardial necrosis; troponin rise; ST depression or T-wave changes |
| STEMI | Complete occlusive thrombus | Transmural necrosis; ST elevation; needs urgent reperfusion |
| Chronic IHD with HF | Cumulative myocardial loss | Ventricular dysfunction, remodeling |
| Sudden cardiac death | Ventricular fibrillation from ischemic irritability | Often first presentation |
| Silent ischemia | Ischemic episodes without symptoms | Detected on Holter/stress test; carries adverse prognosis |
Coronary Artery Territory and Infarct Location
| Artery Occluded | Territory | Frequency |
|---|---|---|
| LAD (proximal) | Anterior LV wall, anterior 2/3 septum, apex | 40-50% of MIs |
| RCA (proximal) | Most of RV, posterior LV (in right-dominant heart) | 30-40% |
| LCX (proximal) | Lateral LV | 15-20% |
Clinical Presentation
- Quality: pressure, tightness, squeezing, heaviness, burning
- Location: retrosternal, radiation to neck, jaw, shoulders, or arms; sometimes epigastric
- Stable angina: precipitated by exertion or cold, lasting 2-10 min, relieved by rest or nitrates
- MI: usually >30 min, not relieved by nitrates, associated with diaphoresis, nausea, dyspnea
ECG Changes in Ischemia
| Finding | Meaning |
|---|---|
| ST elevation | Transmural ischemia (full thickness) - STEMI or Prinzmetal's vasospasm |
| ST depression | Subendocardial ischemia |
| T-wave inversion | Myocardial injury / ischemia |
| Hyperacute T waves | Very early transmural ischemia |
| Pathological Q waves | Completed transmural infarction (irreversible) |
Risk Factors
Management Overview
Acute (STEMI/NSTEMI)
- Reperfusion is the priority: Primary PCI (preferred within 90 min of first contact) or thrombolysis if PCI unavailable
- Antiplatelet: Aspirin + P2Y12 inhibitor (clopidogrel, ticagrelor, or prasugrel)
- Anticoagulation: Heparin / LMWH / fondaparinux
- Beta-blockers, nitrates, oxygen (if SpO2 <90%)
Chronic Stable IHD
- Anti-ischemic: Beta-blockers (first line), calcium channel blockers, long-acting nitrates, ranolazine
- Anti-atherosclerotic: High-intensity statins, ACE inhibitors / ARBs, low-dose aspirin
- Revascularization: PCI or CABG for refractory angina or high-risk anatomy
Prevention
- Lifestyle modification (smoking cessation, diet, exercise, weight control)
- Glycemic control in diabetes
- Blood pressure control
- Beta-blockers for secondary prevention after MI - a recent meta-analysis (Chi et al., 2025, PMID 39298680) shows benefit even in patients without reduced ejection fraction
Key Takeaways
- IHD arises from oxygen supply-demand mismatch, most often due to coronary atherosclerosis
- Critical stenosis (>70%) causes stable/exertional angina; plaque disruption with thrombosis causes acute coronary syndromes
- Irreversible injury starts in the subendocardium at ~20-40 min and becomes transmural within 3-6 hours without reperfusion
- Ventricular fibrillation (not pump failure) causes 80-90% of ischemic cardiac deaths
- Reperfusion (PCI/thrombolysis) within the therapeutic window is the cornerstone of STEMI management