Easy to understand ECG
Reading File
Finding Sources
Searching the Web
ECG interpretation basics easy guide P wave QRS complex
Reading File
Finding Sources
Loading Image
Finding Sources
Finding Sources
Finding Sources
Reading File
Finding Sources
Finding Sources
Reading File
Reading File
Loading Image
Reading File
Loading Image
Here is a complete, easy-to-understand guide to the ECG (electrocardiogram).
ECG Made Easy
What Is an ECG?
An ECG (electrocardiogram) records the electrical activity of the heart at the body surface. Every time the heart beats, electrical signals travel through it in a predictable path - and the ECG captures that journey as a wave pattern on paper.
The ECG Paper
ECG paper is a grid where:
- Horizontal axis = Time - each small box = 0.04 seconds; each large box (5 small boxes) = 0.2 seconds
- Vertical axis = Voltage (amplitude) - each small box = 0.1 mV
The Cardiac Conduction System (What Generates the Waves)
The electrical signal follows this path:
SA Node → Atria → AV Node → Bundle of His →
Left & Right Bundle Branches → Purkinje Fibers → Ventricular Muscle
Each part of this journey creates a specific wave on the ECG.
The PQRST Waves - One at a Time

P Wave
- What it is: Atrial depolarization (the atria contracting)
- Origin: SA node fires, signal spreads through both atria
- Normal: Smooth, rounded, upright in leads I, II; duration < 0.12 sec (3 small boxes); amplitude 2-3 mm
- Simple memory: "P = atria Pumping"
PR Interval
- What it is: Time from start of atrial depolarization to start of ventricular depolarization
- Includes: The P wave + the flat PR segment (= AV node delay)
- Normal: 0.12 - 0.20 sec (3-5 large boxes)
- Clinical use: Prolonged PR = heart block; short PR = pre-excitation (e.g., WPW)
QRS Complex
- What it is: Ventricular depolarization (both ventricles contracting)
- Q wave: First downward deflection (small, normal septal Q)
- R wave: First upward deflection (the tall peak)
- S wave: First downward deflection after the R wave
- Normal duration: < 0.12 sec (< 3 small boxes)
- Clinical use: Wide QRS (> 0.12 sec) = bundle branch block or ventricular rhythm
- Simple memory: "QRS = ventricles Squeezing"
Why is QRS as short as the P wave even though ventricles are larger? Because the His-Purkinje system conducts much faster than atrial conduction tissue - so ventricles depolarize just as quickly. - Costanzo Physiology, 7th ed.
ST Segment
- What it is: The flat line between end of QRS and start of T wave - corresponds to the plateau phase of the ventricular action potential
- Normal: Flat (isoelectric), hugging the baseline
- Clinical use: ST elevation = STEMI (heart attack); ST depression = ischemia or NSTEMI
T Wave
- What it is: Ventricular repolarization (the ventricles "recharging")
- Normal: Upright in leads I, II, V2-V6; always inverted in aVR
- Clinical use: Tall peaked T waves = hyperkalemia; inverted T waves = ischemia
QT Interval
- What it is: From start of QRS to end of T wave - represents the full ventricular action potential (depolarization + repolarization)
- Normal: Rate-dependent; roughly < 440 ms in men, < 460 ms in women (corrected QTc)
- Clinical use: Prolonged QT = risk of Torsades de Pointes (dangerous arrhythmia)
The 12 Leads - What They Look At
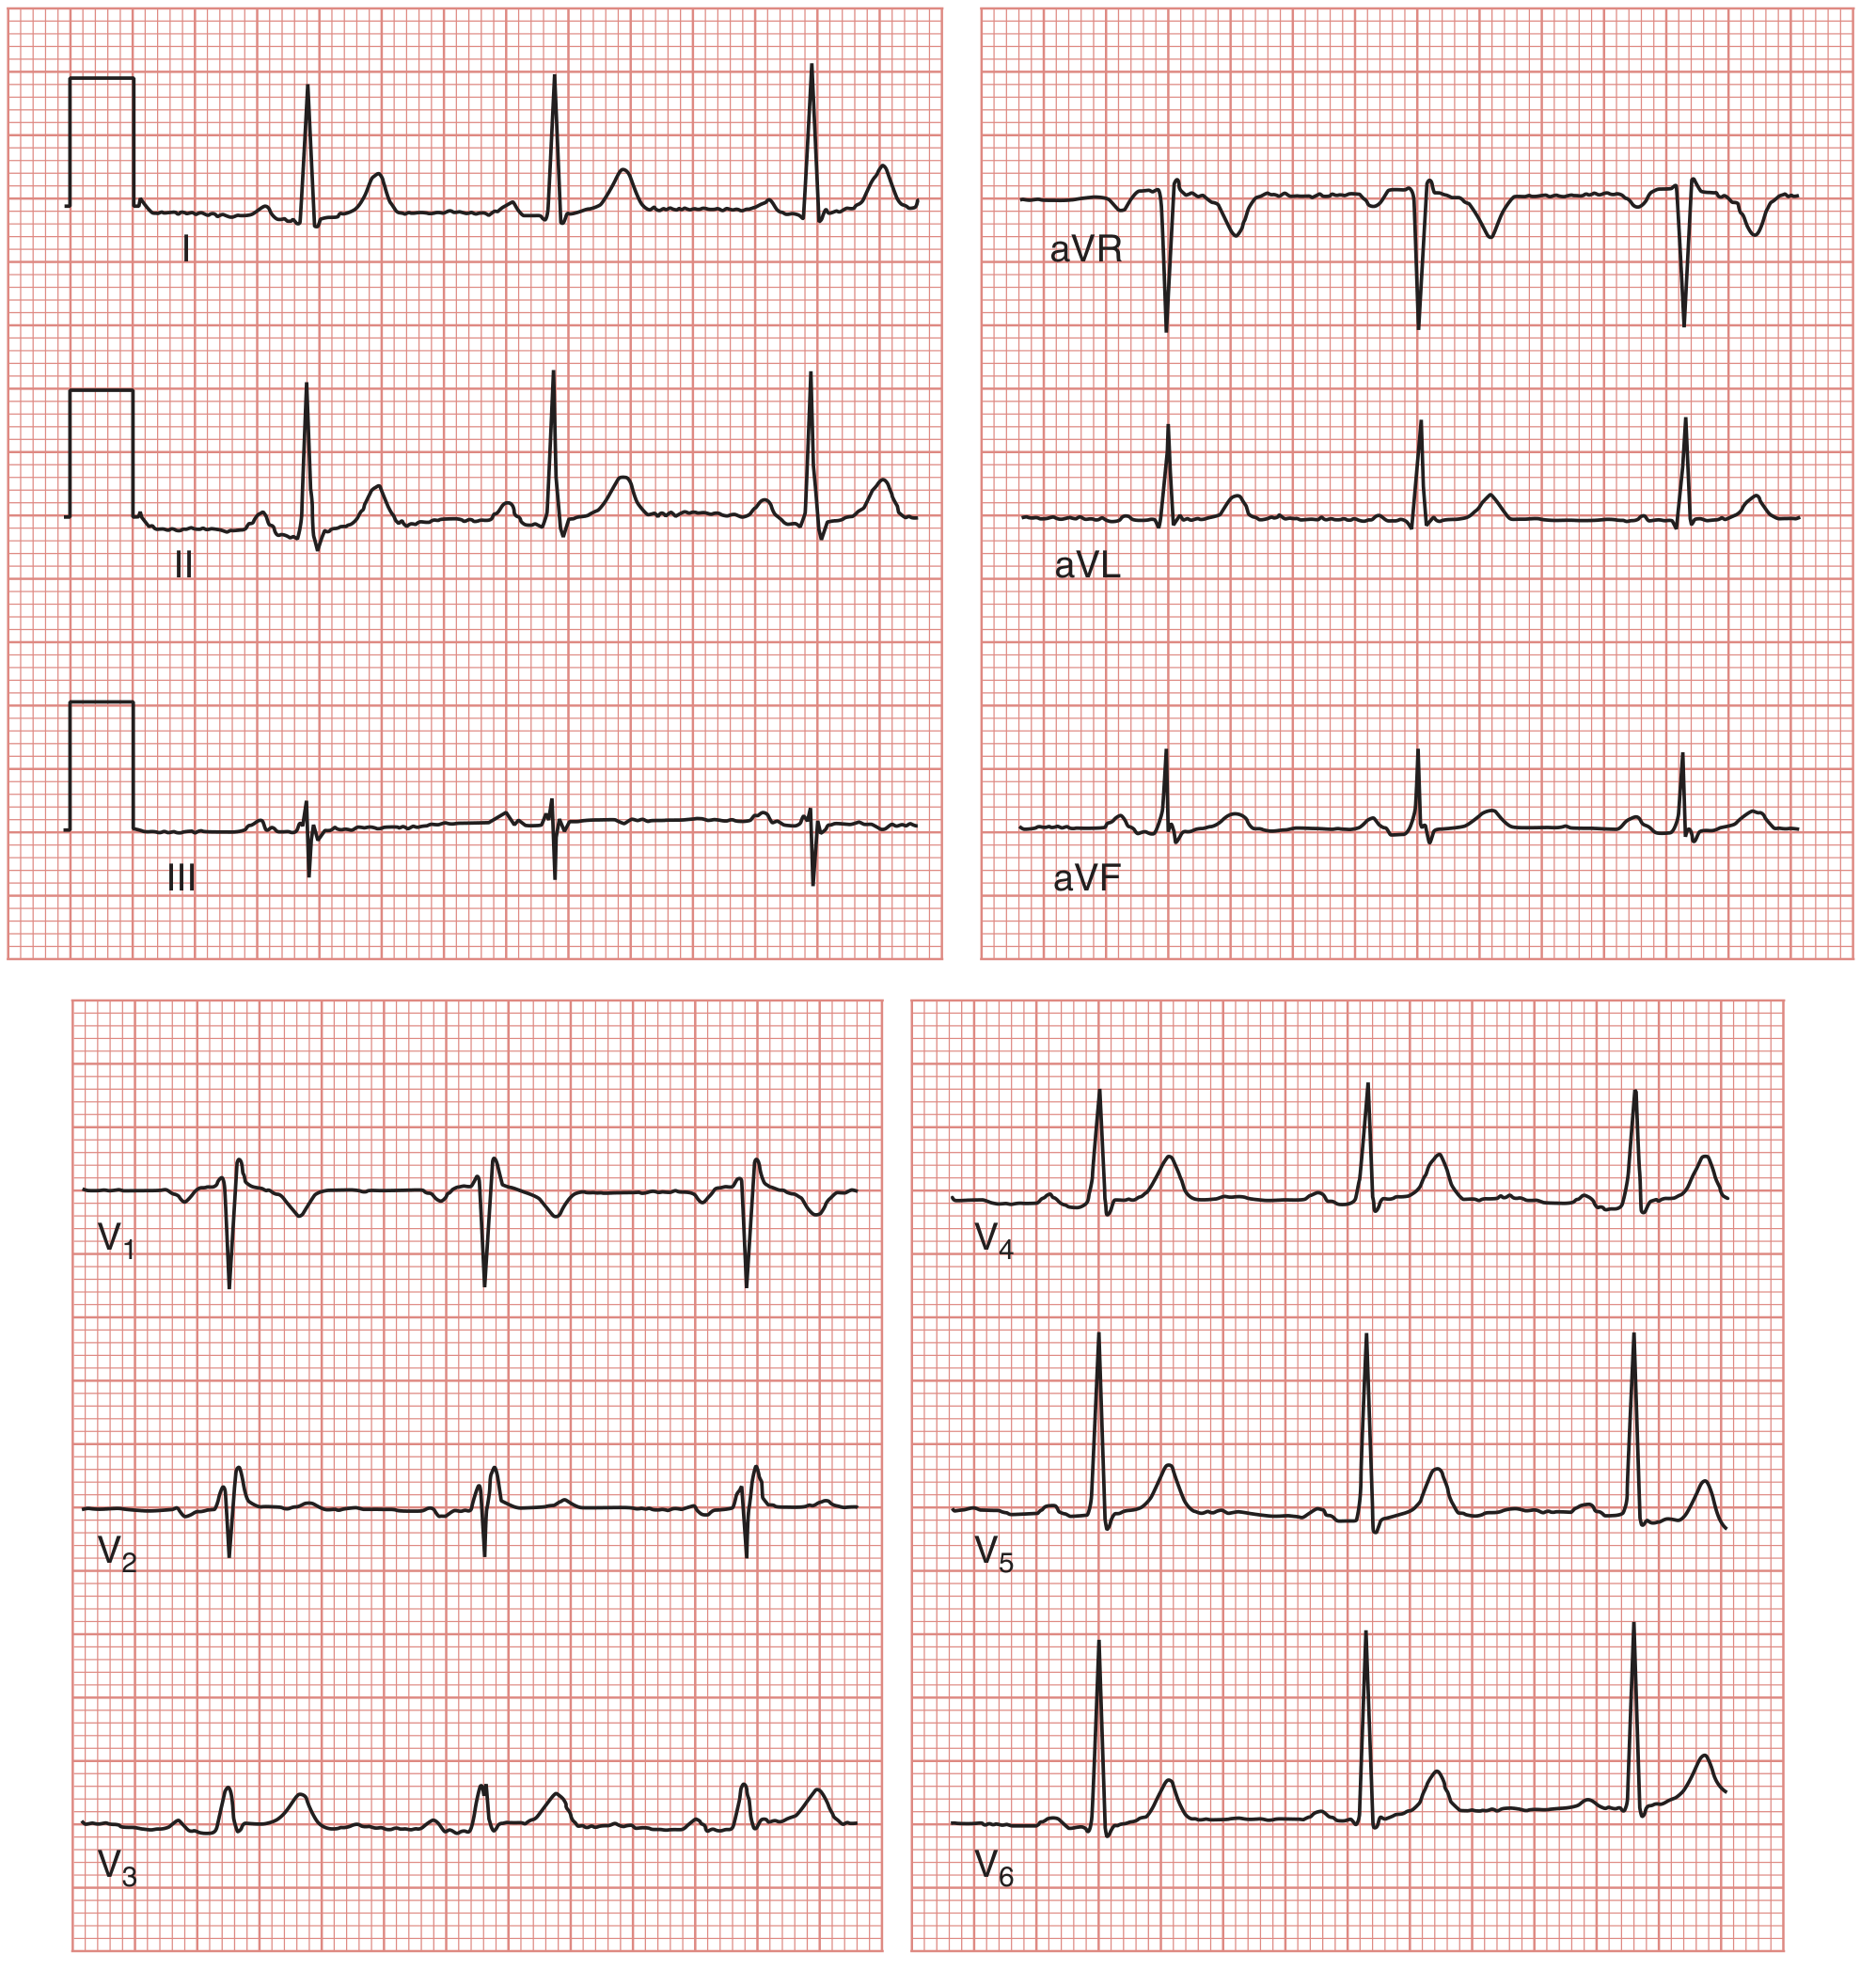
A standard 12-lead ECG gives you 12 different "camera angles" of the heart using 10 electrodes.
| Lead Group | Leads | Heart Region Viewed |
|---|---|---|
| Limb leads (frontal plane) | I, II, III, aVR, aVL, aVF | Overall electrical axis |
| Inferior | II, III, aVF | Bottom of the heart (inferior wall) |
| Lateral | I, aVL, V5, V6 | Left side of the heart |
| Septal | V1, V2 | Interventricular septum |
| Anterior | V3, V4 | Front wall of left ventricle |
How to Read an ECG - A Systematic Approach
Always go through in the same order every time:
1. Rate
- Regular rhythm: Count the large boxes between two R waves, divide 300 by that number
- 1 box = 300 bpm, 2 boxes = 150, 3 = 100, 4 = 75, 5 = 60
- Irregular rhythm: Count R waves in the 10-second strip and multiply by 6
- Normal resting rate: 60-100 bpm
2. Rhythm
- Is it regular (equal spacing between R waves) or irregular?
- Is there a P wave before every QRS? Is there a QRS after every P?
- If irregular and no visible P waves: think atrial fibrillation
3. Axis
- Look at leads I and aVF
- Both positive (upright QRS) = normal axis (-30° to +90°)
- Lead I positive, aVF negative = left axis deviation (LAHB, LBBB)
- Lead I negative, aVF positive = right axis deviation (RVH, PE)
4. P Wave Analysis
- Present and upright in lead II? (= sinus rhythm)
- Absent or chaotic? (= AF, flutter)
- Widened (> 0.12 sec)? = Left atrial enlargement ("P mitrale")
- Peaked (> 2.5 mm in II)? = Right atrial enlargement ("P pulmonale")
5. PR Interval
- Normal: 0.12-0.20 sec
- Short (< 0.12 sec): WPW or LGL syndrome
- Prolonged (> 0.20 sec): 1st degree heart block
- Progressively lengthening until a QRS is dropped: 2nd degree Mobitz I (Wenckebach)
- Constant PR with random dropped QRS: 2nd degree Mobitz II
- No relationship between P and QRS: 3rd degree (complete) heart block
6. QRS Complex
- Wide or narrow?
- Right bundle branch block (RBBB): wide QRS, "RSR' pattern" (rabbit ears) in V1
- Left bundle branch block (LBBB): wide QRS, broad notched R in V5/V6
- Q waves: pathological Q wave = old MI (width > 0.04 sec or depth > 25% of R wave height)
7. ST Segment & T Waves
- ST elevation: check which leads to localize the infarct territory (see table below)
- ST depression: ischemia, NSTEMI, digoxin effect
- T wave inversion: ischemia, ventricular strain, PE (V1-V4)
| STEMI Location | Leads with ST Elevation |
|---|---|
| Inferior | II, III, aVF |
| Anterior | V1-V4 |
| Lateral | I, aVL, V5-V6 |
| Anterolateral | V1-V6, I, aVL |
| Posterior | Tall R in V1/V2 + ST depression V1-V3 |
(Source: Tintinalli's Emergency Medicine)
8. QT Interval
- Correct for rate (QTc = QT ÷ √RR interval in seconds)
- Prolonged QTc: drugs (antiarrhythmics, antipsychotics, antibiotics), electrolyte disturbances, congenital long QT syndrome
Cardiac Cycle Correlation
This diagram shows how each ECG wave links to mechanical events in the heart:
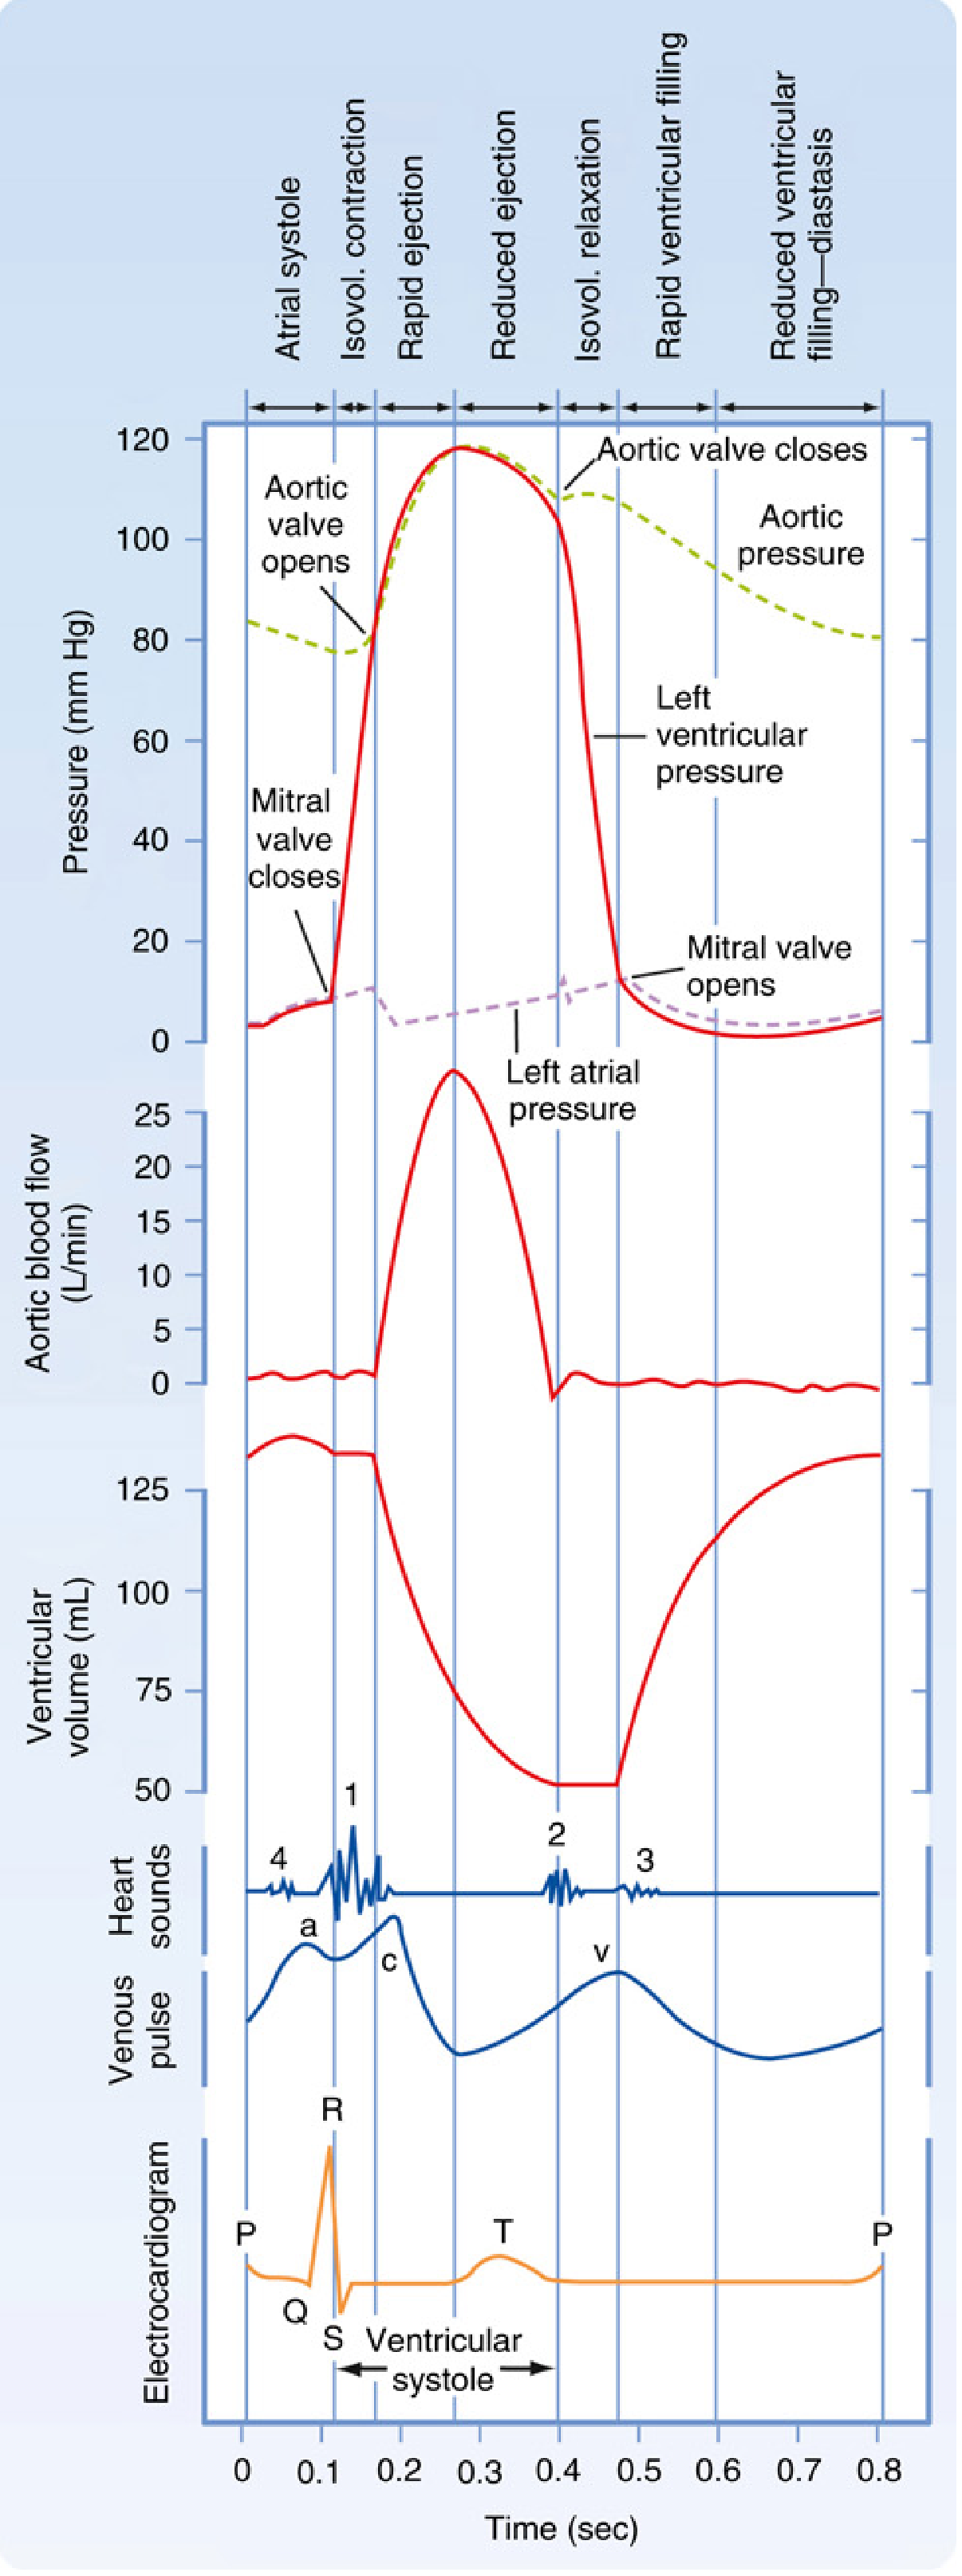
- P wave - atrial systole (the atrial "kick" - the last 25% of ventricular filling)
- QRS - mitral valve closes, ventricular systole begins
- ST segment - ventricular ejection (aortic valve is open)
- T wave - ventricular repolarization, aortic valve closes
- TP segment - diastole (ventricular filling)
Quick Normal Values Reference
| Parameter | Normal Range |
|---|---|
| Heart rate | 60-100 bpm |
| PR interval | 0.12-0.20 sec (3-5 small boxes) |
| QRS duration | < 0.12 sec (< 3 small boxes) |
| QT interval (QTc) | < 440 ms men / < 460 ms women |
| P wave duration | < 0.12 sec |
| P wave amplitude | < 2.5 mm |
Common ECG Abnormalities at a Glance
| Finding | Think of |
|---|---|
| No P waves, irregularly irregular | Atrial fibrillation |
| Sawtooth baseline ~300/min | Atrial flutter |
| Wide QRS with rabbit ears in V1 | RBBB |
| Delta wave + short PR | WPW syndrome |
| ST elevation + reciprocal changes | STEMI |
| Progressively longer PR then dropped beat | Wenckebach (Mobitz I) |
| Tall peaked T waves | Hyperkalemia |
| Sine wave pattern | Severe hyperkalemia |
| Prolonged QTc | Drug effect, hypokalemia, hypomagnesemia |
Sources: Miller's Anesthesia 10e; Costanzo Physiology 7th ed; Medical Physiology (Boron & Boulpaep); Tintinalli's Emergency Medicine
This is a shared conversation. Sign in to Orris to start your own chat.