
| **Parameter** | **Pharmacokinetics (PK)** | **Pharmacodynamics (PD)** | | ------------------------ | ----------------------------------------------------------- | --------------------------------------------------------------- | | **Definition** | Study of what the **body does to the drug** | Study of what the **drug does to the body** | | **Main focus** | Movement and fate of drug in the body | Pharmacological effects produced by the drug | | **Major processes** | **ADME** – Absorption, Distribution, Metabolism, Excretion | Drug–receptor interaction and biological response | | **Primary concern** | Drug **concentration** in the body | Drug **effect/response** | | **Measures** | Drug concentration versus time | Drug effect versus drug concentration/dose | | **Important parameters** | Cmax, Tmax, AUC, Vd, CL, t½ | Emax, EC50, potency, efficacy | | **Absorption** | Determines how quickly and how much drug enters circulation | Not directly concerned with absorption | | **Distribution** | Determines movement of drug into tissues | Determines drug availability at the site of action | | **Metabolism** | Determines how the drug is chemically transformed | Metabolites may contribute to or alter drug effects | | **Excretion** | Determines removal of drug from the body | Not directly concerned with drug elimination | | **Receptors** | Generally not the primary focus | **Major focus** of drug action | | **Dose relationship** | Helps determine appropriate dose and dosing interval | Determines relationship between dose/concentration and response | | **Clinical application** | Dose optimization and therapeutic drug monitoring | Understanding therapeutic and adverse effects | | **Simple concept** | 💊 **Drug → Body** | 🎯 **Drug → Effect** | generate an image regreading this
An educational infographic comparing Pharmacokinetics (PK) and Pharmacodynamics (PD). Left side titled "Pharmacokinetics (PK)" with icon of a pill entering a human body outline, labeled "Drug -> Body", showing ADME processes (Absorption, Distribution, Metabolism, Excretion) as four connected steps, with key parameters listed: Cmax, Tmax, AUC, Vd, CL, t1/2. Right side titled "Pharmacodynamics (PD)" with icon of a drug molecule binding to a receptor on a cell, labeled "Drug -> Effect", showing a dose-response curve graph, with key parameters listed: Emax, EC50, Potency, Efficacy. Clean medical textbook style diagram, two clearly divided panels, labeled sections, professional color scheme (blue for PK, orange/red for PD), simple clear typography.
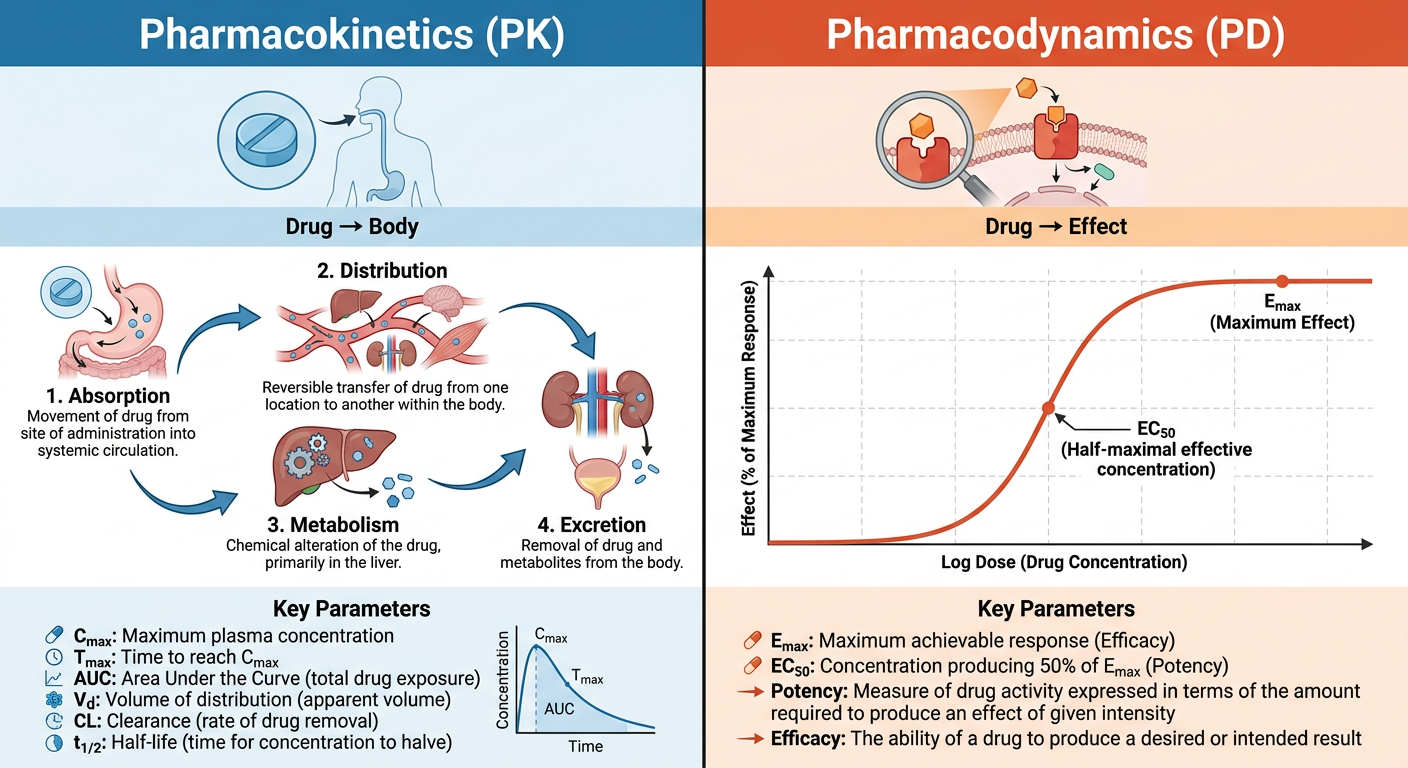
- Pharmacokinetics (PK) - ADME processes: Absorption, Distribution, Metabolism, Excretion, and how each is measured/influenced.
- PK parameters in depth: Cmax, Tmax, AUC, Volume of distribution (Vd), Clearance (CL), half-life (t½), bioavailability, first-order vs zero-order kinetics.
- Pharmacodynamics (PD) - Drug-receptor interactions: Types of receptors, agonists/antagonists, signal transduction.
- PD parameters in depth: Emax, EC50, potency vs efficacy, dose-response curves, therapeutic index.
- Clinical applications: Therapeutic drug monitoring, dose optimization, individualizing dosing regimens (renal/hepatic impairment).
- PK-PD integration: How PK and PD relate together to determine drug dosing regimens and effect over time (e.g., PK/PD modeling).
- Special populations: How PK/PD differs in pediatrics, geriatrics, pregnancy, and organ dysfunction.
Which topic should I go into detail on next?
- Pharmacokinetics (PK) - ADME processes: Absorption, Distribution, Metabolism, Excretion, and how each is measured/influenced.
- PK parameters in depth: Cmax, Tmax, AUC, Volume of distribution (Vd), Clearance (CL), half-life (t½), bioavailability, first-order vs zero-order kinetics.
- Pharmacodynamics (PD) - Drug-receptor interactions: Types of receptors, agonists/antagonists, signal transduction.
- PD parameters in depth: Emax, EC50, potency vs efficacy, dose-response curves, therapeutic index.
- Clinical applications: Therapeutic drug monitoring, dose optimization, individualizing dosing regimens (renal/hepatic impairment).
- PK-PD integration: How PK and PD relate together to determine drug dosing regimens and effect over time (e.g., PK/PD modeling).
- Special populations: How PK/PD differs in pediatrics, geriatrics, pregnancy, and organ dysfunction.
download the above image
mkdir -p /tmp/workspace/pk-pd-image && curl -sL "https://cdn.orris.care/image-gen/6d48934e5cde4306858c58ef4ee1acc2.png" -o /tmp/workspace/pk-pd-image/PK_vs_PD_infographic.png && ls -la /tmp/workspace/pk-pd-image/
PK vs PD infographic
Image · PNG
Factors Affecting Drug Absorption 1. Drug-related factors Lipid solubility Molecular size Particle size Degree of ionization pKa of the drug Drug stability 2. Physiological factors Gastrointestinal pH Gastric emptying Intestinal motility Surface area Blood flow Presence of food Age and disease conditions 3. Formulation-related factors Dosage form Disintegration Dissolution rate Excipients Particle size Drug-release characteristics generate an image regreading this
An educational medical infographic titled "Factors Affecting Drug Absorption" organized into three clearly divided columns/panels: Panel 1 - "Drug-Related Factors" (with a pill/molecule icon): lists Lipid solubility, Molecular size, Particle size, Degree of ionization, pKa of the drug, Drug stability. Panel 2 - "Physiological Factors" (with a human digestive system icon): lists Gastrointestinal pH, Gastric emptying, Intestinal motility, Surface area, Blood flow, Presence of food, Age and disease conditions. Panel 3 - "Formulation-Related Factors" (with a tablet/capsule and mortar-pestle icon): lists Dosage form, Disintegration, Dissolution rate, Excipients, Particle size, Drug-release characteristics. Clean medical textbook style diagram, three columns each with a distinct header color (blue, green, orange), bullet point lists under each heading, simple clear typography, professional pharmacology chart style.
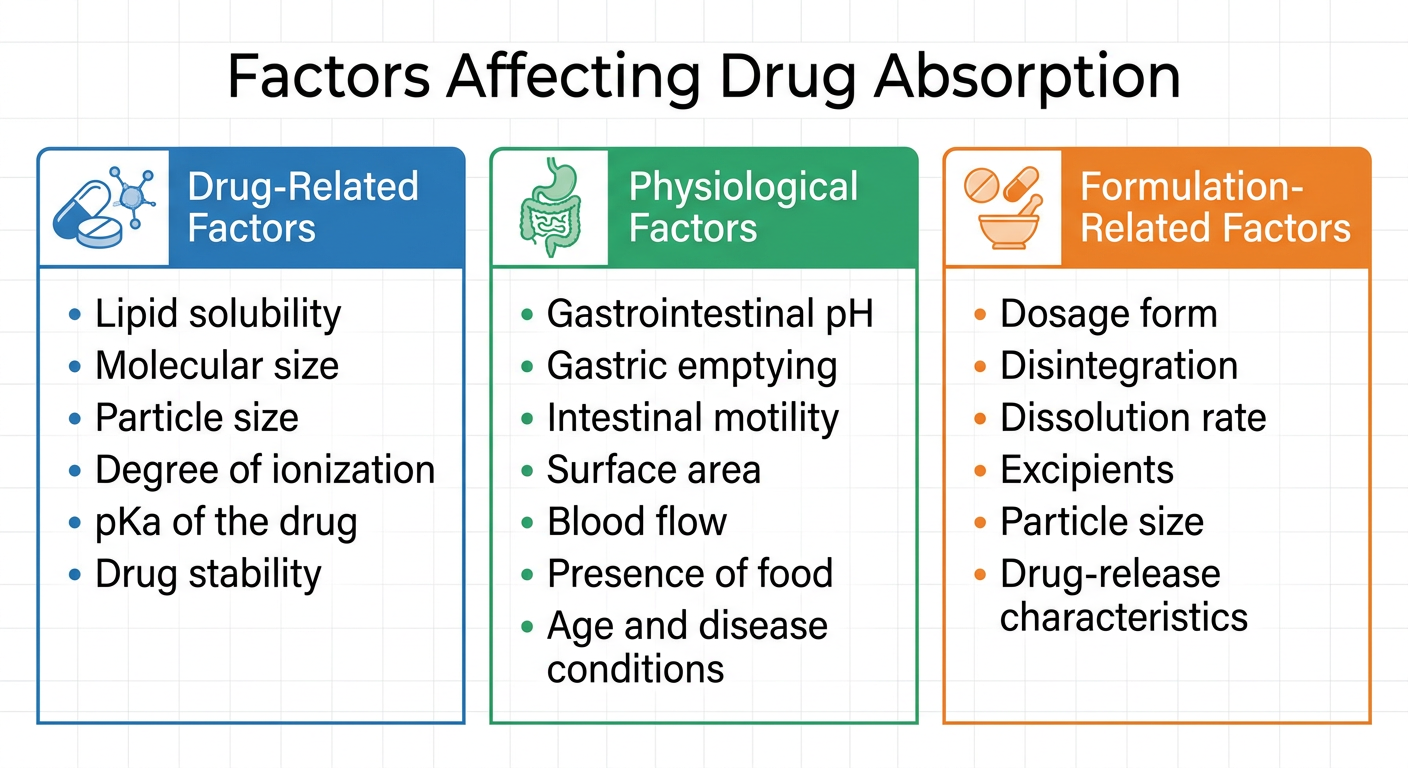
- Drug-related factors: lipid solubility, molecular size, particle size, degree of ionization, pKa, drug stability
- Physiological factors: GI pH, gastric emptying, intestinal motility, surface area, blood flow, presence of food, age/disease conditions
- Formulation-related factors: dosage form, disintegration, dissolution rate, excipients, particle size, drug-release characteristics
download the above image
mkdir -p /tmp/workspace/drug-absorption-image && curl -sL "https://cdn.orris.care/image-gen/f7ff5dfd6cde44aa9240863df30b8237.png" -o /tmp/workspace/drug-absorption-image/Factors_Affecting_Drug_Absorption.png && ls -la /tmp/workspace/drug-absorption-image/
Factors Affecting Drug Absorption
Image · PNG
F= AUC IV ×Dose EV AUC EV ×Dose IV Where: F = Absolute bioavailability AUC = Area under plasma concentration–time curve EV = Extravascular administration IV = Intravenous administration in an image format
A clean educational pharmacology diagram showing the formula for Absolute Bioavailability (F). Display the mathematical equation clearly: F = (AUC_EV x Dose_IV) / (AUC_IV x Dose_EV) Below the formula, include a legend box defining each term: F = Absolute bioavailability AUC = Area under the plasma concentration-time curve EV = Extravascular administration (e.g., oral) IV = Intravenous administration Include a small supporting graph showing two plasma concentration vs time curves, one labeled "IV" with a larger area under the curve, and one labeled "EV (oral)" with a smaller area under the curve, both shaded to represent AUC. Clean white background, professional medical textbook style, clear bold typography for the formula, blue and orange color scheme for the two curves.
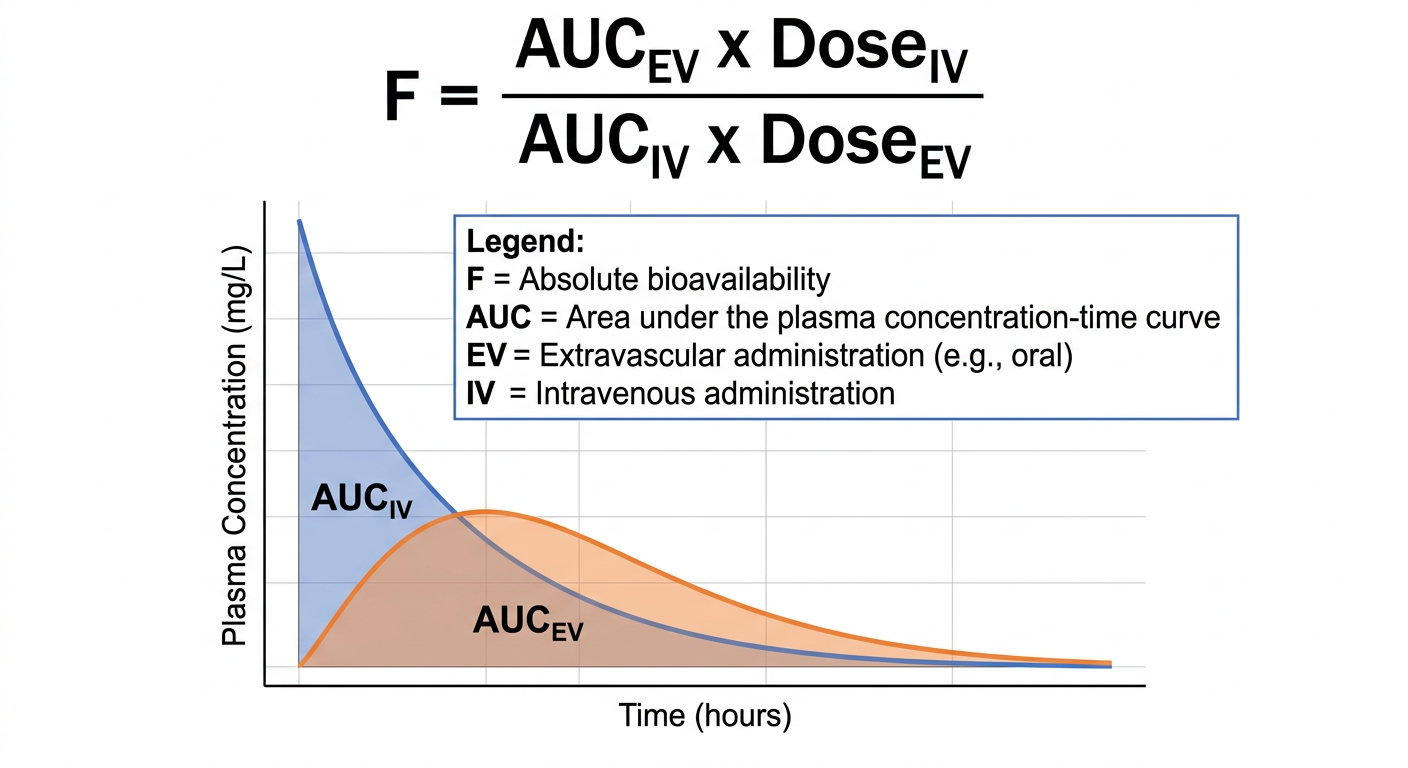
download the above image
mkdir -p /tmp/workspace/bioavailability-image && curl -sL "https://cdn.orris.care/image-gen/f1ba5df245444450b23f0e15601fa1f2.png" -o /tmp/workspace/bioavailability-image/Absolute_Bioavailability_Formula.png && ls -la /tmp/workspace/bioavailability-image/
Absolute Bioavailability Formula
Image · PNG
F relative = AUC Reference AUC Test × Dose Test Dose Reference Where: AUCₜₑₛₜ = AUC of the test formulation AUCᵣₑ𝒻 = AUC of the reference formulation Dose = Dose administered from each formulation generate an image regrading this
A clean educational pharmacology diagram showing the formula for Relative Bioavailability (F_relative). Display the mathematical equation clearly: F_relative = (AUC_Test / AUC_Reference) x (Dose_Reference / Dose_Test) Below the formula, include a legend box defining each term: F_relative = Relative bioavailability AUC_Test = Area under plasma concentration-time curve of the test formulation AUC_Reference = Area under plasma concentration-time curve of the reference formulation Dose = Dose administered from each formulation Include a small supporting graph showing two plasma concentration vs time curves, one labeled "Test formulation" and one labeled "Reference formulation", both shaded to represent their respective AUC areas. Clean white background, professional medical textbook style, clear bold typography for the formula, green and purple color scheme for the two curves.
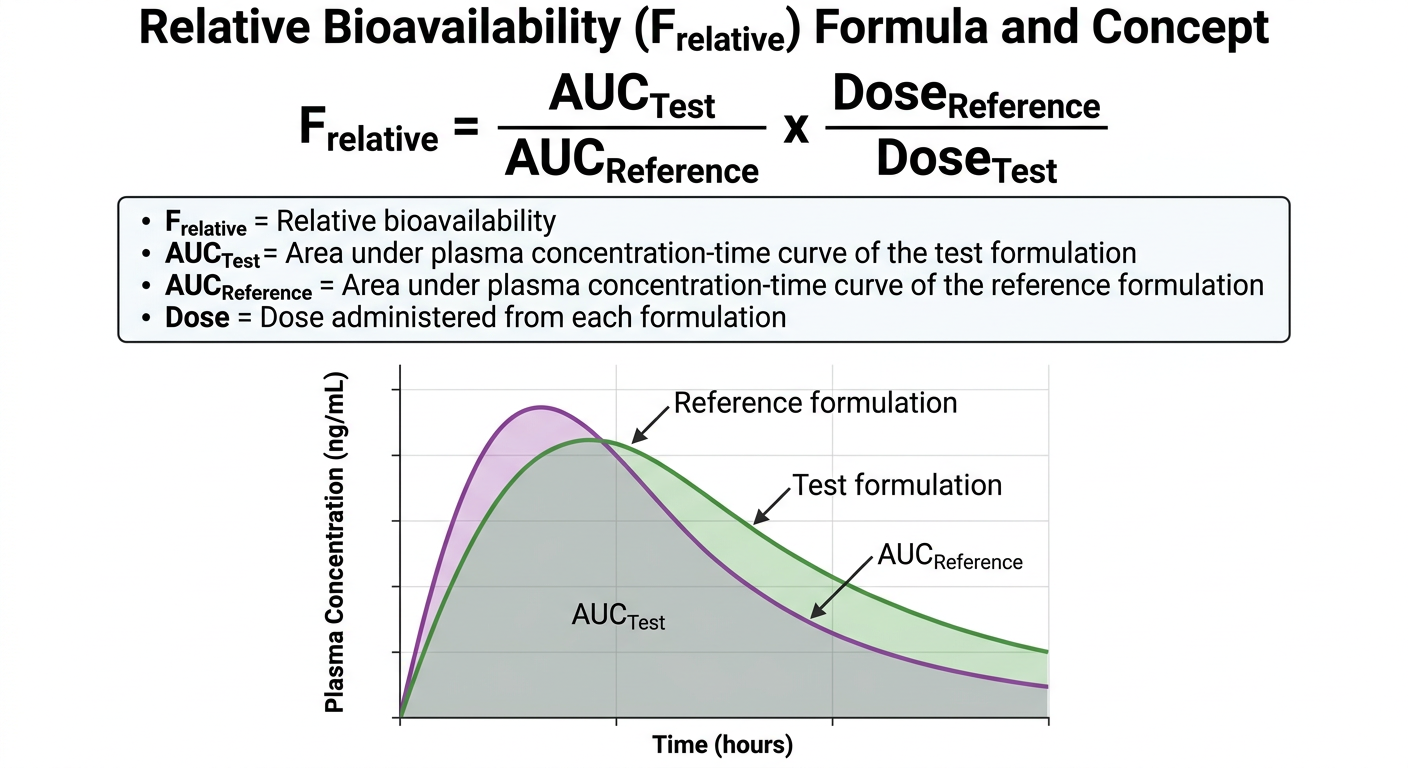
download the above image
mkdir -p /tmp/workspace/relative-bioavailability-image && curl -sL "https://cdn.orris.care/image-gen/989e4836868f4cf3a3f432a6dfb39cfb.png" -o /tmp/workspace/relative-bioavailability-image/Relative_Bioavailability_Formula.png && ls -la /tmp/workspace/relative-bioavailability-image/
Relative Bioavailability Formula
Image · PNG
F=F a ×F g ×F h Where: F = Overall bioavailability Fₐ = Fraction absorbed Fᵍ = Fraction escaping intestinal metabolism Fₕ = Fraction escaping hepatic first-pass metabolism generate an image
A clean educational pharmacology diagram showing the formula for Overall Bioavailability (F) as a product of three fractions. Display the mathematical equation clearly: F = Fa x Fg x Fh Below the formula, include a legend box defining each term: F = Overall bioavailability Fa = Fraction absorbed from the GI tract Fg = Fraction escaping intestinal (gut wall) metabolism Fh = Fraction escaping hepatic first-pass metabolism Include a simple visual flow diagram showing a drug's journey: an oral tablet in the intestinal lumen (labeled Fa - absorption across gut wall), then the intestinal wall/enterocytes (labeled Fg - gut metabolism), then an arrow to the liver via the portal vein (labeled Fh - hepatic first-pass metabolism), finally reaching the systemic circulation/bloodstream. Clean white background, professional medical textbook style, clear bold typography for the formula, sequential color-coded stages (orange, teal, purple) matching each fraction label.
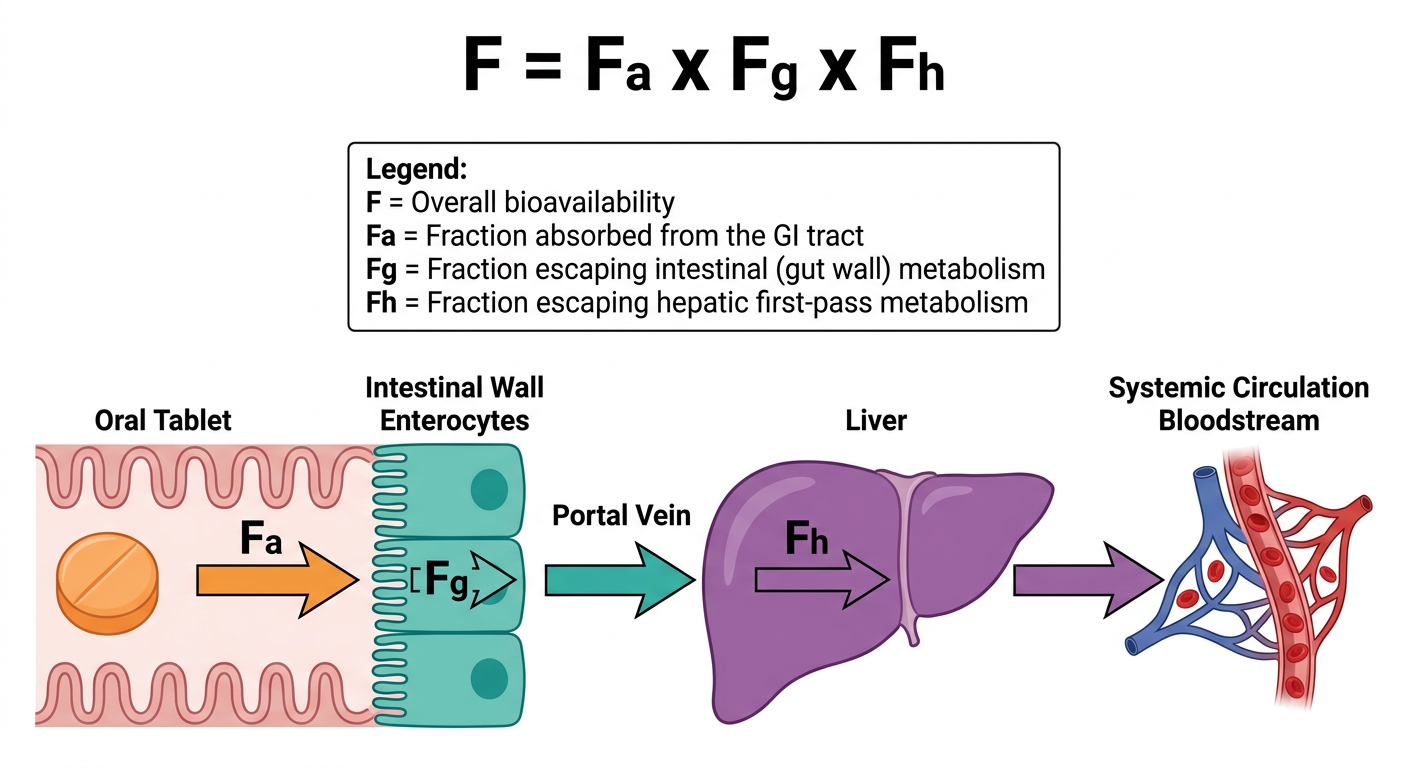
- Fa: fraction actually absorbed across the intestinal wall
- Fg: fraction escaping metabolism within the gut wall (enterocytes)
- Fh: fraction escaping hepatic first-pass metabolism after reaching the liver via the portal vein
download the above image
mkdir -p /tmp/workspace/overall-bioavailability-image && curl -sL "https://cdn.orris.care/image-gen/cee33c388c6d4c4abb3619ba182ac1eb.png" -o /tmp/workspace/overall-bioavailability-image/Overall_Bioavailability_Formula.png && ls -la /tmp/workspace/overall-bioavailability-image/
Overall Bioavailability Formula
Image · PNG
Factors Affecting First-Pass Effect Hepatic enzyme activity Intestinal metabolism Hepatic blood flow Drug dose Drug–drug interactions Enzyme induction or inhibition Genetic variation in metabolic enzymes Liver disease generate an image
A clean educational pharmacology infographic titled "Factors Affecting First-Pass Effect". Show a central icon of the liver with a drug molecule passing through it, surrounded by eight labeled factors arranged around it in a radial or list layout: Hepatic enzyme activity Intestinal metabolism Hepatic blood flow Drug dose Drug-drug interactions Enzyme induction or inhibition Genetic variation in metabolic enzymes Liver disease Each factor in its own labeled box or bubble connected to the central liver icon with a line. Clean white background, professional medical textbook style, clear bold typography, organized radial or grid layout, blue and teal color scheme.
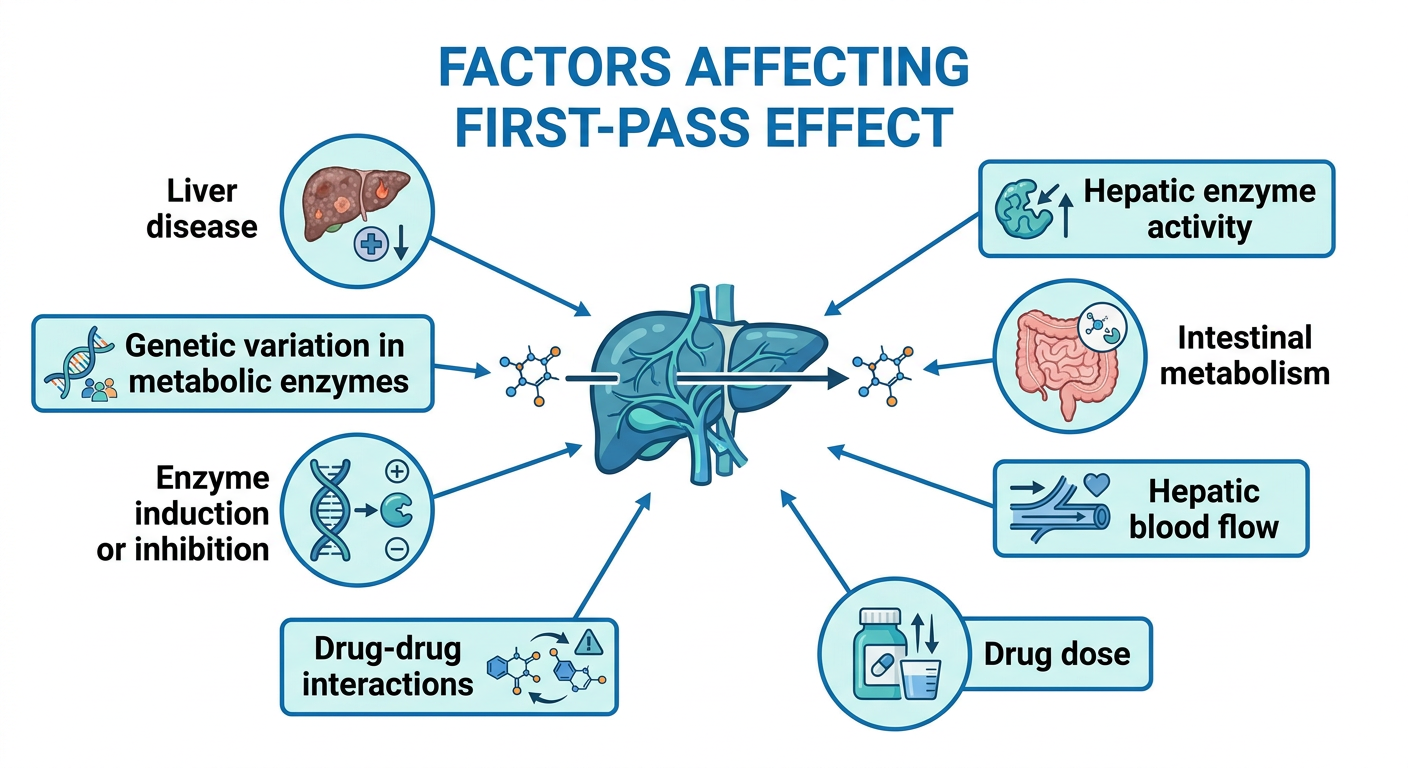
- Hepatic enzyme activity
- Intestinal metabolism
- Hepatic blood flow
- Drug dose
- Drug-drug interactions
- Enzyme induction or inhibition
- Genetic variation in metabolic enzymes
- Liver disease
download the above image
mkdir -p /tmp/workspace/first-pass-effect-image && curl -sL "https://cdn.orris.care/image-gen/0a17c5854bb14a90ae01b7d879006083.png" -o /tmp/workspace/first-pass-effect-image/Factors_Affecting_First_Pass_Effect.png && ls -la /tmp/workspace/first-pass-effect-image/
Factors Affecting First Pass Effect
Image · PNG
Formula $$ \boxed{V_d=\frac{\text{Amount of drug in the body}}{\text{Plasma drug concentration}}} $$ For an IV bolus: $$ \boxed{V_d=\frac{\text{Dose}}{C_0}} $$ Where: Vd = Apparent volume of distribution Dose = Amount of drug administered C₀ = Initial plasma drug concentration generate an image
A clean educational pharmacology diagram showing the formula for Volume of Distribution (Vd). Display two boxed mathematical equations clearly: Vd = (Amount of drug in the body) / (Plasma drug concentration) For an IV bolus: Vd = Dose / C0 Below the formulas, include a legend box defining each term: Vd = Apparent volume of distribution Dose = Amount of drug administered C0 = Initial plasma drug concentration Include a simple supporting visual showing a human body outline with drug molecules distributed in bloodstream and tissues, and a small graph showing plasma concentration vs time with C0 marked at time zero on the y-axis (extrapolated back from the elimination curve). Clean white background, professional medical textbook style, clear bold typography for the boxed formulas, blue color scheme.
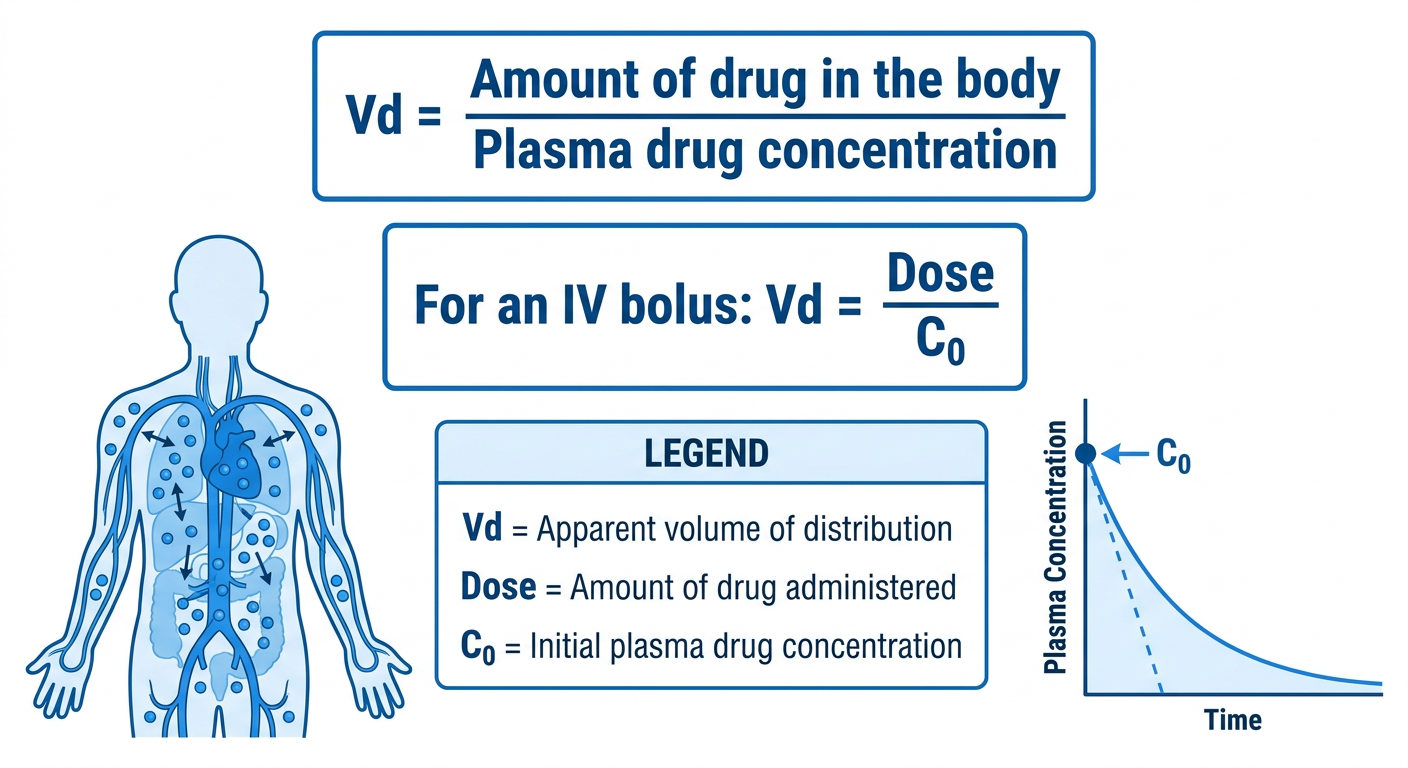
- General: Vd = (Amount of drug in the body) / (Plasma drug concentration)
- For IV bolus: Vd = Dose / C₀
download the above image
mkdir -p /tmp/workspace/volume-of-distribution-image && curl -sL "https://cdn.orris.care/image-gen/f7c4fba5be824e7a946b947e69d238f0.png" -o /tmp/workspace/volume-of-distribution-image/Volume_of_Distribution_Formula.png && ls -la /tmp/workspace/volume-of-distribution-image/
Volume of Distribution Formula
Image · PNG
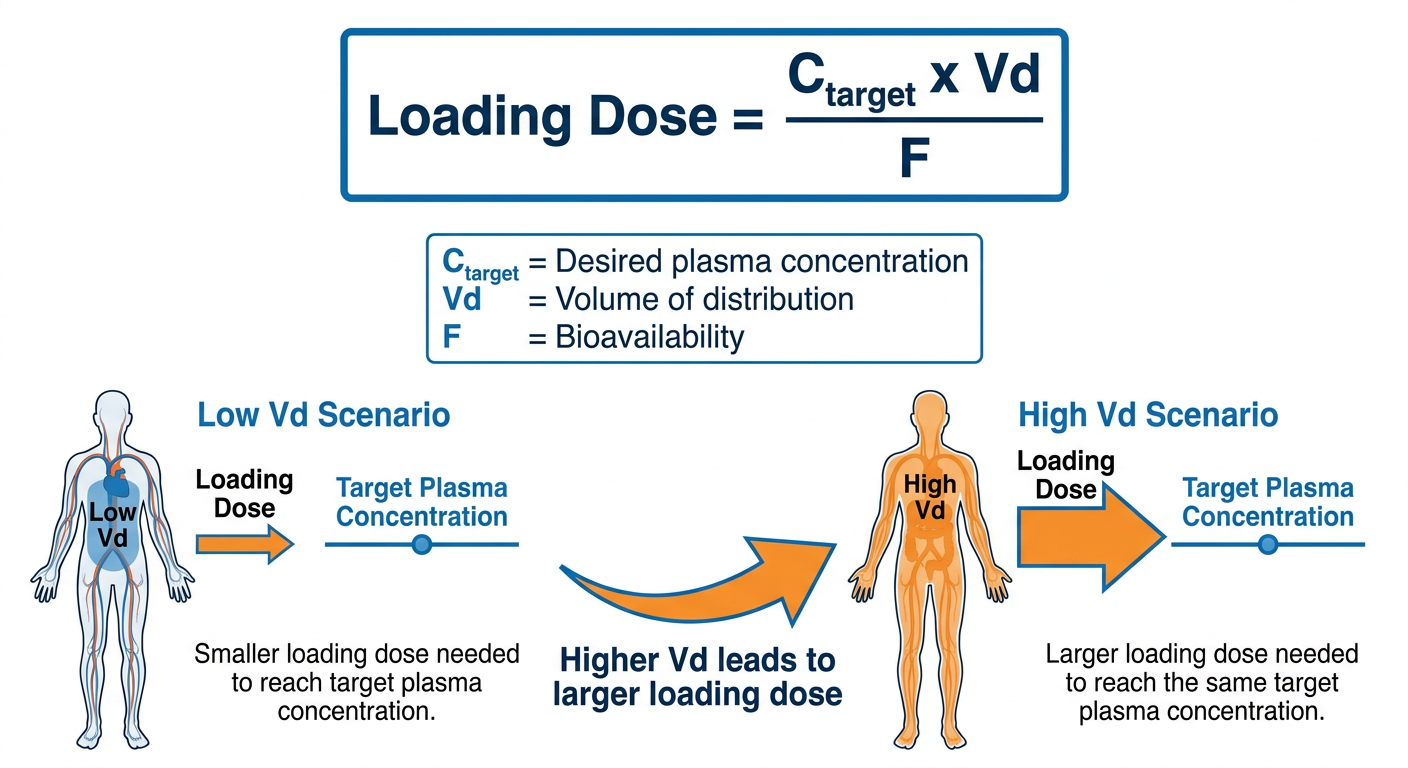
Relationship with Loading Dose $$ \boxed{Loading\ Dose=\frac{C_{target}\times V_d}{F}} $$ Where: Ctarget = Desired plasma concentration Vd = Volume of distribution F = Bioavailability Higher Vd → Generally requires a larger loading dose to achieve the desired plasma concentration. generate an image
A clean educational pharmacology diagram showing the formula for Loading Dose and its relationship with Volume of Distribution. Display the boxed mathematical equation clearly: Loading Dose = (C_target x Vd) / F Below the formula, include a legend box defining each term: C_target = Desired plasma concentration Vd = Volume of distribution F = Bioavailability Include a supporting visual showing two side-by-side scenarios: one with a "Low Vd" body outline showing a smaller loading dose needed to reach target plasma concentration, and one with a "High Vd" body outline (drug distributed extensively into tissues) showing a larger loading dose needed to reach the same target plasma concentration. Include an arrow or note stating "Higher Vd leads to larger loading dose". Clean white background, professional medical textbook style, clear bold typography for the boxed formula, blue and orange color scheme.
download the above image
mkdir -p /tmp/workspace/loading-dose-image && curl -sL "https://cdn.orris.care/image-gen/7738f0bb13074b0fabc1a59c5bc8a1dd.png" -o /tmp/workspace/loading-dose-image/Loading_Dose_Formula.png && ls -la /tmp/workspace/loading-dose-image/
Loading Dose Formula
Image · PNG
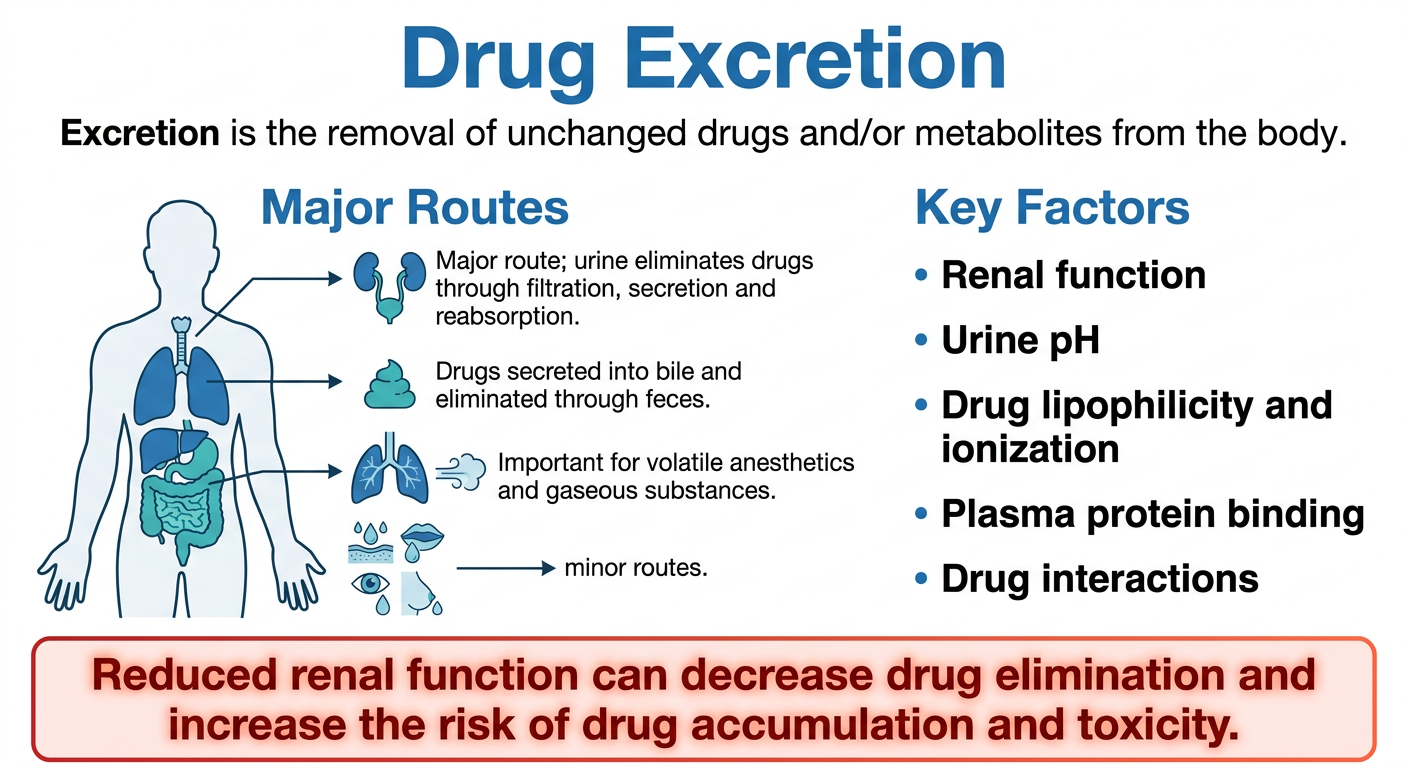
Excretion is the removal of unchanged drugs and/or metabolites from the body. Major Routes Route Key Information Renal Major route; urine eliminates drugs through filtration, secretion and reabsorption Biliary/Fecal Drugs are secreted into bile and eliminated through feces Pulmonary Important for volatile anesthetics and gaseous substances Other routes Sweat, saliva, tears and breast milk Key Factors Renal function Urine pH Drug lipophilicity and ionization Plasma protein binding Drug interactions Key point: Reduced renal function can decrease drug elimination and increase the risk of drug accumulation and toxicity. generate an image
A clean educational pharmacology infographic titled "Drug Excretion". Include a definition line at top: "Excretion is the removal of unchanged drugs and/or metabolites from the body." Section 1 - "Major Routes" as a table or labeled diagram with a human body outline showing: Renal (kidneys icon) - Major route; urine eliminates drugs through filtration, secretion and reabsorption Biliary/Fecal (liver and intestine icon) - Drugs secreted into bile and eliminated through feces Pulmonary (lungs icon) - Important for volatile anesthetics and gaseous substances Other routes (sweat, saliva, tears, breast milk icons) - minor routes Section 2 - "Key Factors" as a bulleted list: Renal function Urine pH Drug lipophilicity and ionization Plasma protein binding Drug interactions Bottom - a highlighted key point box in red/orange: "Reduced renal function can decrease drug elimination and increase the risk of drug accumulation and toxicity." Clean white background, professional medical textbook style, clear bold typography, organized layout with body diagram on left and factors list on right, blue and teal color scheme with red highlight box.
download the above image
mkdir -p /tmp/workspace/drug-excretion-image && curl -sL "https://cdn.orris.care/image-gen/ee6cc8056bd146a59b824a2958cf7266.png" -o /tmp/workspace/drug-excretion-image/Drug_Excretion.png && ls -la /tmp/workspace/drug-excretion-image/
Drug Excretion
Image · PNG
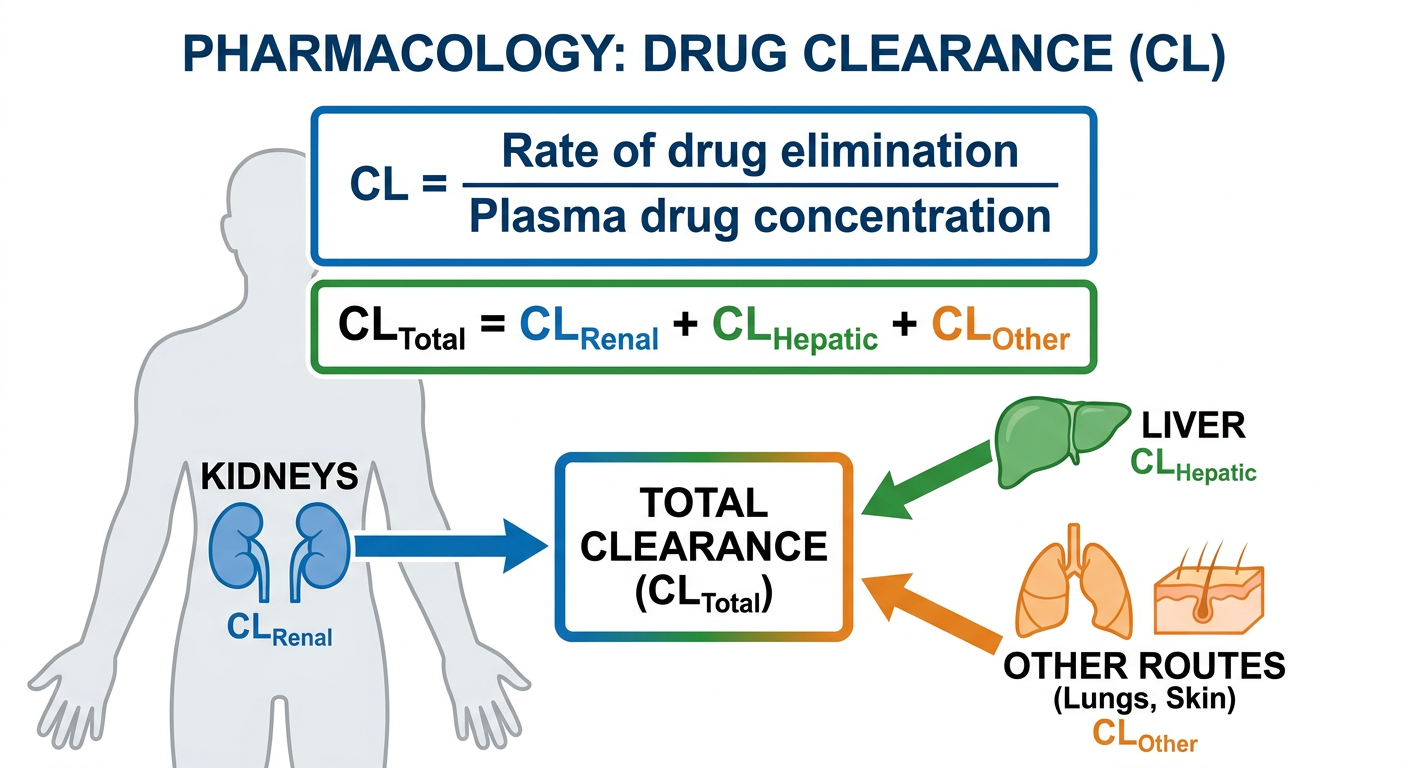
Formula $$ \boxed{CL=\frac{\text{Rate of drug elimination}}{\text{Plasma drug concentration}}} $$ Major Components CL Total =CL Renal +CL Hepatic +CL Other generate image
A clean educational pharmacology diagram showing the formula for Clearance (CL). Display the boxed mathematical equation clearly: CL = (Rate of drug elimination) / (Plasma drug concentration) Below it, show the "Major Components" breakdown as a boxed equation: CL_Total = CL_Renal + CL_Hepatic + CL_Other Include a simple supporting visual diagram showing a human body outline with three organs highlighted and connected by arrows converging into a "Total Clearance" box: kidneys labeled CL_Renal, liver labeled CL_Hepatic, and other minor routes (lungs, skin) labeled CL_Other. Clean white background, professional medical textbook style, clear bold typography for the boxed formulas, blue, green and orange color scheme for the three clearance components.
download the above the
mkdir -p /tmp/workspace/clearance-image && curl -sL "https://cdn.orris.care/image-gen/1c7ce9589e8d47ae80058851797c5f3f.png" -o /tmp/workspace/clearance-image/Clearance_Formula.png && ls -la /tmp/workspace/clearance-image/
Clearance Formula
Image · PNG
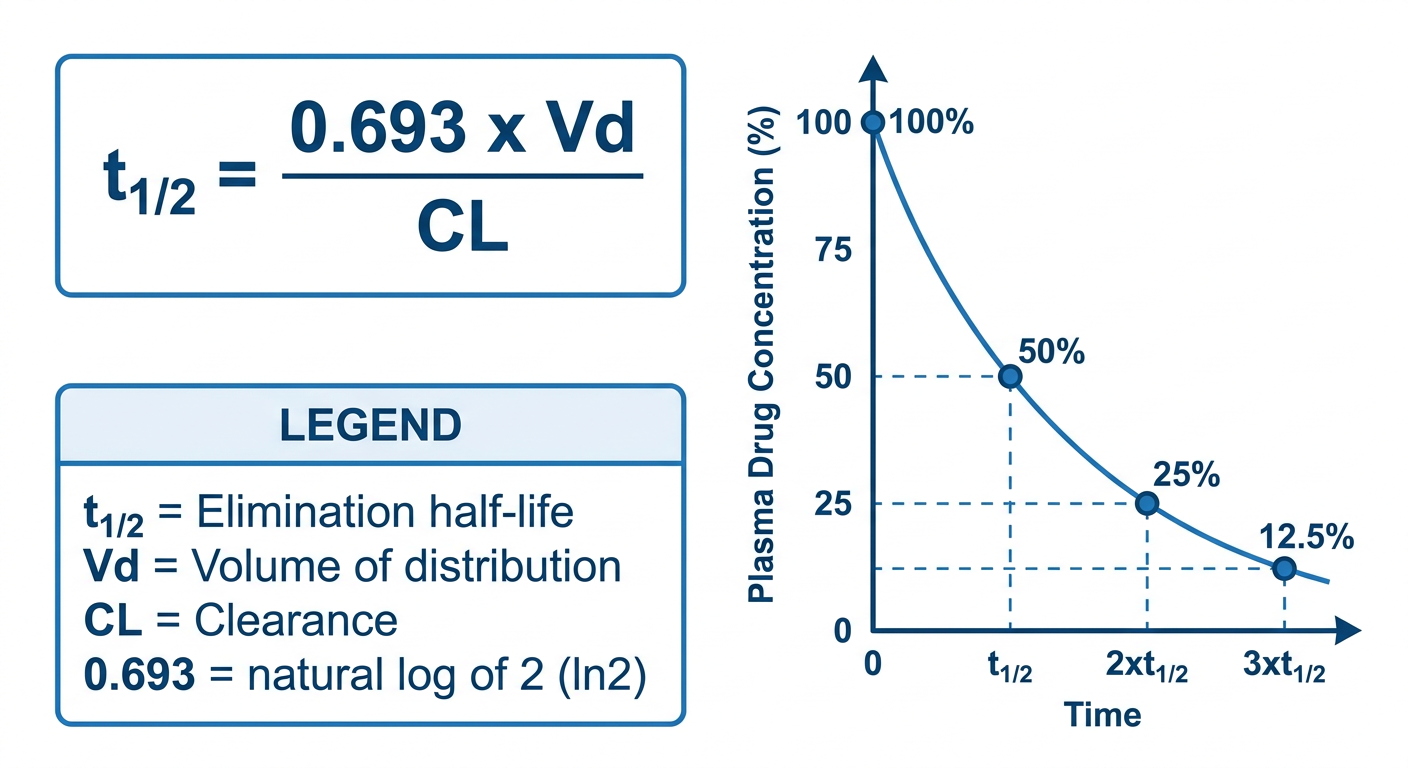
Formula t 1/2 = CL 0.693×V d generqate image
A clean educational pharmacology diagram showing the formula for elimination Half-Life (t1/2). Display the boxed mathematical equation clearly: t1/2 = (0.693 x Vd) / CL Below the formula, include a legend box defining each term: t1/2 = Elimination half-life Vd = Volume of distribution CL = Clearance 0.693 = natural log of 2 (ln2) Include a simple supporting graph showing plasma drug concentration versus time on a curve, with markers showing the concentration halving at each successive half-life interval (100% to 50% to 25% to 12.5%), labeled with time points t1/2, 2xt1/2, 3xt1/2. Clean white background, professional medical textbook style, clear bold typography for the boxed formula, blue color scheme.
download the image
mkdir -p /tmp/workspace/half-life-image && curl -sL "https://cdn.orris.care/image-gen/1b4c41f7d16f4c8f83c04ea069854dae.png" -o /tmp/workspace/half-life-image/Half_Life_Formula.png && ls -la /tmp/workspace/half-life-image/
Half Life Formula
Image · PNG