
CO2 dissociation curve and haldane effect full details for md exams 10 marks
Reading File
Now let me search the medical library for CO2 dissociation curve and Haldane effect simultaneously.
Finding Sources
Finding Sources
Finding Sources
Reading File
Excellent content found. Let me read more of the Guyton section and also pull from other key textbooks in parallel.
Reading File
Reading File
Reading File
Now let me read the Fishman's Haldane effect section and the Murray & Nadel CO2 section, and also fetch the key diagram images.
Reading File
Reading File
Loading Image
Loading Image
I now have comprehensive, authoritative content from multiple major textbooks (Guyton & Hall, Fishman's, Murray & Nadel) with excellent diagrams. Let me also fetch the Murray & Nadel CO2 dissociation curve image and the Guyton basic dissociation curve, then compile the full answer.
Loading Image
Loading Image
I now have all four key diagrams and comprehensive textbook content. Let me compile the complete MD exam answer.
CO2 Dissociation Curve and the Haldane Effect
1. Transport of CO2 in Blood - Overview
CO2 is produced in tissues and must be transported to the lungs for elimination. Unlike O2, CO2 is carried in three forms:
| Form | % of Total CO2 Transported |
|---|---|
| Dissolved CO2 (in plasma + RBC water) | ~5% |
| Bicarbonate (HCO3-) | ~70% |
| Carbamino compounds (mainly carbaminohemoglobin) | ~25% (functionally ~20% under normal conditions) |
1a. Dissolved CO2
CO2 is 20 times more soluble in aqueous solution than O2, yet dissolved CO2 still accounts for only ~5% of total transport. Critically, dissolved CO2 is the only form that can cross the alveolar-capillary membrane, so all other forms must first be converted back to dissolved CO2 for excretion.
1b. Bicarbonate (Most Important - 70%)
Inside RBCs, carbonic anhydrase (CA) catalyzes the rapid hydration of CO2:
CO2 + H2O ⇌ H2CO3 ⇌ H+ + HCO3-
Because CA is absent from plasma, this reaction occurs predominantly inside the RBC. HCO3- then exits into plasma in exchange for Cl- (the chloride shift, or Hamburger phenomenon) to maintain electrical neutrality. The H+ released is buffered by hemoglobin. If carbonic anhydrase is blocked (e.g., by acetazolamide), tissue PCO2 can rise to ~80 mmHg instead of the normal 45 mmHg.
1c. Carbaminohemoglobin (~20-25%)
CO2 combines directly with the free amino (-NH2) groups on hemoglobin to form carbamino compounds:
Hb-NH2 + CO2 ⇌ Hb-NHCOOH (carbamic acid) ⇌ Hb-NHCOO- + H+
Only the N-terminal amino groups of hemoglobin participate in CO2 exchange. A small amount also binds plasma proteins (less significant - plasma proteins are only 1/4 the quantity of Hb).
2. CO2 Dissociation Curve
Definition: A plot of total CO2 content in blood (in all three forms, expressed as vol% or mL/100 mL) on the Y-axis against the partial pressure of CO2 (PCO2, in mmHg) on the X-axis.
Fig. 1 - Basic CO2 dissociation curve (Guyton & Hall):
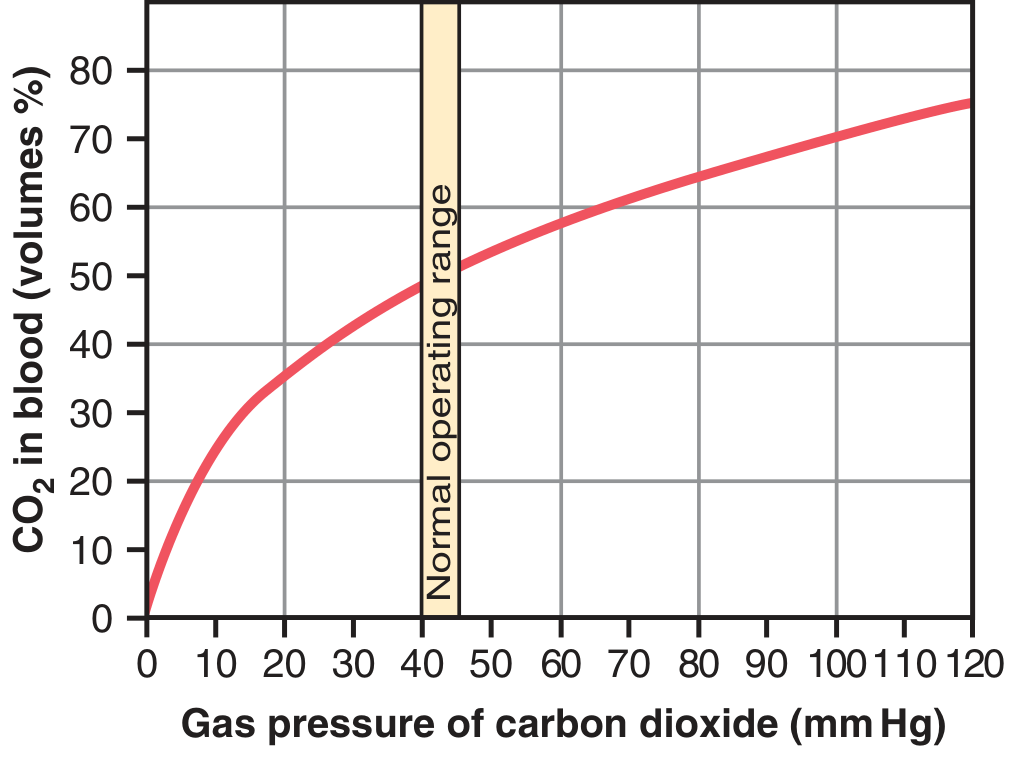
Figure 41.14 from Guyton and Hall Textbook of Medical Physiology - CO2 dissociation curve
Key Features of the CO2 Dissociation Curve:
-
Shape: Steep and nearly linear in the physiologic range (unlike the S-shaped O2 dissociation curve). This near-linearity means that small changes in PCO2 produce relatively larger changes in CO2 content compared to O2.
-
Normal operating range: PCO2 of 40 mmHg (arterial) to 45 mmHg (venous). The CO2 content rises from ~48 vol% venous to ~52 vol% as blood passes through tissues; it falls back to ~48 vol% in the lungs. Only 4 vol% of the total ~50 vol% is exchanged per cycle.
-
Steeper than O2 curve in working range: This means a small arterial-venous PCO2 difference (~5 mmHg) is sufficient to transport adequate CO2, unlike the large gradient needed for O2.
-
No plateau: The CO2 dissociation curve does not show a flat upper portion; it continues to rise steeply.
-
Contributions of each form: At physiologic PCO2, the individual contributions are:
- Bicarbonate: largest proportion
- Carbamino: second
- Dissolved: smallest (runs as a nearly straight line at the bottom of the graph)
3. Influence of O2 Saturation on the CO2 Curve - The Haldane Effect
Fig. 2 - CO2 dissociation curves at different O2 saturations (Fishman's, Murray & Nadel):
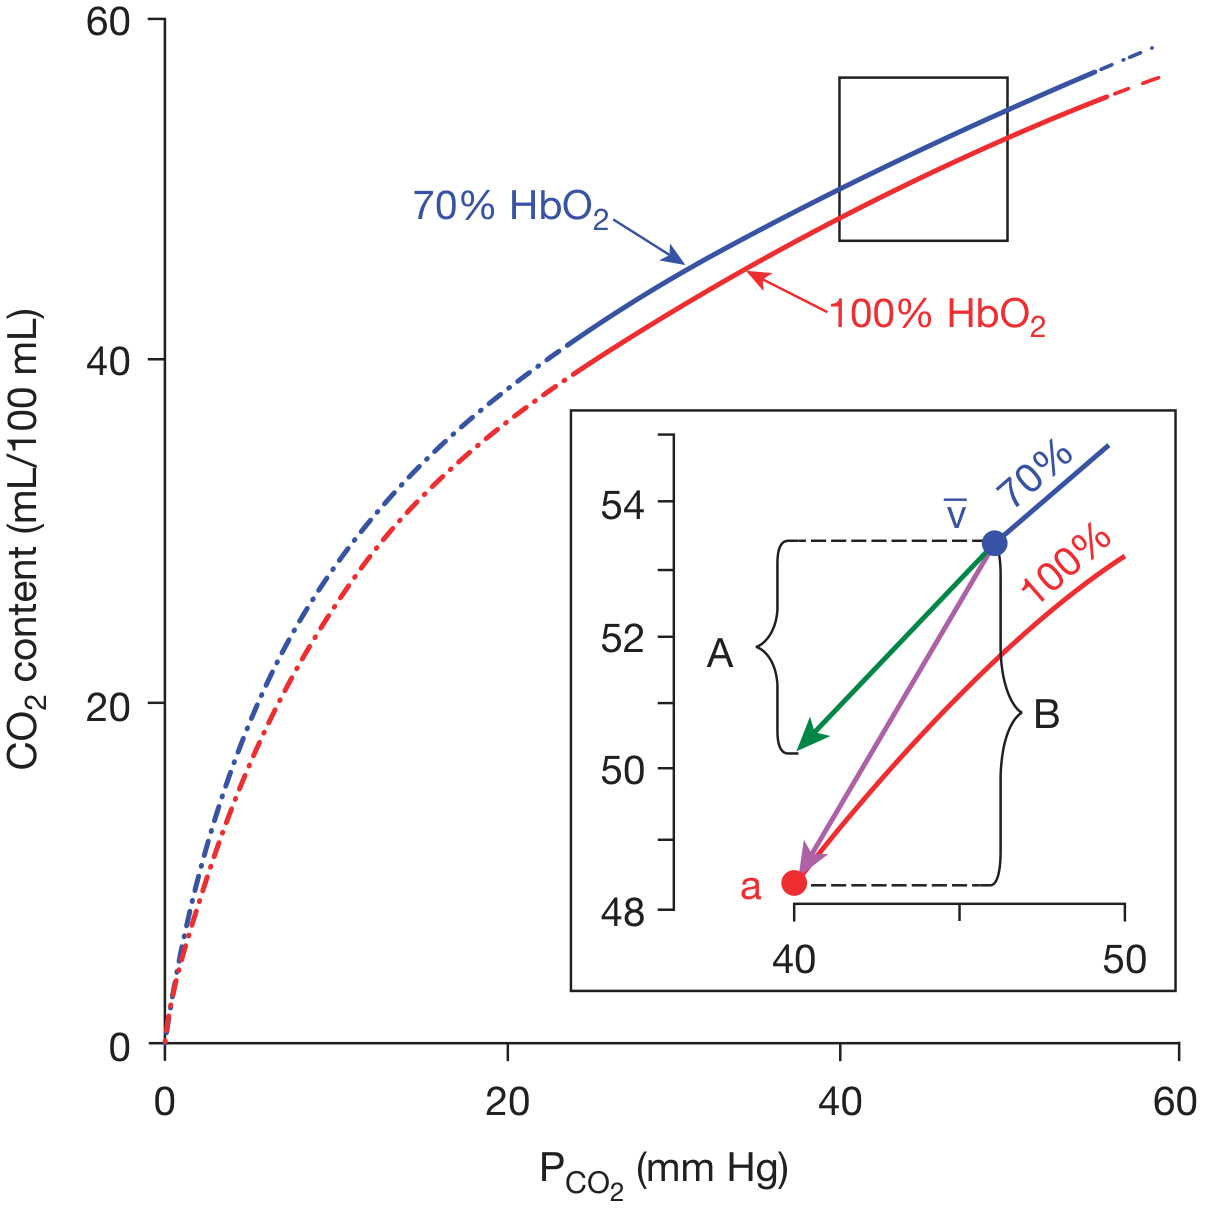
CO2 dissociation curves for 70% HbO2 (venous, blue) and 100% HbO2 (arterial, red). Inset shows the physiologic Haldane operating arc from venous (v) to arterial (a) blood. Bracket A = CO2 exchange without Haldane effect; Bracket B = enhanced CO2 exchange with Haldane effect.
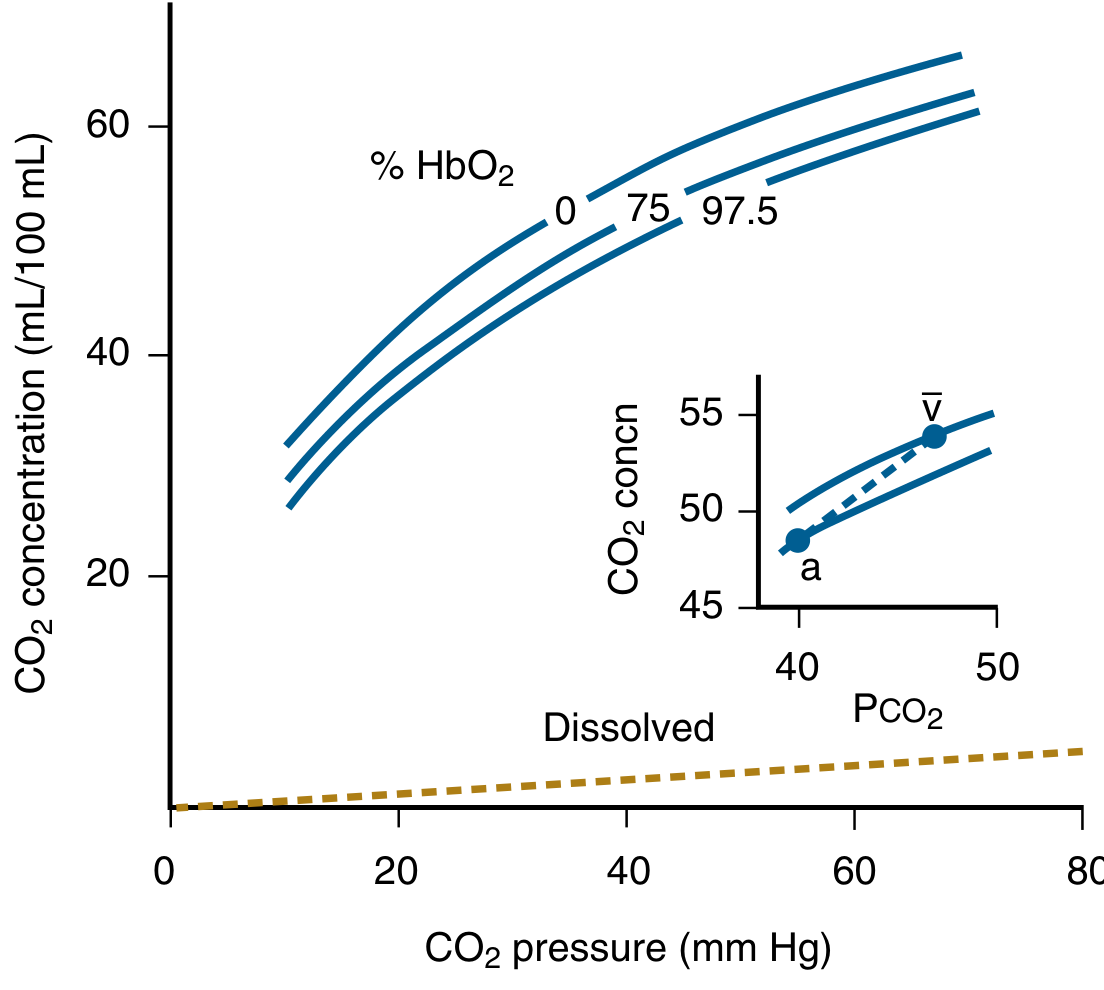
Murray & Nadel - CO2 dissociation curves at 0%, 75%, and 97.5% HbO2 saturation. Note: the lower the O2 saturation, the higher the CO2 content at any given PCO2.
4. The Haldane Effect - Full Details
Definition
The Haldane effect is the observation that oxygenated blood carries less CO2 than deoxygenated blood at any given PCO2. Conversely, deoxygenation of blood increases its capacity to carry CO2.
Stated more mechanistically: Binding of O2 to hemoglobin in the lungs causes hemoglobin to become a stronger acid, displacing CO2 from the blood. Release of O2 in the tissues makes hemoglobin a weaker acid (stronger base), enabling it to bind more CO2.
Mechanisms of the Haldane Effect (Two Pathways)
Mechanism 1: Enhanced Bicarbonate Formation (Oxylabile Buffering)
- In the tissues, hemoglobin releases O2 and becomes deoxyhemoglobin (HHb).
- Deoxyhemoglobin is a stronger base (weaker acid) than oxyhemoglobin (HbO2).
- Therefore, deoxyhemoglobin has a greater capacity to buffer H+ ions released during CO2 hydration (CO2 + H2O → H+ + HCO3-).
- By binding these H+ ions more avidly, deoxyhemoglobin shifts the equilibrium toward greater HCO3- production, allowing more CO2 to be transported as bicarbonate.
- In the lungs, the reverse occurs: O2 binds to Hb → HbO2 becomes a stronger acid → releases H+ → H+ combines with HCO3- → drives the reaction backward → CO2 is regenerated and expelled.
Mechanism 2: Enhanced Carbamino Formation
- Deoxygenation alters the quaternary structure of hemoglobin, increasing the availability of free -NH2 groups (by shifting the equilibrium of terminal amino groups from positively charged NH3+ to uncharged NH2).
- Deoxyhemoglobin therefore binds more CO2 as carbamate than oxyhemoglobin at any given PCO2 (oxylabile carbamate formation).
- In the lungs, O2 binding reverts this structural change, releasing CO2 from carbamate.
"Approximately equal changes in bicarbonate and carbamate concentrations are responsible for the Haldane effect." - Fishman's Pulmonary Diseases and Disorders
Quantitative Significance
Fig. 3 - The Haldane effect illustrated (Guyton & Hall):
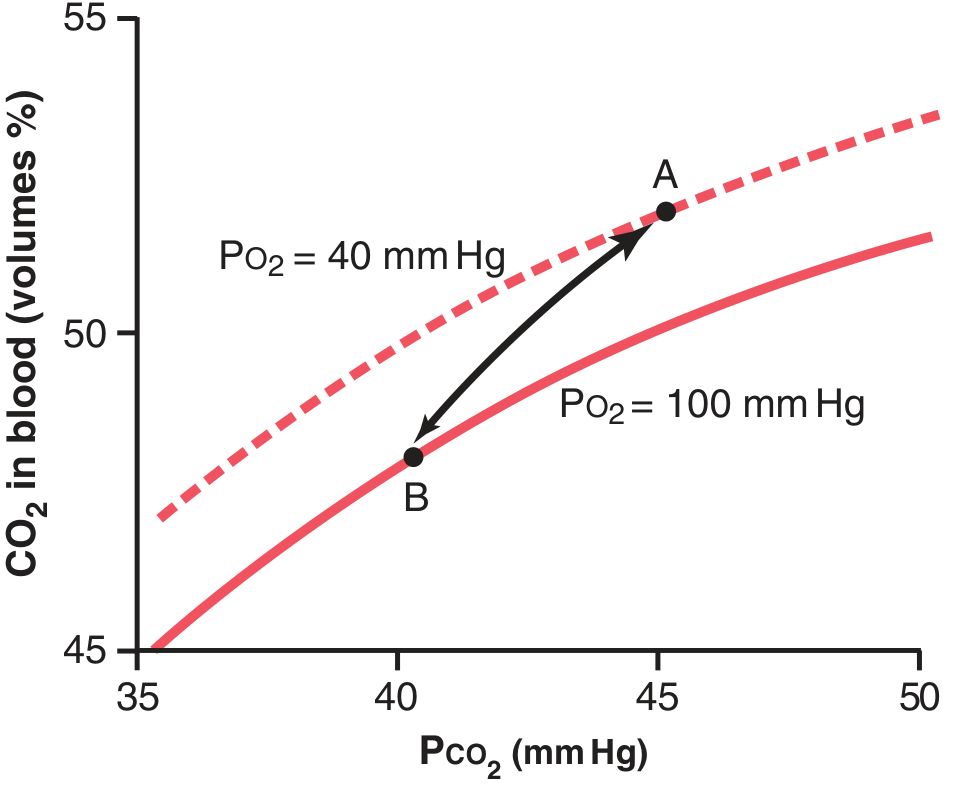
Figure 41.15 (Guyton & Hall) - The arrow represents the Haldane effect on CO2 transport. Without the Haldane shift, CO2 content would fall only from 52 to 50 vol% (2 vol% exchange). With the Haldane shift, it falls to 48 vol% (4 vol% exchange - doubled).
Quantitative analysis:
- At point A (tissues): PCO2 = 45 mmHg, PO2 = 40 mmHg → CO2 content = 52 vol%
- In the lungs, PCO2 falls to 40 mmHg → without Haldane effect, CO2 content would fall to only 50 vol% (loss of 2 vol%)
- With Haldane effect (PO2 rises to 100 mmHg → curve shifts down) → CO2 content falls to 48 vol% (point B)
- This is an additional 2 vol% loss = total 4 vol% CO2 exchange
- Conclusion: The Haldane effect approximately doubles the amount of CO2 exchanged
"The Haldane effect accounts for 40% to 50% of total CO2 exchange in the lung under normal conditions." - Fishman's Pulmonary Diseases and Disorders
Without the Haldane effect, the arterial-venous PCO2 difference would need to be approximately twice the normal value to maintain the same CO2 exchange, resulting in significantly elevated tissue PCO2.
5. Comparison: CO2 vs. O2 Dissociation Curve
| Feature | CO2 Dissociation Curve | O2 Dissociation Curve |
|---|---|---|
| Shape | Nearly linear (steep) | S-shaped (sigmoid) |
| Working range | PCO2 40-45 mmHg | PO2 40-100 mmHg |
| % exchanged per cycle | ~8% of total (~4/50 vol%) | ~25% of total (~5/20 vol%) |
| Physiologic modifier | O2 saturation (Haldane) | CO2/pH/temp/2,3-DPG (Bohr) |
| Clinical relevance | CO2 retention in COPD | Hypoxia, high altitude |
| Plateau | No plateau | Yes (flat upper portion) |
6. Interrelationship: Bohr Effect vs. Haldane Effect
These are two sides of the same biochemical coin:
| Bohr Effect | Haldane Effect | |
|---|---|---|
| Definition | ↑CO2/↓pH shifts O2 curve RIGHT → promotes O2 unloading | O2 binding to Hb displaces CO2 → promotes CO2 unloading |
| Site | Tissue capillaries (O2 release) | Pulmonary capillaries (CO2 release) |
| Molecule affected | O2 transport | CO2 transport |
| Relative importance | Less quantitatively significant | More quantitatively important (doubles CO2 exchange) |
7. Changes in Blood Acidity During CO2 Transport
- Arterial blood pH: ~7.41
- As CO2 is picked up in tissue capillaries → pH falls to ~7.37 (only 0.04 unit change due to buffering by Hb)
- In lungs: CO2 is released → pH returns to 7.41
- During heavy exercise or poor perfusion: pH can fall by as much as 0.50 units, causing significant tissue acidosis
8. Clinical Correlates
-
COPD / CO2 retention: Failure to eliminate CO2 causes hypercapnia and respiratory acidosis. The steep slope of the CO2 dissociation curve means even modest rises in PCO2 dramatically increase blood CO2 content.
-
Carbonic anhydrase inhibitors (e.g., acetazolamide): Block bicarbonate formation in RBCs. Tissue PCO2 can rise to 80 mmHg (nearly double normal). Used clinically for altitude sickness, glaucoma.
-
Anemia: Reduced hemoglobin impairs both carbamino formation and the buffering capacity underlying the Haldane effect, reducing CO2 transport efficiency.
-
The physiologic arc: In practice, blood moves from venous (v: PCO2 ~45, HbO2 ~70%) to arterial (a: PCO2 ~40, HbO2 ~97.5%) states not along a single dissociation curve but along an oblique path between two curves - this is the Haldane operating arc, which amplifies CO2 exchange beyond what a single curve would predict.
Summary Points for Exam
- CO2 is transported as: dissolved (5%), HCO3- (70%), carbamino (25%)
- CO2 dissociation curve is steep, nearly linear in physiologic range (40-45 mmHg)
- Total CO2 in blood ~50 vol%; only 4 vol% exchanged per cycle
- Haldane effect: O2 binding to Hb in lungs → Hb becomes stronger acid → releases H+ → drives HCO3- back to CO2 AND decreases carbamate binding → CO2 released
- Two mechanisms: (i) oxylabile buffering (HCO3- pathway), (ii) oxylabile carbamate formation
- Haldane effect doubles CO2 exchange (from 2 to 4 vol%)
- Haldane effect is quantitatively more important than the Bohr effect
- Haldane accounts for 40-50% of total CO2 exchange in the lung
- Without Haldane effect: arterial-venous PCO2 difference would be twice normal
- Chloride shift (Hamburger effect) accompanies bicarbonate formation to maintain RBC electrical neutrality
Sources:
- Guyton and Hall Textbook of Medical Physiology (Figs. 41.13-41.15, pp. 528-530)
- Fishman's Pulmonary Diseases and Disorders, 2-Volume Set (Ch. 15, pp. 257-259)
- Murray & Nadel's Textbook of Respiratory Medicine (Ch. 10, p. 232)
This is a shared conversation. Sign in to Orris to start your own chat.