
Types of Myocardial infraction
types of myocardial infarction STEMI NSTEMI classification diagram
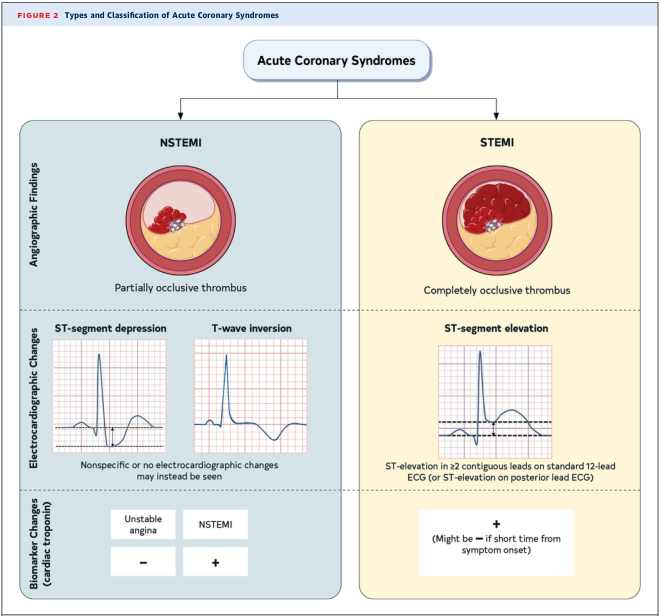
Summary : This figure presents the types and classification of Acute Coronary Syndromes, contrasting NSTEMI (Non-ST-Elevation Myocardial Infarction) and STEMI (ST-Elevation Myocardial Infarction) based on angiographic findings, electrocardiographic changes, and cardiac biomarker changes. flowchart: # Main Categories : • Acute Coronary Syndromes (central node) – Branches into: NSTEMI (left), STEMI (right) # NSTEMI : ## Angiographic Findings : • Illustration of a coronary artery with a partially occlusive thrombus. • Label: "Partially occlusive thrombus" ## Electrocardiographic Changes : • ST-segment depression (example ECG tracing) • T-wave inversion (example ECG tracing) • Note: "Nonspecific or no electrocardiographic changes may instead be seen" ## Biomarker Change (cardiac troponin) : • Unstable angina: negative (–) • NSTEMI: positive (+) # STEMI : ## Angiographic Findings : • Illustration of a coronary artery with a completely occlusive thrombus. • Label: "Completely occlusive thrombus" ## Electrocardiographic Changes : • ST-segment elevation (example ECG tracing) • Note: "ST-elevation in ≥2 contiguous leads on standard 12-lead ECG (or ST-elevation on posterior lead ECG)" ## Biomarker Change (cardiac troponin) : • Positive (+) • Note: "Might be – if short time from symptom onset" # Layout : • Two-column comparison: NSTEMI (blue background, left), STEMI (yellow background, right) • Each column subdivided into three horizontal sections: Angiographic Findings, Electrocardiographic Changes, Biomarker Change # Analysis : • NSTEMI is characterized by partial thrombus occlusion, ST-segment depression or T-wave inversion (or nonspecific ECG changes), and positive cardiac troponin. • STEMI is defined by complete thrombus occlusion, ST-segment elevation on ECG, and positive cardiac troponin (may be negative early after symptom onset). • The figure visually distinguishes the pathophysiology, ECG findings, and biomarker profiles of NSTEMI and STEMI, aiding in clinical differentiation.
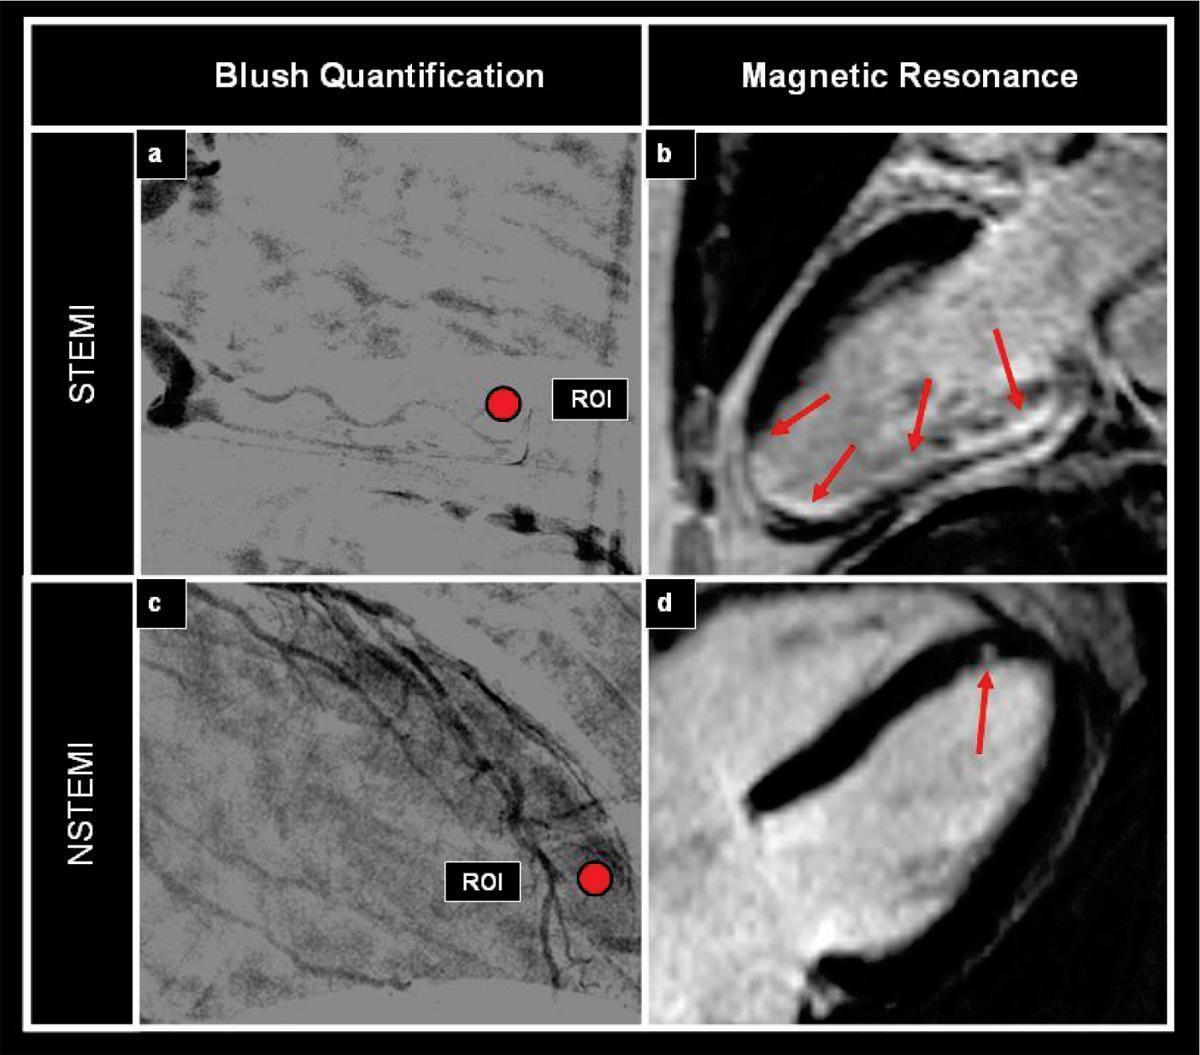
A comparative diagnostic image panel illustrating differences between ST-elevation myocardial infarction (STEMI) and non-ST-elevation myocardial infarction (NSTEMI) using angiographic blush quantification and cardiac magnetic resonance (CMR). The top row (a, b) displays STEMI findings: (a) an angiographic frame with a circular red Region of Interest (ROI) showing reduced myocardial blush, and (b) a delayed-enhancement CMR image showing extensive hyperenhancement (red arrows) indicating a large transmural inferior wall infarct. The bottom row (c, d) displays NSTEMI findings: (c) an angiographic frame with higher myocardial blush density within the ROI, and (d) a delayed-enhancement CMR image showing a small, localized area of subendocardial hyperenhancement (red arrow) in the anterior wall. The visual comparison highlights the greater infarct size and transmurality associated with STEMI compared to the smaller, non-transmural nature of NSTEMI, as well as the corresponding differences in microvascular perfusion (blush) between the two clinical presentations.
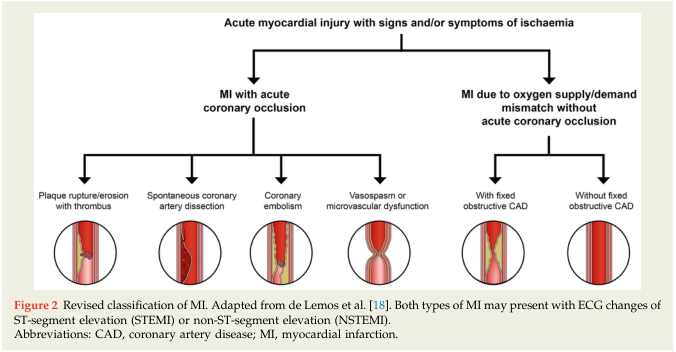
Summary : This flowchart presents a revised classification of myocardial infarction (MI) based on the presence or absence of acute coronary occlusion and the underlying mechanisms, as adapted from de Lemos et al. It visually distinguishes between MI with acute coronary occlusion and MI due to oxygen supply/demand mismatch without acute coronary occlusion, further subdividing each category by specific pathophysiological causes. flowchart: # Main Categories : • Acute myocardial injury with signs and/or symptoms of ischaemia (top-level node). • Two primary branches: – MI with acute coronary occlusion. – MI due to oxygen supply/demand mismatch without acute coronary occlusion. # MI with Acute Coronary Occlusion (Left Branch) : • Plaque rupture/erosion with thrombus (circular illustration showing narrowed artery with thrombus). • Spontaneous coronary artery dissection (circular illustration showing dissection in artery wall). • Coronary embolism (circular illustration showing embolic obstruction). • Vasospasm or microvascular dysfunction (circular illustration showing narrowed vessel due to spasm). # MI Due to Oxygen Supply/Demand Mismatch Without Acute Coronary Occlusion (Right Branch) : • With fixed obstructive CAD (circular illustration showing narrowed artery with stable plaque). • Without fixed obstructive CAD (circular illustration showing normal or non-obstructed artery). # Connectors : • Downward arrows from the top node to the two main branches. • Further downward arrows from each main branch to their respective subcategories. # Layout : • Hierarchical, top-down structure. • Two main branches split horizontally, each with multiple subcategories depicted with icons/illustrations. # Technical Details : • Figure legend notes that both MI types may present with ECG changes of ST-segment elevation (STEMI) or non-ST-segment elevation (NSTEMI). • Abbreviations: CAD = coronary artery disease; MI = myocardial infarction. Analysis : • The flowchart clarifies that MI can result from either acute coronary occlusion (with several distinct mechanisms) or from an imbalance in oxygen supply and demand without acute occlusion, with or without underlying coronary artery disease. • Visual icons help differentiate the pathophysiological processes, emphasizing the heterogeneity of MI causes. • The structure supports clinical differentiation for diagnosis and management.
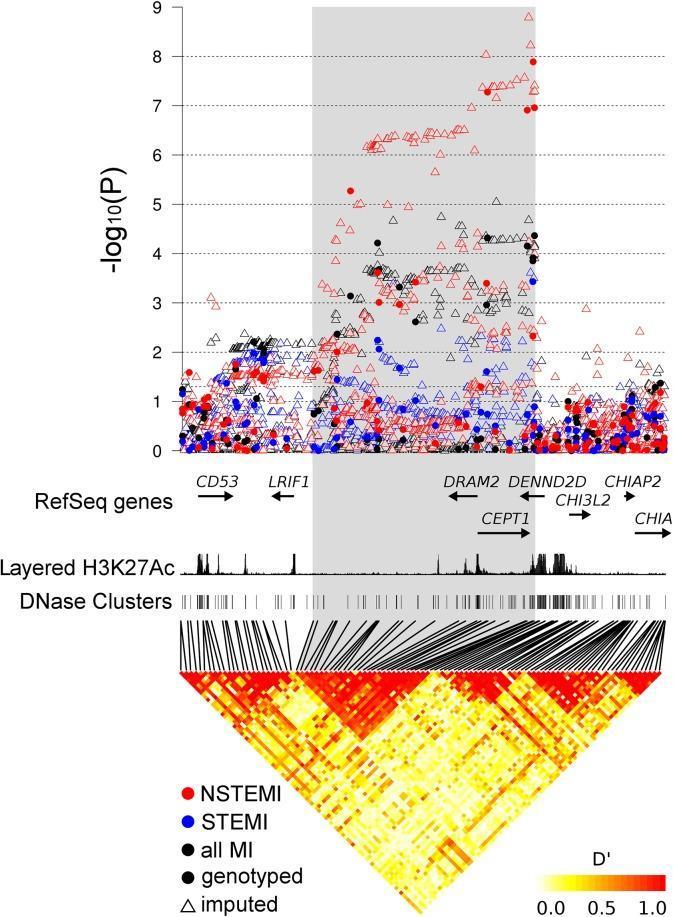
A multi-track genomic visualization showing the association of genetic variants at the 1p13.3 locus with myocardial infarction (MI) phenotypes. The top panel is a regional Manhattan-style plot displaying -log10(P) values for NSTEMI (red), STEMI (blue), and all MI (black) cases, distinguishing between genotyped (filled circles) and imputed (hollow triangles) variants. A gray shaded region highlights a cluster of high significance specifically for NSTEMI, with P-values reaching nearly 10^-9. Below the association plot, tracks display RefSeq genes including CD53, LRIF1, DRAM2, CEPT1, and DENND2D, alongside ENCODE regulatory annotations: Layered H3K27Ac peaks (marker of active enhancers/promoters) and DNase I hypersensitivity clusters (marker of open chromatin). The bottom track presents a Linkage Disequilibrium (LD) heat map using the D' statistic, revealing a distinct red block of high LD that corresponds spatially with the NSTEMI-associated variants and the DRAM2/CEPT1 gene region. This visual integration suggests a potential regulatory role of the identified variants in the pathogenesis of non-ST-elevation myocardial infarction.
myocardial infarction transmural subendocardial patterns location diagram
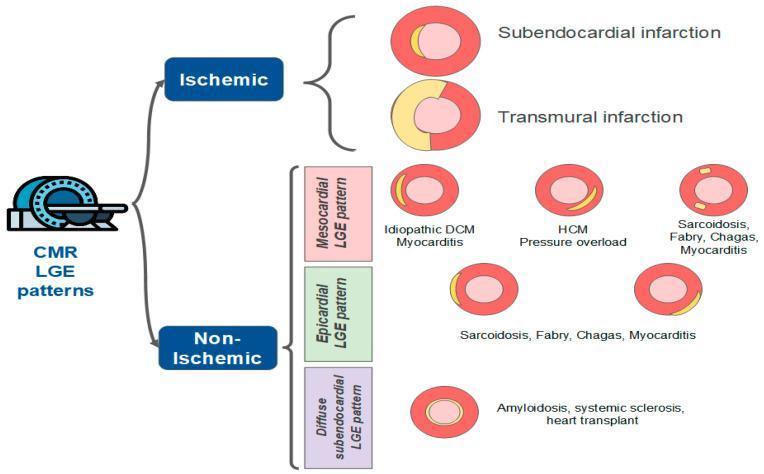
A medical educational diagram illustrating late gadolinium enhancement (LGE) patterns observed in Cardiac Magnetic Resonance (CMR) imaging to differentiate between ischemic and non-ischemic myocardial injury. The diagram uses cross-sectional circular representations of the left ventricle, where red indicates healthy myocardium and yellow represents LGE/scar tissue. Ischemic patterns are categorized into subendocardial infarction (limited to the inner layer) and transmural infarction (extending through the full wall thickness). Non-ischemic patterns are subdivided into three categories: 1) Mesocardial LGE, associated with idiopathic dilated cardiomyopathy (DCM), myocarditis, hypertrophic cardiomyopathy (HCM), and pressure overload; 2) Epicardial LGE, found in sarcoidosis, Fabry disease, Chagas disease, and myocarditis; and 3) Diffuse subendocardial LGE, characteristic of amyloidosis, systemic sclerosis, and heart transplant-related injury. The graphic provides a diagnostic pathway for clinical radiology and cardiology to identify specific cardiomyopathies based on the anatomical distribution of gadolinium contrast.
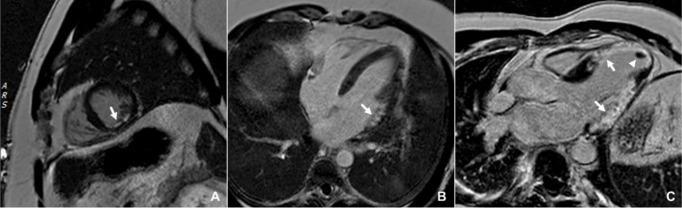
This diagnostic imaging composite displays three Cardiac Magnetic Resonance (CMR) images utilizing Phase-Sensitive Inversion Recovery (PSIR) Late Gadolinium Enhancement (LGE) to illustrate varying patterns of myocardial infarction (MI). Image A (mid-ventricular short-axis view) demonstrates a subendocardial infarction in the mid-inferior wall, characterized by hyperenhancement involving approximately 50% of the myocardial thickness. Image B (horizontal long-axis view) identifies a subendocardial infarction in the basal anterolateral wall with a deeper transmural extent of approximately 75%. Image C (left ventricular outflow tract view) reveals extensive pathology including two large transmural infarctions located at the anteroseptum/apex and the inferolateral wall. Additionally, an apical thrombus is identified in Image C, appearing as a dark, non-enhancing filling defect at the ventricular apex. These images serve as educational examples of how LGE imaging assesses tissue viability, infarct location, and the degree of transmurality, which are critical for prognostic stratification and identifying potential substrates for cardiac arrhythmias.
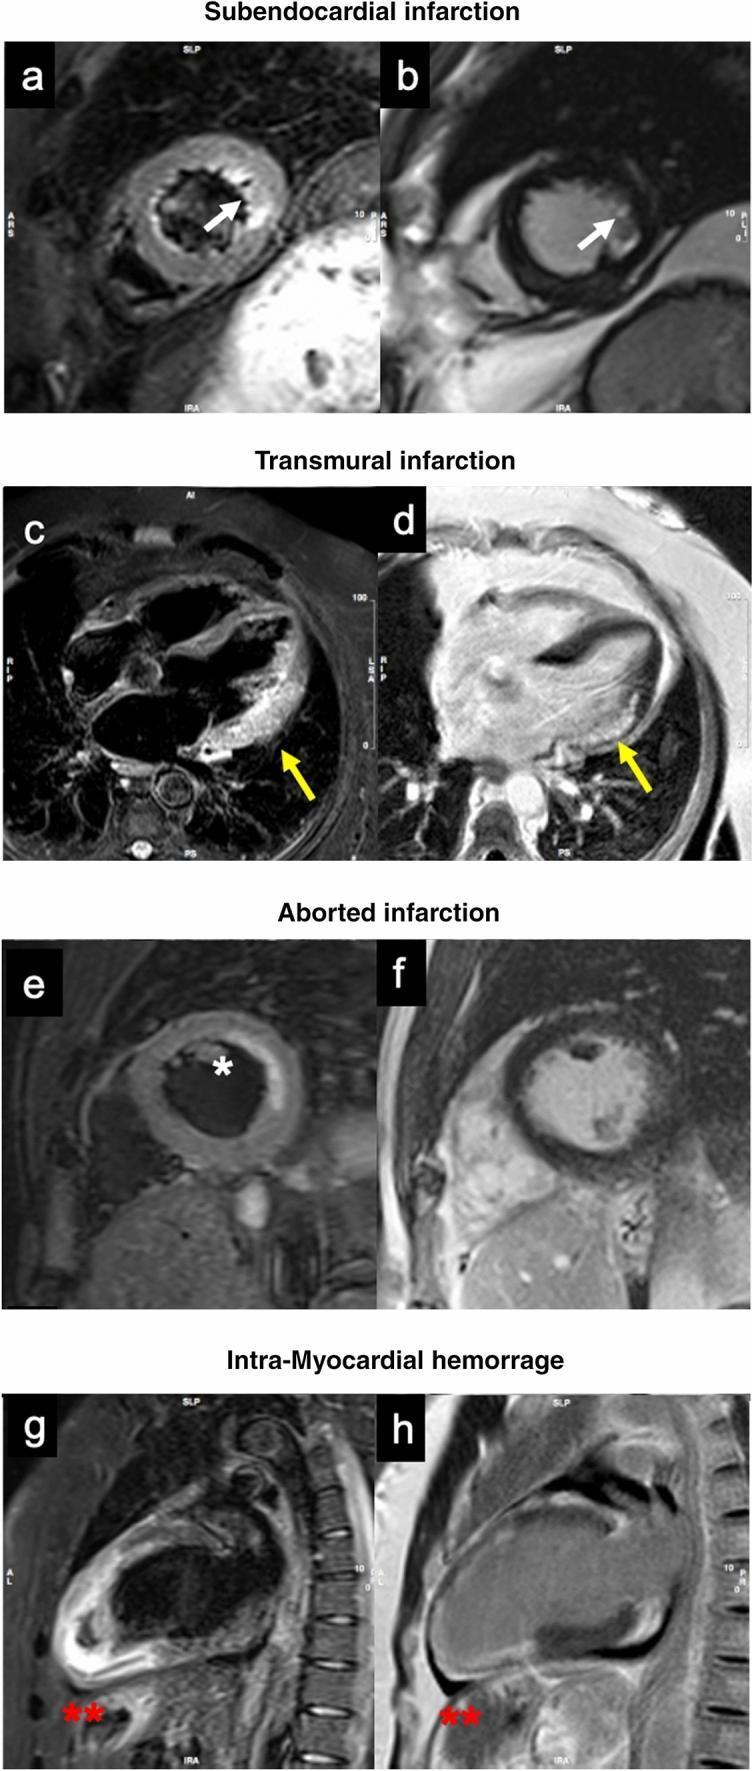
This diagnostic image set showcases Cardiac Magnetic Resonance (CMR) patterns for various myocardial conditions including STEMI and NSTEMI. Panels a and b (short-axis) illustrate a subendocardial infarction in a lateral NSTEMI case, where white arrows highlight localized edema on Short Tau Inversion Recovery (STIR) and late gadolinium enhancement (LGE) on Phase Sensitive Inversion Recovery (PSIR) sequences. Panels c and d demonstrate a transmural infarction with yellow arrows indicating full-thickness edema and LGE in the infero-lateral segments, accompanied by left ventricular dilation. Panels e and f represent an 'aborted' myocardial infarction, showing mid-lateral subendocardial edema (asterisk) on STIR without corresponding LGE enhancement. Finally, panels g and h (long-axis) identify intramyocardial hemorrhage (IMH) following an anterior STEMI, visualized as a distinct dark region of signal loss (red asterisks) within the inferior apical myocardium. These images serve as educational benchmarks for distinguishing tissue viability, infarct transmurality, and microvascular complications using CMR tissue characterization.
Types of Myocardial Infarction (MI)
I. By Depth of Necrosis (Morphological/Anatomical Classification)
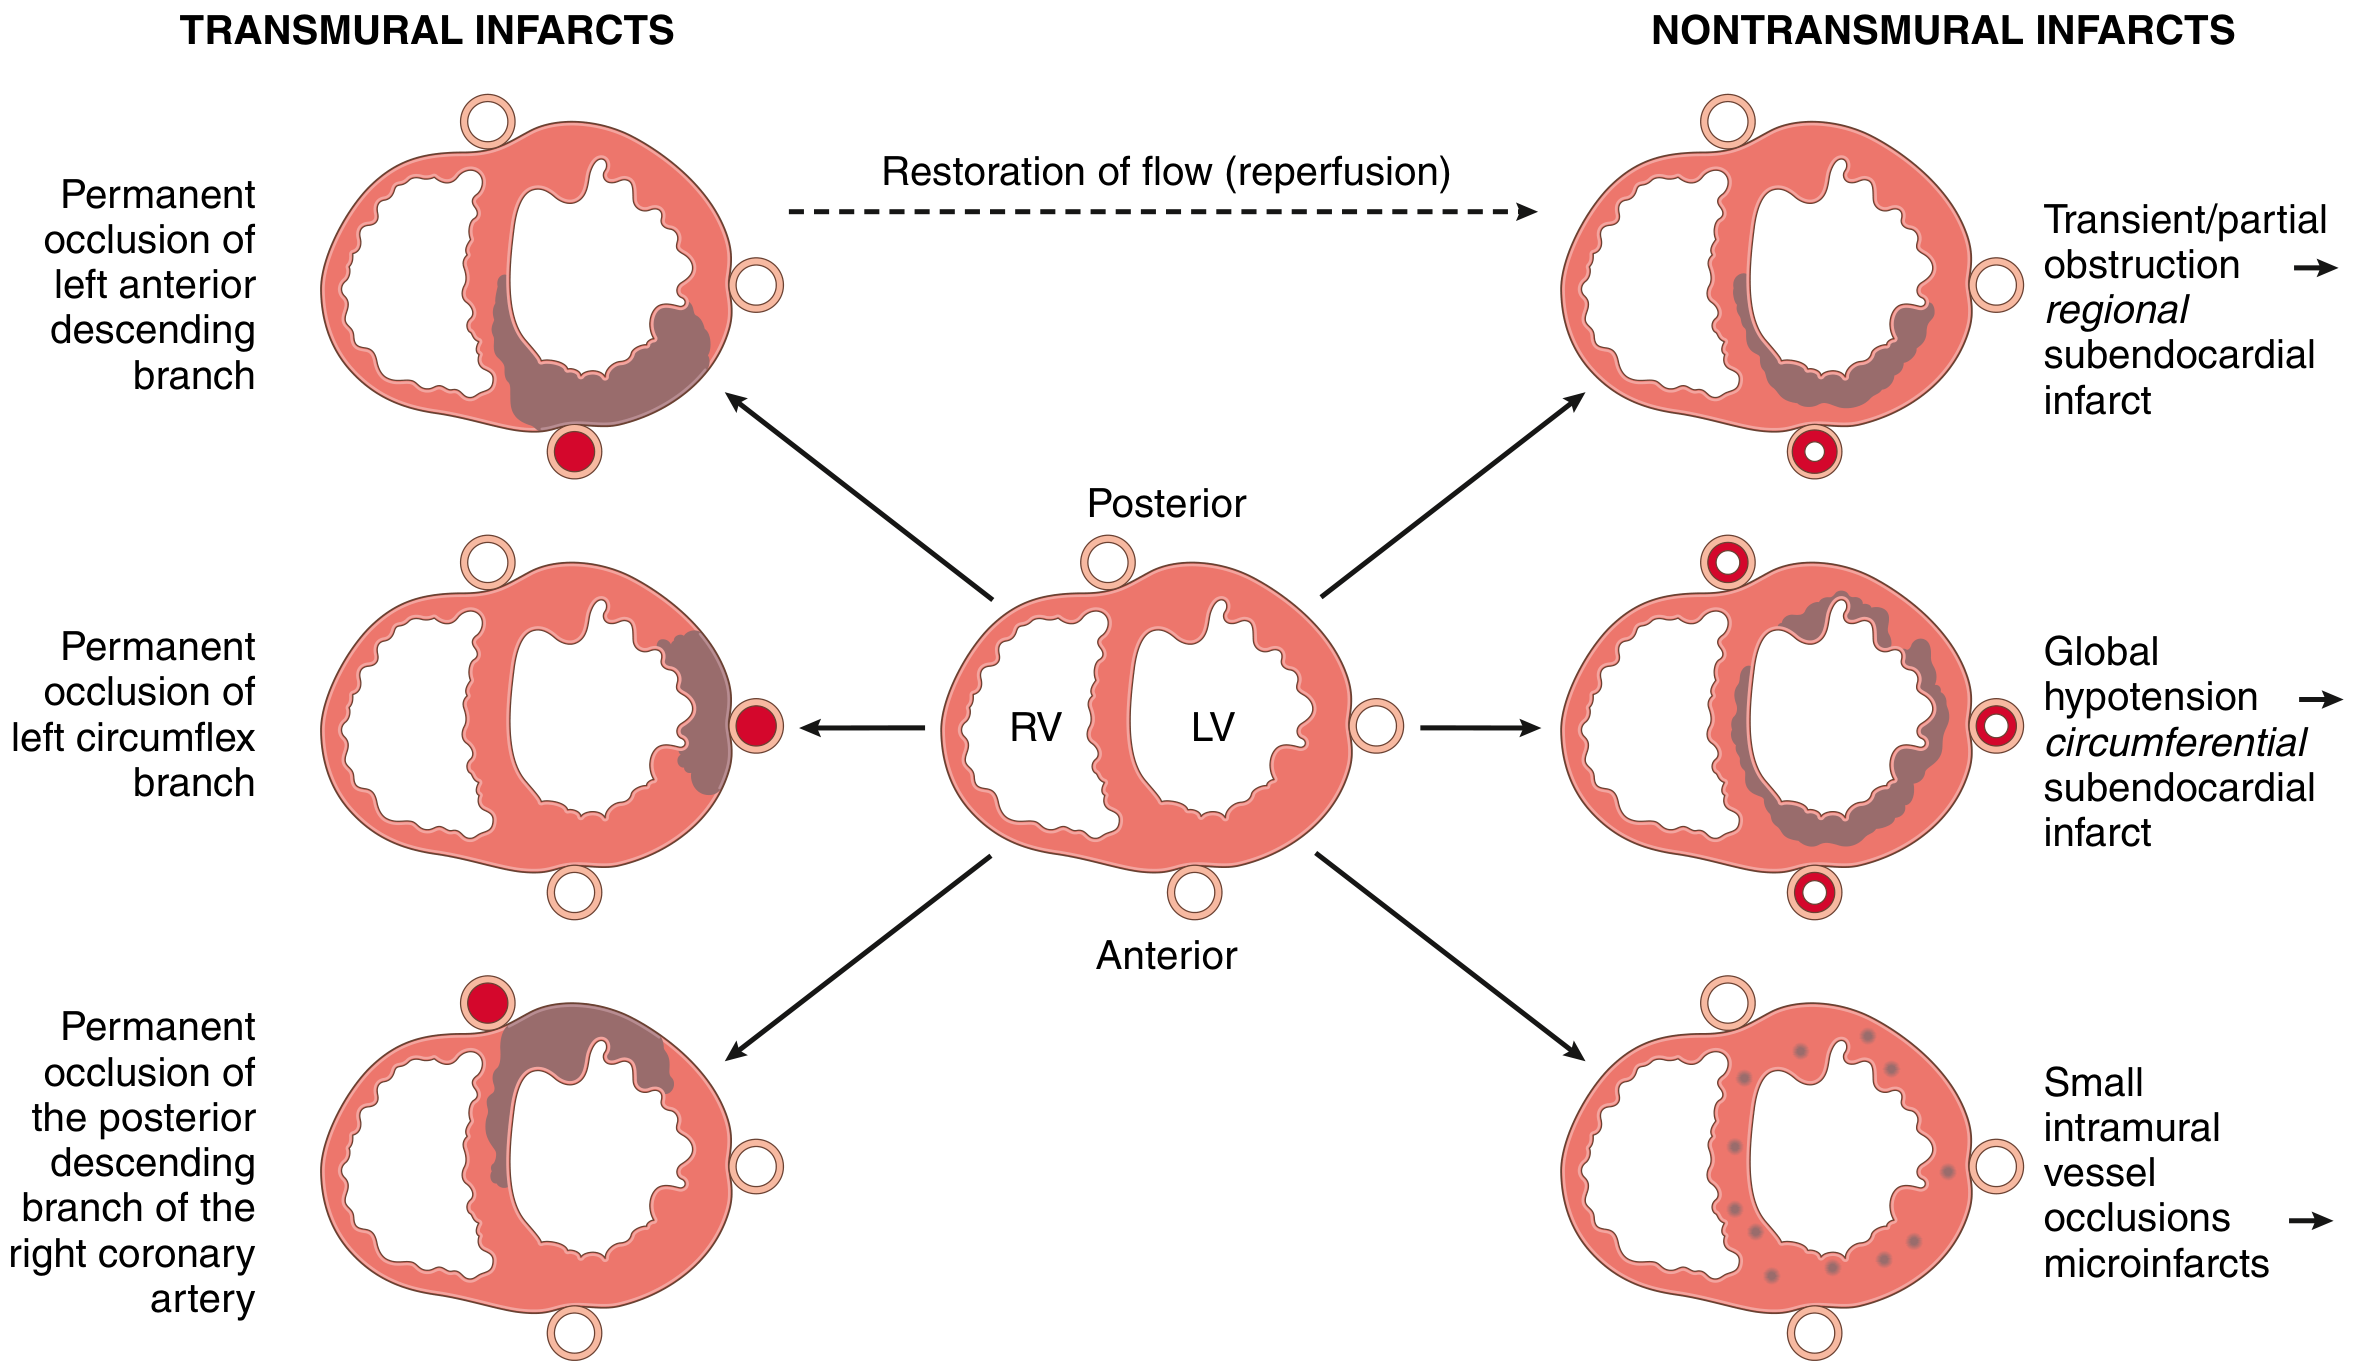
1. Transmural (Full-Thickness) MI
- Necrosis extends through the full thickness (or majority) of the ventricular wall
- Results from permanent, complete occlusion of a major epicardial coronary artery
- Involves at least a portion of the left ventricle and/or interventricular septum in nearly all cases
- Distribution:
- Left ventricle + IV septum: 67-80%
- Right ventricle also involved (posterior/posteroseptal infarcts): 15-30%
- Isolated right ventricle: 1-3%
- Isolated left atrial: rarest
- Associated with mural thrombus formation and pericarditis
- Corresponds clinically to STEMI (ST-elevation MI) on ECG
2. Subendocardial (Non-Transmural) MI
- Necrosis limited to the inner third of the myocardium (the zone most vulnerable to hypoperfusion, as it is most distal from the epicardial supply)
- Caused by:
- Plaque disruption followed by thrombus that is lysed spontaneously or therapeutically before necrosis becomes transmural
- Severe fixed CAD with transient demand-supply mismatch (hypotension, anemia, tachycardia, hypertension)
- Two sub-patterns:
- Regional subendocardial infarct - from transient/partial obstruction in one territory
- Circumferential subendocardial infarct - from global hypotension superimposed on three-vessel disease
- Corresponds clinically to NSTEMI (Non-ST-elevation MI)
3. Intramural MI
- Necrosis limited to the mid-myocardial (intramural) layer, not reaching the endocardium or epicardium
- Less common; usually seen as satellite areas adjacent to a more extensive infarct
4. Microscopic (Microinfarcts)
- Occur with small intramyocardial vessel occlusions
- Causes: vasculitis, embolization from valve vegetations or mural thrombi, cocaine-induced vasospasm, pheochromocytoma
- May not produce diagnostic ECG changes
5. Papillary Muscle Infarction
- Involvement of the papillary muscles of the left ventricle
- The posterior papillary muscle is especially susceptible (single blood supply from PDA)
- Can cause acute mitral regurgitation - a serious mechanical complication
II. By ECG Pattern (Clinical Classification)
| Feature | STEMI | NSTEMI |
|---|---|---|
| Occlusion type | Complete | Partial/transient |
| Depth | Transmural | Subendocardial |
| ECG | ST elevation in ≥2 contiguous leads | ST depression, T-wave inversion, or nonspecific changes |
| Troponin | Positive (may be negative very early) | Positive |
| Management | Urgent reperfusion (PCI within 90 min) | Risk-stratify; early invasive vs. conservative |
III. By Etiology (Universal Definition - 4th Edition, ESC/ACC/AHA)
| Type | Name | Mechanism |
|---|---|---|
| Type 1 | Spontaneous MI | Atherosclerotic plaque rupture/erosion → acute coronary thrombosis. The most common type. |
| Type 2 | MI due to ischemic imbalance | Oxygen supply-demand mismatch WITHOUT acute atherothrombosis. Causes: coronary spasm, severe anemia, arrhythmias (tachycardia), hypotension, hypertension, SCAD, embolism. |
| Type 3 | MI related to cardiac death | Sudden unexpected cardiac death with ECG changes, symptoms of ischemia, or findings at autopsy - before biomarkers can be drawn or become elevated |
| Type 4a | PCI-related MI | MI occurring within 48 hours of percutaneous coronary intervention; troponin >5× 99th percentile URL |
| Type 4b | Stent thrombosis | Documented by angiography or autopsy |
| Type 5 | CABG-related MI | MI associated with coronary artery bypass grafting; troponin >10× 99th percentile URL |
IV. By Location (Anatomical Territory)
| Location | Artery | ECG Leads |
|---|---|---|
| Anterior | LAD (left anterior descending) | V1-V4 |
| Anterolateral | LAD or LCx | V4-V6, I, aVL |
| Lateral | Left circumflex (LCx) | I, aVL, V5-V6 |
| Inferior | RCA (right coronary artery) | II, III, aVF |
| Posterior | RCA or LCx | ST depression V1-V3 (reciprocal); posterior leads V7-V9 |
| Right ventricular | Proximal RCA | ST elevation in right-sided leads (V3R-V4R) |
V. By Temporal Stage (Age of Infarct)
| Stage | Time | Gross/Microscopic Findings |
|---|---|---|
| Very early | 0-12 hours | No gross change visible; ECG and troponin changes present |
| Early | 12-24 hours | Pale, soft, coagulative necrosis beginning; TTC stain reveals pale unstaining area |
| Acute | 1-3 days | Yellow-tan necrosis, neutrophilic infiltration |
| Healing | 4-10 days | Macrophage infiltration, granulation tissue at margins |
| Healed/Chronic | Weeks-months | Dense fibrous scar (white/gray) |
Key Pathogenesis Summary
Sources: Robbins & Kumar Basic Pathology 10e; Robbins, Cotran & Kumar Pathologic Basis of Disease; Symptom to Diagnosis: An Evidence-Based Guide 4e; Sabiston Textbook of Surgery; Ganong's Review of Medical Physiology 26e; PC Dikshit Textbook of Forensic Medicine and Toxicology