
What do you mean by oxidative phosphorylation and substrate level phosphorylation? Explain the chemiosmotic theory with necessary diagram.
chemiosmotic theory oxidative phosphorylation ATP synthase proton gradient diagram
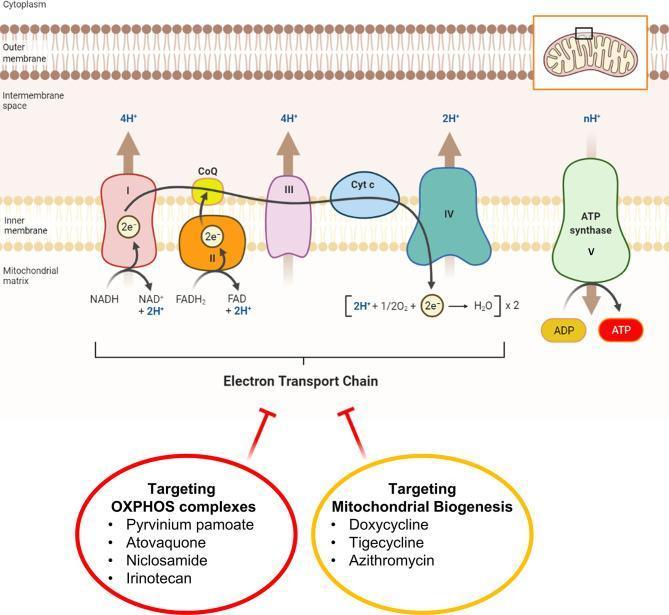
A pathophysiology diagram illustrating the mitochondrial oxidative phosphorylation (OXPHOS) system and its therapeutic inhibitors. The top schematic shows the inner mitochondrial membrane containing the Electron Transport Chain (ETC) complexes I through IV, Coenzyme Q (CoQ), and Cytochrome c (Cyt c), alongside ATP synthase (Complex V). It depicts the flow of electrons (2e-) from NADH and FADH2, the pumping of protons (H+) into the intermembrane space, and the final reduction of oxygen to water. Complex V is shown utilizing the proton gradient to convert ADP to ATP. The lower section identifies two pharmacological strategies for ATP depletion in cancer cells: 'Targeting OXPHOS complexes' using drugs like Pyrvinium pamoate, Atovaquone, Niclosamide, and Irinotecan; and 'Targeting Mitochondrial Biogenesis' using antibiotics such as Doxycycline, Tigecycline, and Azithromycin. Inhibitory arrows indicate these drugs disrupt mitochondrial function to target cancer stem cells (CSCs).
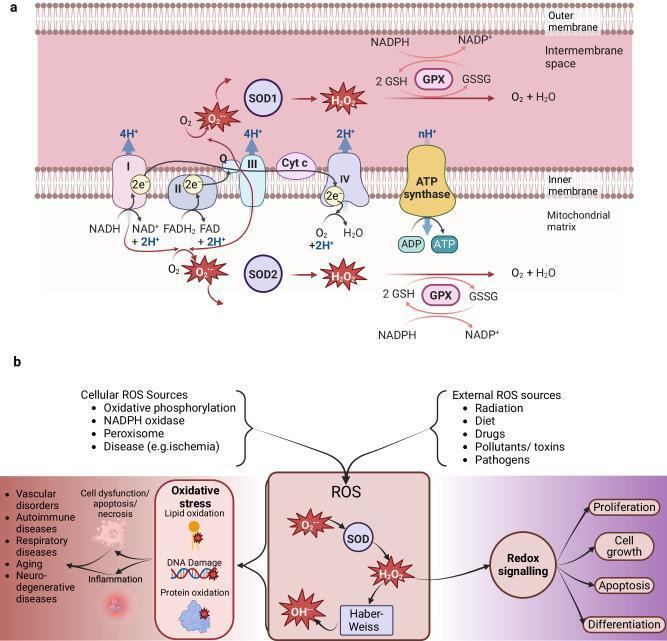
A two-part medical illustration depicting mitochondrial oxidative phosphorylation and the broader landscape of reactive oxygen species (ROS) biology. Section (a) shows the electron transport chain (ETC) within the inner mitochondrial membrane, detailing complexes I-IV, ubiquinone (Q), and cytochrome c. It illustrates electron flow from NADH/FADH2 leading to proton pumping into the intermembrane space and ATP synthesis via ATP synthase. The diagram highlights 'leaky' electrons from complexes I and III reacting with O2 to form superoxide (O2•-), which is subsequently neutralized by superoxide dismutase (SOD) and glutathione peroxidase (GPX). Section (b) outlines cellular and external ROS sources, including NADPH oxidase, peroxisomes, radiation, and pathogens. It demonstrates the dual nature of ROS: contributing to pathological oxidative stress (DNA damage, lipid oxidation, protein oxidation) leading to diseases like vascular disorders and neurodegeneration, while simultaneously acting as essential mediators in physiological redox signaling for cell growth, proliferation, apoptosis, and differentiation.
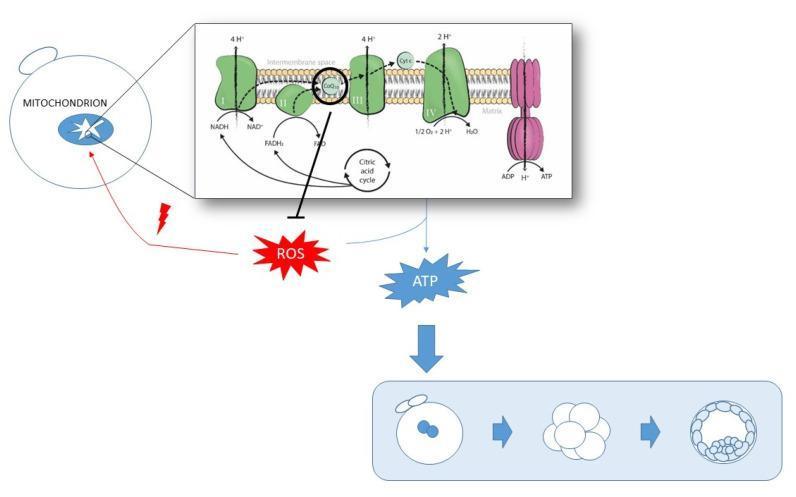
This pathophysiology diagram illustrates the role of mitochondrial function and Coenzyme Q10 (CoQ10) in oocyte development and quality. The visual is divided into a macro-scale pathway and a magnified biochemical view of the inner mitochondrial membrane. The magnified section details the Electron Transport Chain (ETC), showing Complexes I, II, III, and IV, alongside CoQ10 and Cytochrome c. It depicts the conversion of NADH to NAD+ and FADH2 to FAD, the pumping of protons (H+) into the intermembrane space, and the reduction of oxygen to water at Complex IV. ATP synthase is shown utilizing the proton gradient to produce ATP from ADP. The larger diagram links these processes to oocyte health: the production of ATP is depicted as a positive driver for embryonic progression from a zygote to a blastocyst. Conversely, the diagram shows Reactive Oxygen Species (ROS) as a byproduct of the Citric Acid Cycle that causes oxidative damage (indicated by a lightning bolt). CoQ10 is highlighted as a critical regulatory component that both facilitates the ETC and inhibits ROS production, thereby promoting optimal oocyte maturity and developmental potential.
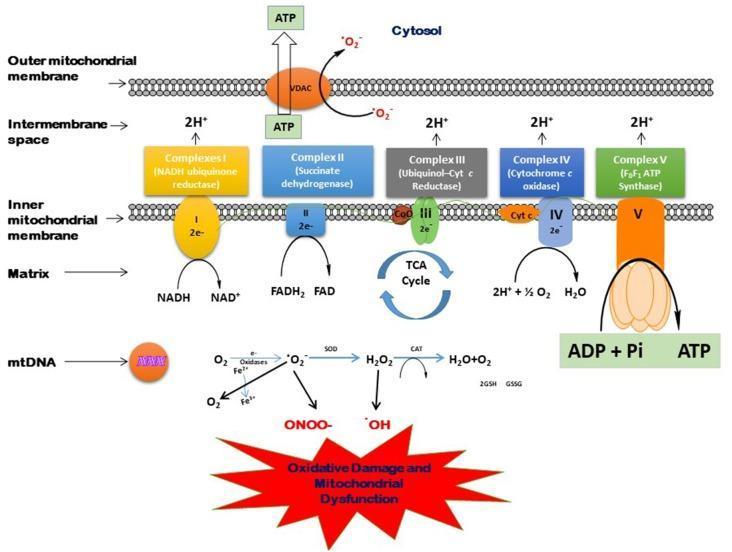
This pathophysiology diagram illustrates mitochondrial bioenergetics, specifically the electron transport chain (ETC), ATP synthesis, and the generation of reactive oxygen/nitrogen species (ROS/RNS). The upper portion details the inner mitochondrial membrane containing Complexes I through V. Complex I (NADH ubiquinone reductase) and Complex II (Succinate dehydrogenase) receive electrons from NADH and FADH2, respectively. Electrons flow through ubiquinone (CoQ) and cytochrome c (Cyt c) to Complex IV (Cytochrome c oxidase), which reduces O2 to H2O. Complexes I, III, and IV pump protons (H+) into the intermembrane space, creating a gradient that drives Complex V (F0F1 ATP Synthase) to convert ADP + Pi into ATP. ATP then exits to the cytosol via the VDAC channel. The lower section depicts oxidative stress pathways: O2 is converted to superoxide (•O2-) by oxidases or mitochondrial leakage. Superoxide is neutralized by Superoxide Dismutase (SOD) into H2O2, which Catalase (CAT) or the GSH/GSSG cycle converts to water. Alternatively, superoxide reacts with NO to form peroxynitrite (ONOO-) or leads to hydroxyl radicals (•OH), resulting in oxidative damage, mtDNA mutations, and mitochondrial dysfunction.
2+4 marks point wise answer human style from standard book easy understanding language
Q1. Oxidative Phosphorylation vs Substrate Level Phosphorylation (2 Marks)
Oxidative Phosphorylation
- It is the major process of ATP synthesis in the cell, occurring in the inner mitochondrial membrane.
- ATP is formed from ADP + Pi using the energy released during electron transport from NADH/FADH₂ to oxygen.
- It requires oxygen (aerobic process) and involves the electron transport chain (ETC) + ATP synthase.
- Yields: ~2.5 ATP per NADH and ~1.5 ATP per FADH₂.
- Example: Mitochondrial respiration.
Substrate Level Phosphorylation
- ATP is formed by direct transfer of a high-energy phosphate group from a phosphorylated intermediate (substrate) to ADP — no oxygen needed.
- It does not require the ETC or mitochondrial membrane.
- Occurs in the cytoplasm (glycolysis) and mitochondrial matrix (TCA cycle).
- Examples:
- Glycolysis: 1,3-bisphosphoglycerate → 3-phosphoglycerate (via phosphoglycerate kinase) → 1 ATP
- Glycolysis: Phosphoenolpyruvate (PEP) → Pyruvate (via pyruvate kinase) → 1 ATP
- TCA cycle: Succinyl-CoA → Succinate (via succinyl-CoA synthetase) → 1 GTP
Key difference in one line: Oxidative phosphorylation uses the energy of electron flow + proton gradient; substrate level phosphorylation directly transfers a phosphate bond — no gradient needed.
Q2. Chemiosmotic Theory (Mitchell Hypothesis) (4 Marks)
Background
- Proposed by Peter Mitchell in 1961 (Nobel Prize 1978).
- Also called the chemiosmotic hypothesis.
- It explains how energy from electron transport is converted into ATP.
Key Points of the Theory
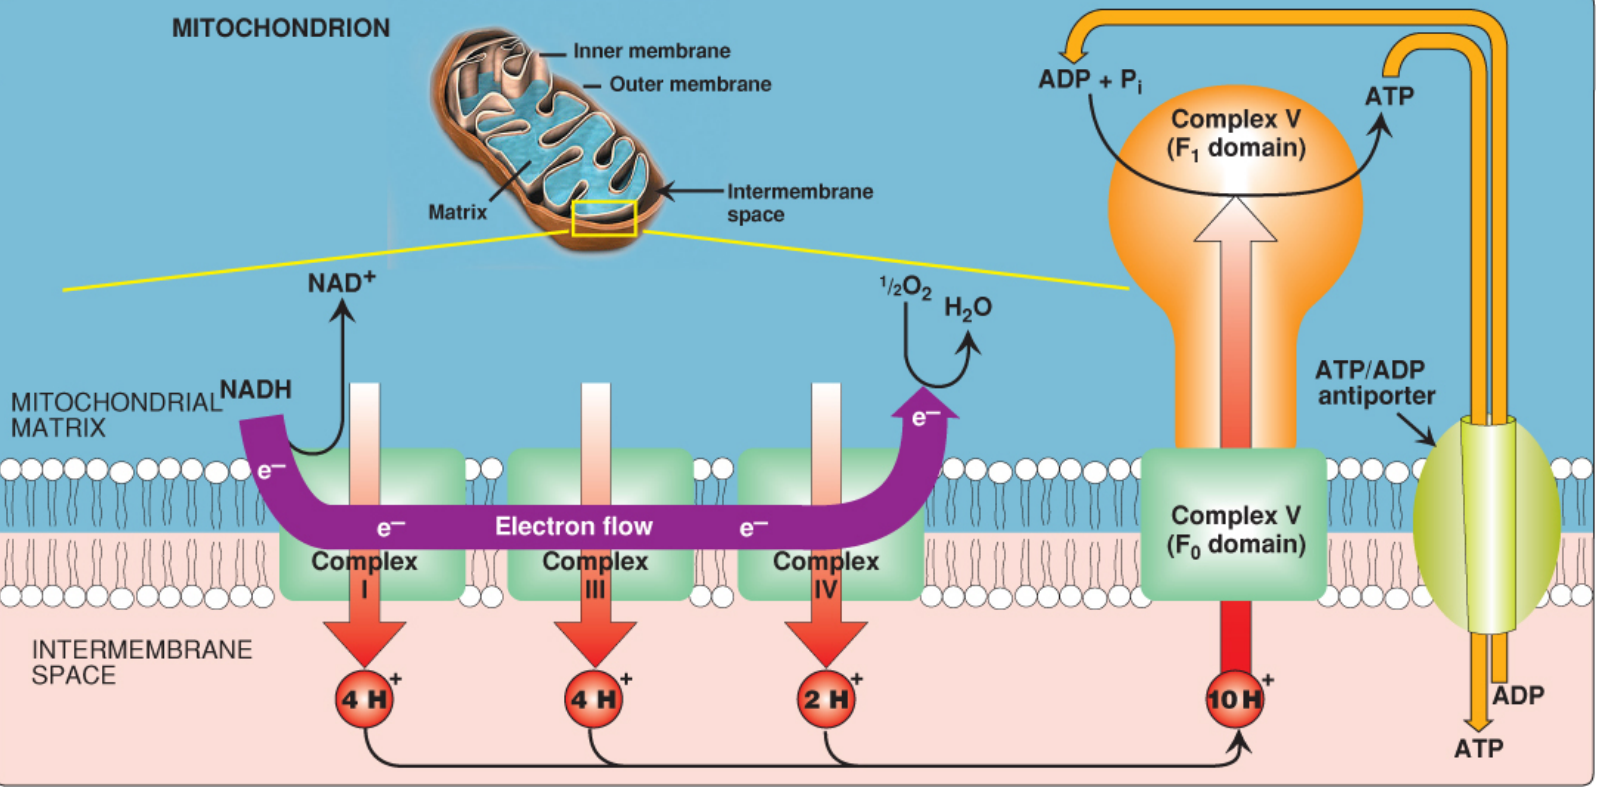
- As electrons pass through Complexes I, III, and IV of the ETC, the energy released is used to pump H⁺ (protons) from the mitochondrial matrix → intermembrane space.
- For every pair of electrons from NADH, a total of 10 H⁺ are pumped.
- Complex II does not pump protons.
- The pumping of H⁺ creates two gradients across the inner mitochondrial membrane:
- pH gradient (ΔpH): intermembrane space is more acidic (more H⁺) than the matrix.
- Electrical gradient (ΔΨ): intermembrane space is more positive than the matrix.
- Together, these form the proton-motive force (PMF), which stores potential energy.
- ATP synthase has two domains:
- F₀ domain: spans the inner membrane; has a H⁺ channel (c-ring).
- F₁ domain: protrudes into the matrix; contains the catalytic β-subunits that make ATP.
- H⁺ flow back into the matrix through the F₀ channel (down the electrochemical gradient).
- This flow causes the c-ring to rotate, which drives conformational changes in F₁.
- The β-subunits cycle through 3 states: bind ADP + Pi → phosphorylate → release ATP.
- One full rotation = 3 ATP synthesized.
- Electron transport and ATP synthesis are tightly coupled through the H⁺ gradient.
- If ATP demand rises (more ADP available) → more H⁺ flows through F₀ → ETC speeds up.
- If the gradient is dissipated without making ATP = uncoupling (energy lost as heat).
Diagram
Summary Table
| Feature | Oxidative Phosphorylation | Substrate Level |
|---|---|---|
| Location | Inner mitochondrial membrane | Cytoplasm / Matrix |
| O₂ required? | Yes | No |
| Mechanism | Proton gradient + ETC | Direct phosphate transfer |
| Yield per glucose | ~32 ATP | 4 ATP (2 glycolysis + 2 TCA) |
| Examples | ETC + ATP synthase | PGK, pyruvate kinase, succinyl-CoA synthetase |
Don't give a short answer. Give me exam pattern answer and dr- d- the drawing should be good, like stepwise diagram, something like that, human sketch diagram.
Hand-drawn pencil sketch style biochemistry diagram of chemiosmotic theory of oxidative phosphorylation. Show a stepwise labeled diagram like a student would draw in an exam. Include: 1) Top section labeled "INTERMEMBRANE SPACE" and bottom section labeled "MITOCHONDRIAL MATRIX" separated by a horizontal wavy line representing the inner mitochondrial membrane. 2) On the membrane, draw four protein complexes labeled as boxes: "Complex I (NADH Dehydrogenase)", "Complex II (Succinate Dehydrogenase)", "Complex III (Cyt bc1)", "Complex IV (Cyt c oxidase)" and "Complex V (ATP Synthase)" at the right end. 3) Show electron flow with dotted arrows: NADH → Complex I → CoQ → Complex III → Cyt c → Complex IV → O2 → H2O. Also show FADH2 → Complex II → CoQ. 4) Show H+ proton pumping arrows going UP from matrix to intermembrane space at Complex I (4H+), Complex III (4H+), Complex IV (2H+). 5) At Complex V, show H+ flowing back DOWN into matrix through a mushroom-shaped ATP synthase, with ADP + Pi → ATP written next to it. 6) Show the F0 (membrane part) and F1 (knob projecting into matrix) of ATP synthase. 7) Label "Proton-motive force (PMF)" with a double-headed arrow showing the gradient. 8) Add step numbers 1, 2, 3, 4 indicating the sequence of events. Neat hand-drawn sketch style with pencil lines, labels in neat handwriting font, educational diagram look.
Hand-drawn pencil sketch style diagram of ATP synthase (Complex V) structure for biochemistry exam. Draw like a student's exam sketch. Show: A mushroom-shaped protein complex spanning a membrane (draw the membrane as two parallel horizontal lines). Label the membrane as "Inner Mitochondrial Membrane". Above the membrane label "Intermembrane Space (H+ rich, low pH, +ve charge)". Below the membrane label "Mitochondrial Matrix (H+ poor, high pH, -ve charge)". The ATP synthase should have: 1) F0 domain - the stalk embedded in the membrane with a c-ring (draw as a circular ring with small subunits labeled c, c, c). 2) F1 domain - the large round knob projecting into the matrix, label it "F1 headpiece" containing "3 alpha + 3 beta subunits". 3) A central stalk (gamma subunit) connecting F0 to F1. 4) Show H+ protons with (+) symbols flowing DOWN from intermembrane space through the F0 channel with arrows. 5) Next to F1, write "ADP + Pi → ATP" with an arrow. 6) Label the three conformational states of beta subunits: "Open (O)", "Loose (L)", "Tight (T)". 7) Add a rotation arrow around the c-ring indicating clockwise rotation. Neat hand-drawn educational sketch style, clear labels, pencil art look.
Error calling model 'gemini-3-pro-image' (RESOURCE_EXHAUSTED): 429 RESOURCE_EXHAUSTED. {'error': {'code': 429, 'message': 'Resource has been exhausted (e.g. check quota).', 'status': 'RESOURCE_EXHAUSTED'}}
We encountered an error while processing your request. Please try again or reach out to us for help.