
Cardiac output for short note mbbs 1st year physiology
Reading File
Finding Sources
Finding Sources
Reading File
Reading File
Reading File
Reading File
Reading File
Reading File
Reading File
Finding Sources
Reading File
Loading Image
Finding Sources
I have all the information needed to write a comprehensive short note on Cardiac Output for MBBS 1st year physiology. Let me now compose the answer.
Cardiac Output - Short Note (MBBS 1st Year Physiology)
Definition
Cardiac output (CO) is the total volume of blood ejected by the left ventricle per minute. It is the product of stroke volume and heart rate.
CO = Stroke Volume (SV) × Heart Rate (HR)
Normal value: ~5000 mL/min (5 L/min) in a 70-kg adult at rest (SV = 70 mL, HR = 72 beats/min).
- Costanzo Physiology 7th Ed., p. 155
Important Derived Terms
| Term | Definition | Normal Value |
|---|---|---|
| Stroke Volume (SV) | Volume ejected per beat = EDV - ESV | ~70 mL |
| End-Diastolic Volume (EDV) | Volume in ventricle just before contraction | ~130-140 mL |
| End-Systolic Volume (ESV) | Volume remaining after contraction | ~60-70 mL |
| Ejection Fraction (EF) | SV / EDV × 100 | ~50-70% |
| Cardiac Index (CI) | CO / Body Surface Area | 2.5-3.5 L/min/m² |
Measurement of Cardiac Output - Fick Principle
The Fick principle states that in steady state, cardiac output of both ventricles is equal. Oxygen consumption of the body equals the difference between the amount of O2 leaving the lungs and the amount entering.
Formula:
CO = O₂ consumption / ([O₂]pulmonary vein - [O₂]pulmonary artery)
Example: O₂ consumption = 250 mL/min; arterial O₂ content = 0.20 mL/mL blood; venous O₂ content = 0.15 mL/mL blood.
CO = 250 / (0.20 - 0.15) = 5000 mL/min
The pulmonary venous O₂ content is sampled from peripheral arterial blood; pulmonary arterial O₂ content is sampled from mixed venous blood (right ventricle or pulmonary artery via cardiac catheter). - Costanzo Physiology 7th Ed., p. 159
Other methods include thermodilution (indicator dilution technique, most commonly used clinically) and Doppler echocardiography.
Factors Affecting Cardiac Output
Cardiac output is regulated through two main determinants - stroke volume and heart rate. Stroke volume depends on three factors:
1. Preload
- Preload = ventricular end-diastolic volume (EDV); clinically reflected by end-diastolic pressure
- Increased venous return → increased EDV → increased preload → increased stroke volume (Frank-Starling law)
- Frank-Starling Law: The more the ventricle is filled during diastole, the greater the force of contraction and the greater the stroke volume ejected in systole. This operates through the length-tension relationship in cardiac muscle.
2. Afterload
- Afterload = resistance the ventricle must overcome to eject blood, primarily aortic pressure / total peripheral resistance (TPR)
- Increased afterload → decreased stroke volume → decreased CO
- Relationship: CO = Arterial Pressure / TPR - thus CO varies inversely with TPR when arterial pressure is unchanged. - Guyton & Hall, p. 252
3. Contractility (Inotropy)
- Intrinsic ability of the myocardium to develop force independent of preload and afterload
- Increased by: sympathetic stimulation, catecholamines, digoxin, increased heart rate (Bowditch effect / treppe)
- Decreased by: hypoxia, acidosis, heart failure, beta-blockers, calcium channel blockers
4. Heart Rate
- Up to a point, increased HR increases CO
- Very high HR reduces diastolic filling time, decreasing EDV → decreased SV (Frank-Starling), which may ultimately reduce CO
- HR is controlled by the SA node, autonomic nervous system (SNS increases, PNS decreases HR), and hormones (catecholamines)
Cardiac Output Curves
The cardiac output curve plots CO against right atrial pressure (RAP). It is based on the Frank-Starling relationship:
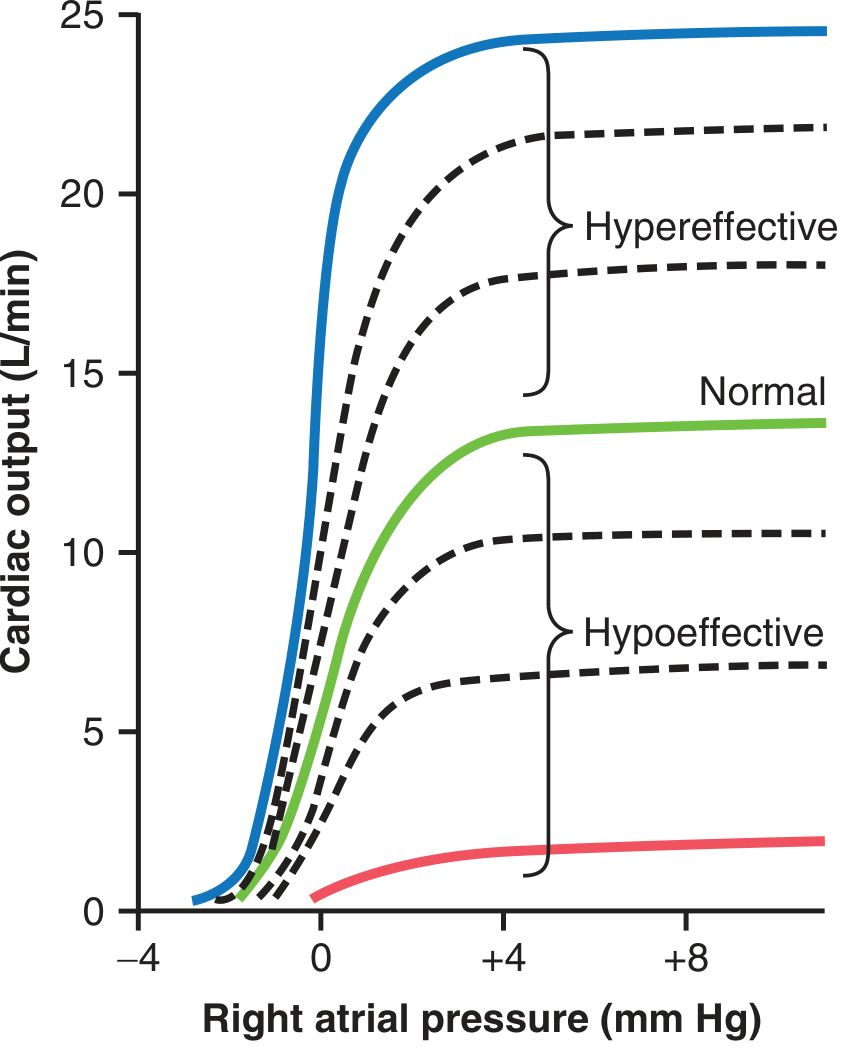
Cardiac output curves: Normal heart (green), hypereffective heart (blue - sympathetic stimulation, hypertrophy), hypoeffective heart (red - heart failure, myocarditis, hypoxia). - Guyton & Hall
- Normal CO plateau: ~13 L/min (2.5× resting)
- Maximal CO with sympathetic stimulation: ~25 L/min
- In trained athletes (cardiac hypertrophy + neural effects): up to 30-40 L/min
- Guyton & Hall, p. 253
Hypereffective heart (CO above normal):
- Sympathetic stimulation + parasympathetic inhibition (increases HR and contractility)
- Cardiac hypertrophy (e.g., marathon runners - mass increased 50-75%)
Hypoeffective heart (CO below normal):
- Increased afterload (severe hypertension)
- Coronary artery disease / MI
- Valvular heart disease
- Congenital heart disease
- Myocarditis, cardiac hypoxia
Cardiac Output and Venous Return
In steady state: Cardiac output = Venous return
The vascular function curve (venous return curve) plots venous return vs. right atrial pressure - it has an inverse relationship (lower RAP → greater pressure gradient → greater venous return).
The operating point is where the cardiac function curve and vascular function curve intersect. Any change in blood volume, heart contractility, or peripheral resistance shifts one or both curves, establishing a new operating point.
Cardiac Output in Special States
| State | CO Change | Mechanism |
|---|---|---|
| Exercise | Increases up to 4-7× | ↑ HR, ↑ contractility, ↑ venous return, ↓ TPR |
| Pregnancy | ↑ 35-50% by end of 1st trimester | ↑ blood volume, ↑ HR, ↑ plasma volume |
| Hyperthyroidism | Increased | ↑ metabolism, ↓ TPR |
| Severe anaemia | Increased | ↓ TPR (↓ viscosity), compensatory ↑ HR |
| Heart failure | Decreased | ↓ contractility |
| Haemorrhage | Decreased | ↓ venous return, ↓ preload |
Clinical Correlates
- Low CO → inadequate tissue perfusion → cardiogenic shock
- High CO cardiac failure (high-output failure): severe anaemia, thiamine deficiency (beri-beri), AV fistulas, thyrotoxicosis - heart fails despite elevated CO because demand exceeds capacity
- Cardiac index is preferred over raw CO to account for body size differences
Summary Box (Exam Quick Recall)
CO = SV × HR
Normal = 5 L/min
SV depends on: Preload (↑EDV→↑SV), Afterload (↑TPR→↓SV), Contractility
Measured by: Fick principle, thermodilution, echo-Doppler
Frank-Starling: ↑venous return → ↑EDV → ↑SV → ↑CO
CO = Arterial Pressure / TPR (Ohm's law analogy)
Sources: Costanzo Physiology 7th Ed., Ch. 4 (pp. 155-162); Guyton & Hall Textbook of Medical Physiology, Ch. 20 (pp. 251-254)
This is a shared conversation. Sign in to Orris to start your own chat.