
Celiac disease for md pathology exam
celiac disease histology villous atrophy duodenum biopsy
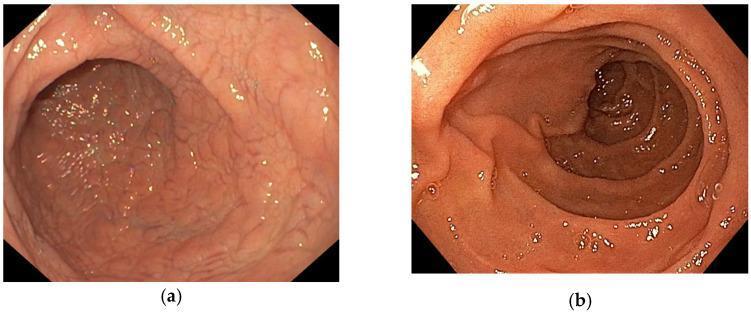
This comparison chart features two endoscopic images of the second duodenum, illustrating the diagnostic visual markers for Celiac Disease (CD). Image (a) depicts the duodenal mucosa of a patient with biopsy-confirmed CD (Marsh 3), showing characteristic villous atrophy. Visually, the mucosa exhibits a flattened, featureless, or 'mosaic' appearance with a notable loss of Kerckring folds (circular folds) and a smoother, more glistening texture compared to healthy tissue. The intestinal lumen appears more tubular and open due to this atrophy. In contrast, image (b) shows a control patient with normal mucosal architecture. It displays prominent, well-defined circular folds and a granular surface texture indicative of healthy villi. The vascular pattern is more intricately visible, and the lumen appears more structured and partially obscured by the physiological folding. These images serve as educational examples for gastroenterology, highlighting the endoscopic features used to identify malabsorptive pathologies in the upper gastrointestinal tract.
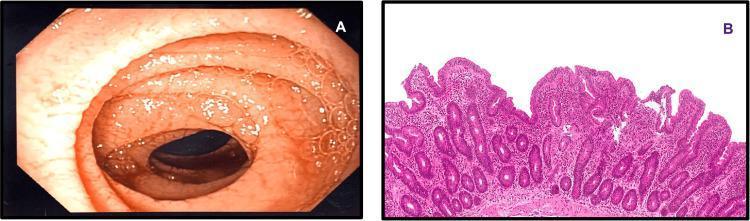
This dual-panel image displays diagnostic findings characteristic of Celiac disease in the second part of the duodenum. Panel A is an endoscopic photograph (clinical imaging) showing gross mucosal atrophy. Key visual features include the loss of normal mucosal texture and distinctive scalloping of the circular folds (plicae circulares). Panel B is a high-power light microscopy image of a duodenal biopsy stained with Hematoxylin and Eosin (H&E). It demonstrates histopathological changes classified as Marsh 3a, including moderate villous blunting (atrophy) and increased intraepithelial lymphocytosis. The educational focus is the correlation between endoscopic markers of malabsorption (scalloping) and the underlying microscopic structural damage (villous blunting and lymphocytic infiltration) used to confirm a gluten-sensitive enteropathy diagnosis in a clinical setting.
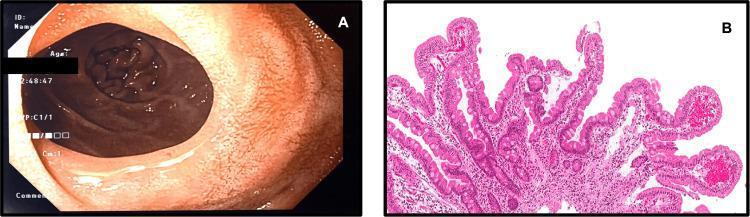
Educational medical composite featuring endoscopic and histological views of the duodenum post-treatment for celiac disease. Image A shows a clinical endoscopic view of the second part of the duodenum. The lumen is patent and unobstructed, indicating resolution of a prior stricture. The mucosal surface appears healthy with visible circular folds (plicae circulares) and no evidence of scalloping or atrophy. Image B is a high-power light microscopy image of a duodenal biopsy stained with Hematoxylin and Eosin (H&E). It demonstrates normal villous architecture consistent with a Marsh 0 classification. The villi are elongated, slender, and finger-like with a normal villus-to-crypt ratio. The epithelial lining is intact, and the lamina propria contains a normal distribution of cellular components without significant lymphocytic infiltration or blunting. Collectively, these images illustrate the successful mucosal and structural healing of the small intestine following a gluten-free diet and mechanical intervention.
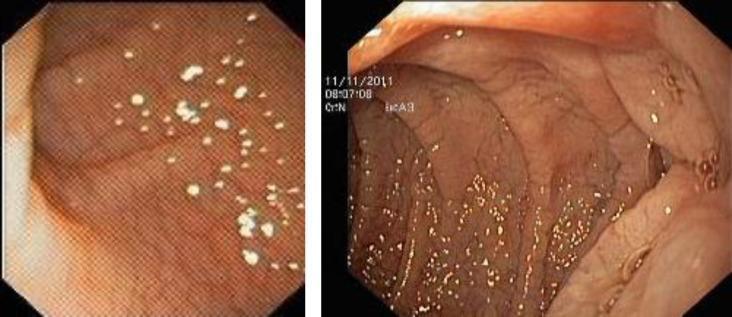
Two side-by-side endoscopic images showing the distal duodenum, typical of celiac disease. The images demonstrate classic endoscopic markers of villous atrophy: the circular Kerckring folds exhibit prominent 'scalloping' or notched edges. The mucosal surface displays a 'cracked-mud' appearance, characterized by fine fissures and a mosaic-like pattern. Additionally, numerous small, white granular deposits are visible across the mucosal lining. These visual findings indicate significant enteropathy, often graded pathologically as Marsh type 3 (total villous atrophy). This clinical photograph is used in gastroenterology for the diagnostic workup of malabsorption syndromes and gluten-sensitive enteropathy.
Celiac Disease - MD Pathology Exam Notes
Definition
- Worldwide prevalence ~1%; women affected 2-3x more than men
- Strong link with HLA-DQ2 (present in ~90-95%) and HLA-DQ8 (~5-10%)
Pathogenesis
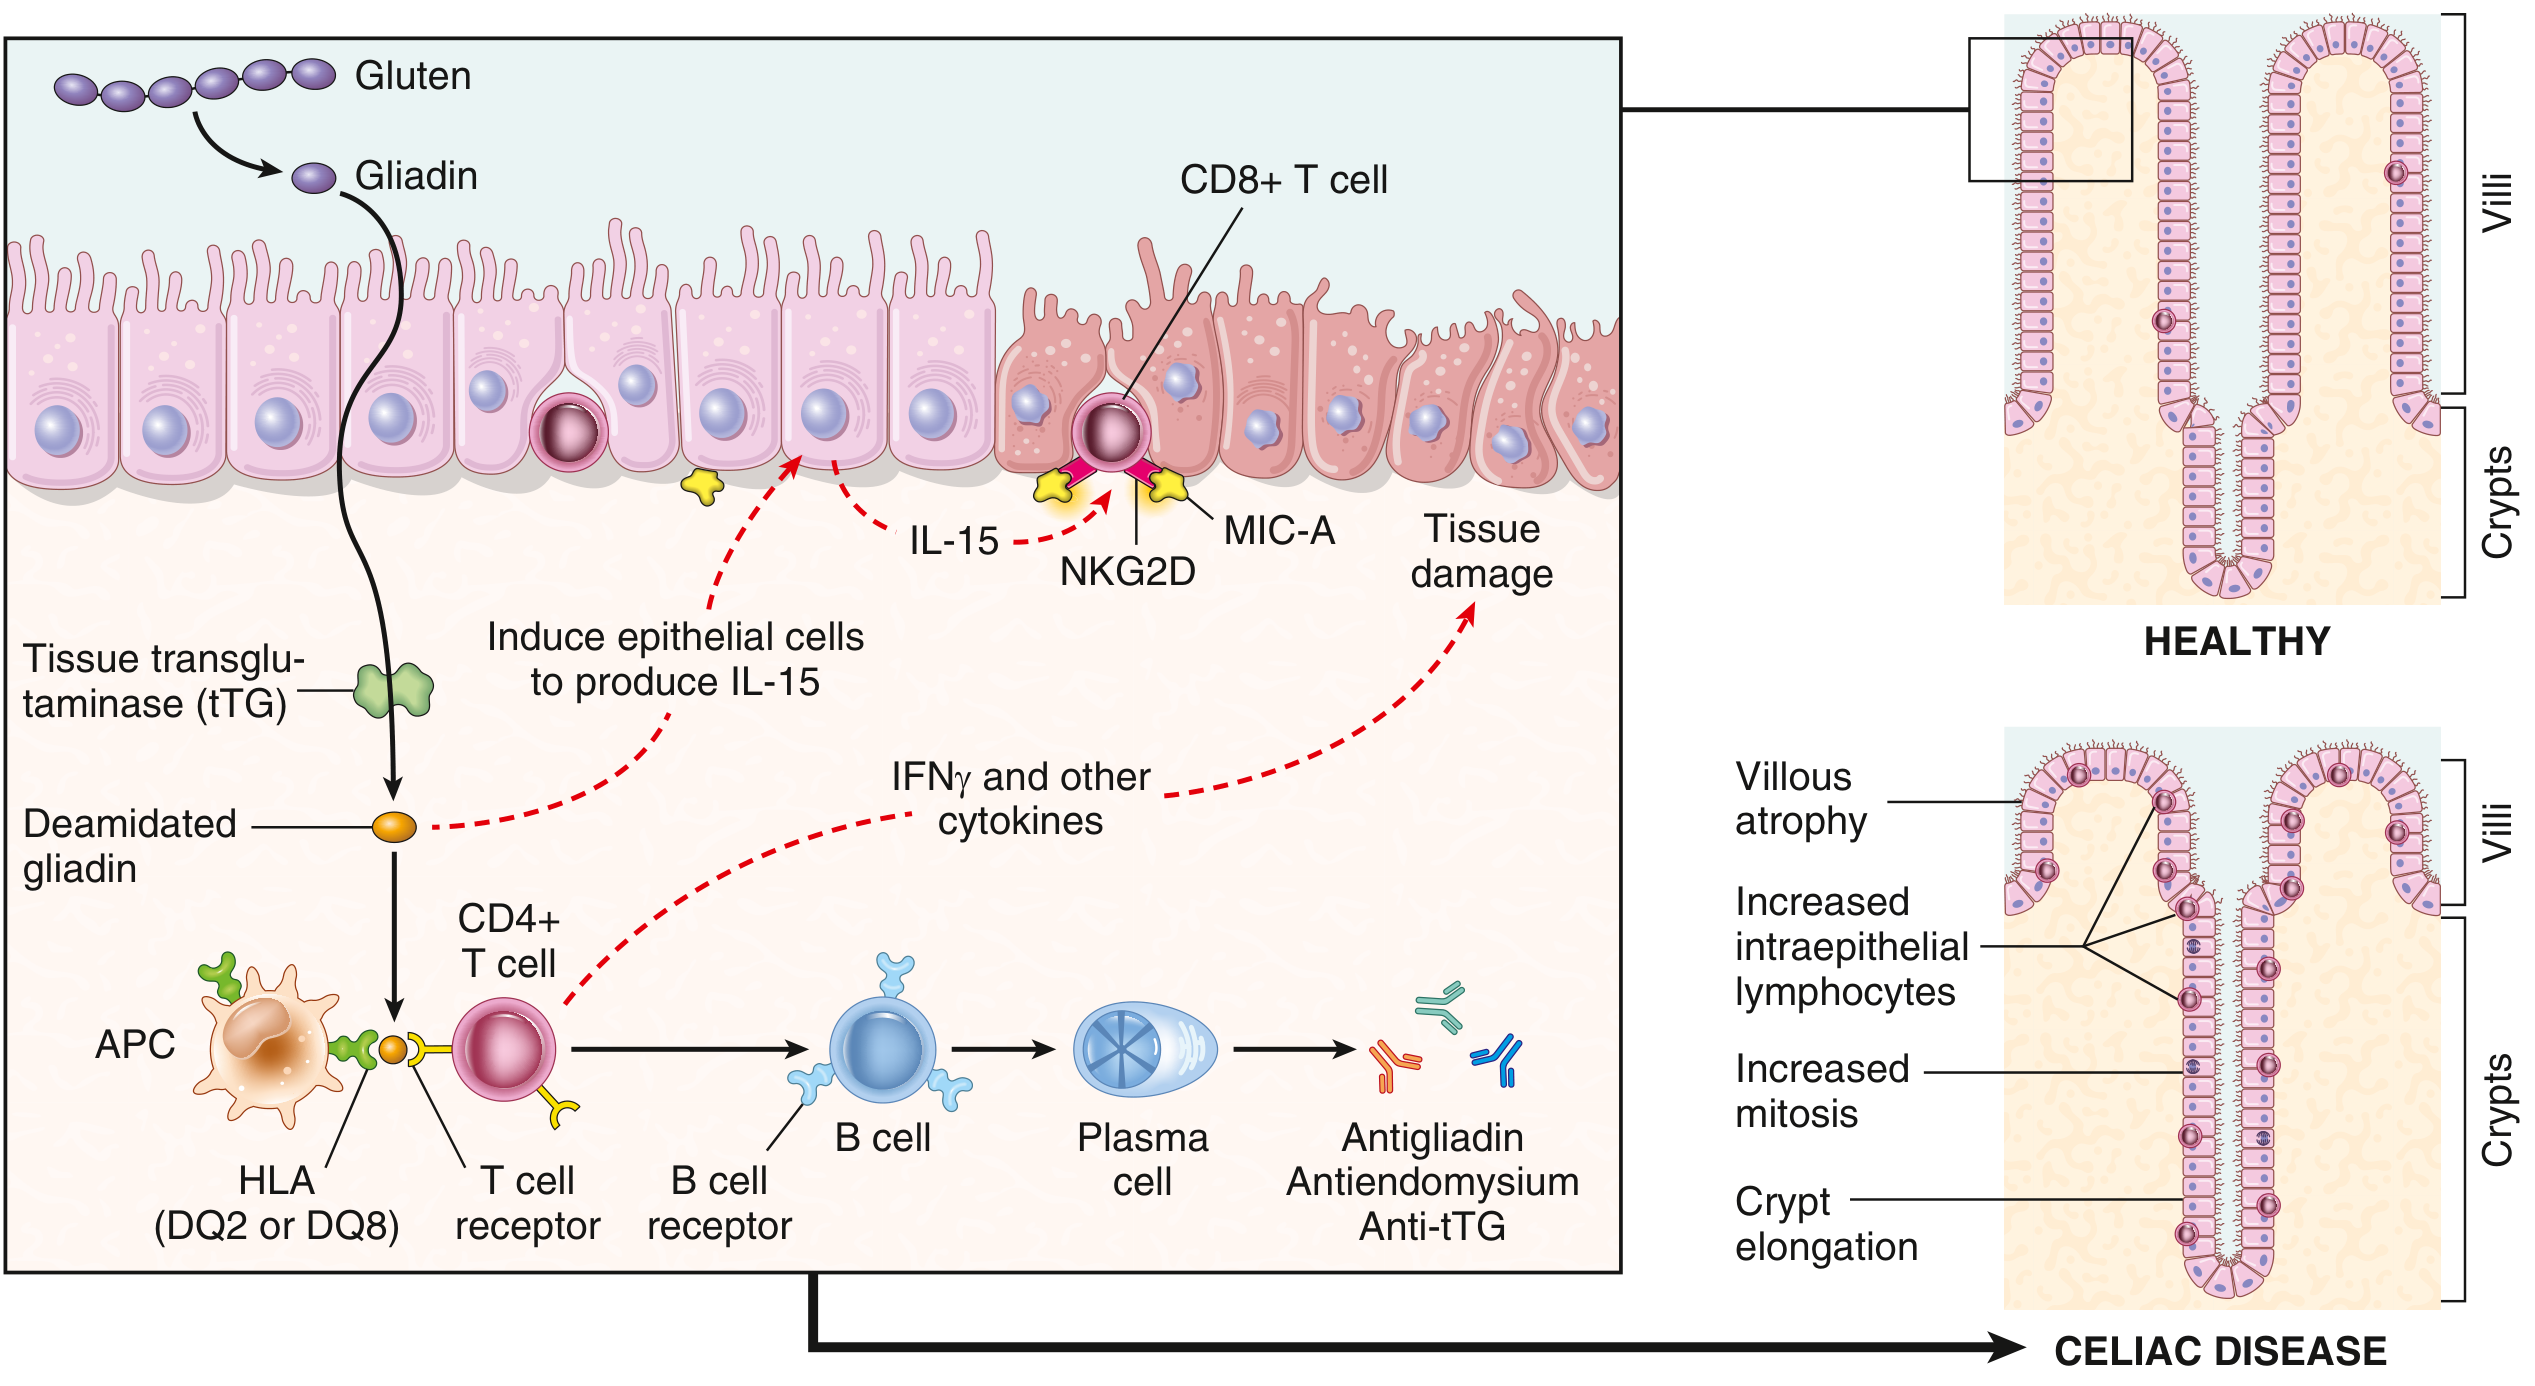
Step-by-step mechanism:
-
Gluten ingestion - Gluten is the water-insoluble storage protein complex from wheat, rye, and barley.
-
Gliadin formation - Luminal and brush-border enzymes digest gluten into a 33-amino acid gliadin peptide that is resistant to further proteolysis.
-
Deamidation by tissue transglutaminase (tTG) - tTG in the lamina propria converts gliadin peptides to deamidated gliadin, greatly increasing their binding affinity to HLA-DQ2/DQ8 on antigen-presenting cells (APCs).
-
CD4+ T cell activation - Deamidated gliadin is presented via HLA-DQ2/DQ8 to CD4+ T cells → release of IFN-γ and other cytokines → lamina propria inflammation and epithelial injury.
-
B cell activation - Activated CD4+ T cells stimulate B cells → plasma cells → production of:
- Anti-tissue transglutaminase antibodies (anti-tTG IgA/IgG)
- Anti-endomysial antibodies (EMA)
- Anti-deamidated gliadin peptide antibodies (DGP)
-
CD8+ T cell / intraepithelial lymphocyte (IEL) role - Deamidated gliadin induces epithelial cells to produce IL-15, which activates CD8+ intraepithelial lymphocytes expressing NKG2D receptors. These kill enterocytes expressing the stress molecule MIC-A (MHC class I polypeptide-related sequence A), perpetuating epithelial damage.
Exam key: Nearly all individuals with celiac disease express HLA-DQ2 or HLA-DQ8. ~35% of the general European population carries these alleles, so positivity alone has low diagnostic value - but negativity rules out celiac disease.
MORPHOLOGY (The Core Exam Topic)
Histological Features:
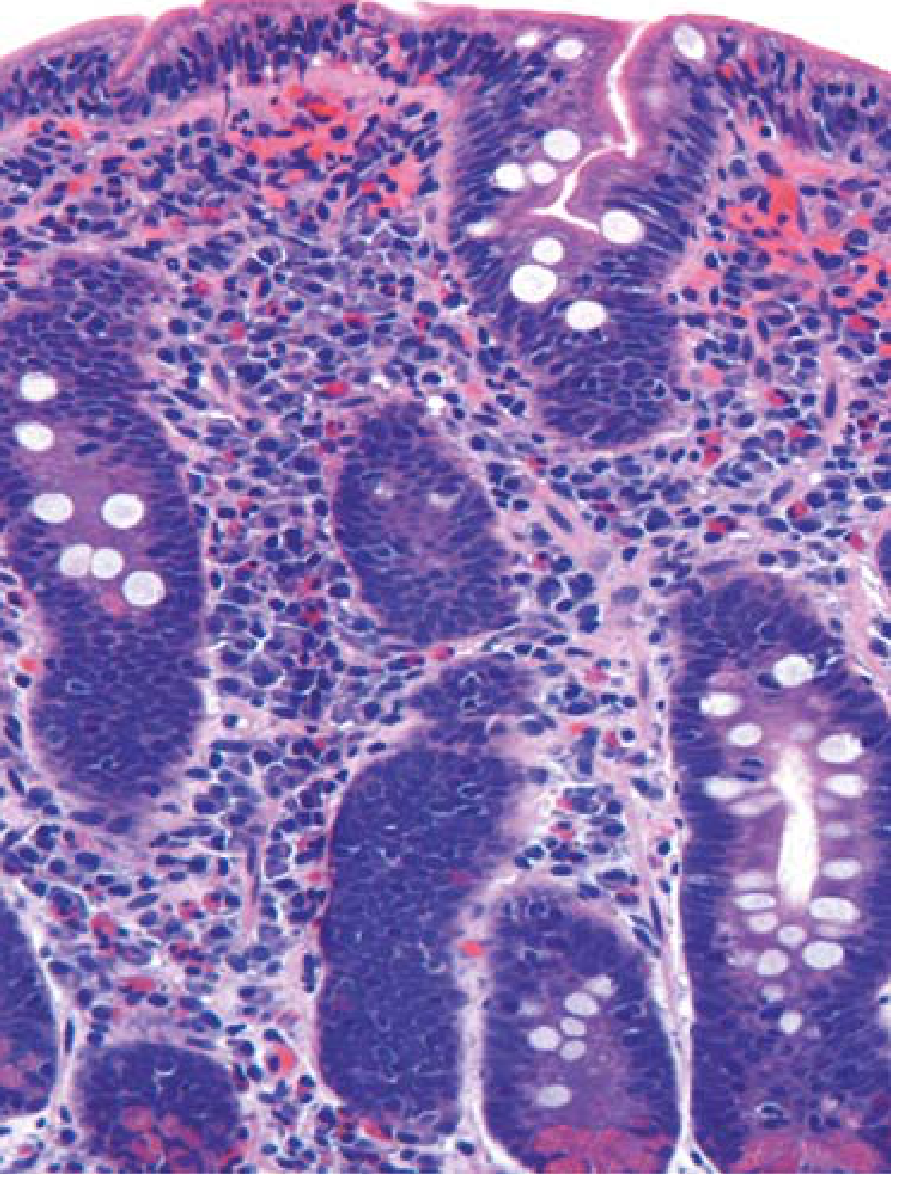
- Villous atrophy (blunting/flattening of villi) - reduces absorptive surface area → malabsorption
- Crypt hyperplasia (elongated crypts with increased mitoses) - reflects regenerative response
- Increased intraepithelial lymphocytes (IELs) - CD3+/CD8+ T cells; >25 IELs per 100 enterocytes is abnormal
- Dense plasma cells, mast cells, and eosinophils in upper lamina propria
- Epithelial cell flattening / cuboidal change
- Loss of brush border
Important: Villous atrophy + IEL infiltration is not specific to celiac disease - also seen in viral enteritis, tropical sprue, Crohn's, NSAID enteropathy, autoimmune enteropathy. Diagnosis requires serologic + histologic correlation.
Marsh Classification (Modified Oberhuber / Rostami)
| Grade | Name | Histology |
|---|---|---|
| Marsh 0 | Pre-infiltrative | Normal architecture; normal IEL count |
| Marsh I | Infiltrative | Normal villi; increased IELs (>25/100 enterocytes) |
| Marsh II | Hyperplastic | Increased IELs + crypt hyperplasia; villi still normal |
| Marsh III | Destructive | IELs + crypt hyperplasia + villous atrophy |
| - III-A | - | Partial villous atrophy |
| - III-B | - | Subtotal villous atrophy |
| - III-C | - | Total villous atrophy ("flat mucosa") |
| Marsh IV | Hypoplastic | Total villous atrophy + normal IEL count (reflects severe malnutrition; nonspecific) |
Multiple biopsies (4-6) from the 2nd and 3rd parts of the duodenum are required because changes can be patchy.
Endoscopic Features
- Scalloping of duodenal folds (most recognized endoscopic sign)
- Flattening of duodenal folds
- Nodularity ("mosaic" or "cracked-mud" mucosal pattern)
- Loss of Kerckring folds
Clinical Spectrum
Classical (malabsorptive) celiac disease:
- Chronic diarrhea, steatorrhea
- Abdominal bloating, distension
- Weight loss, failure to thrive (children)
- Nutritional deficiencies
Non-classical (extraintestinal) presentations:
- Iron deficiency anemia (most common presenting feature in adults; due to reduced duodenal iron absorption)
- Folate/B12 deficiency
- Osteoporosis (Ca/Vit D malabsorption)
- Infertility / recurrent miscarriage
- Peripheral neuropathy, ataxia
- Elevated transaminases ("cryptogenic hepatitis")
- Aphthous stomatitis
- Fatigue
Silent celiac disease:
- Positive serology + villous atrophy on biopsy, but no symptoms
Potential celiac disease:
- Positive serology + normal histology + HLA-DQ2/DQ8 positive
Associations / Conditions Linked to Celiac Disease
| Condition | Notes |
|---|---|
| Dermatitis herpetiformis (DH) | "Celiac disease of the skin"; IgA deposits in papillary dermis; autoantigen is epidermal transglutaminase (type 3 tTG), not type 2 tTG; treated with dapsone + GFD |
| Type 1 Diabetes mellitus | ~5-10% of T1DM have celiac; shared HLA-DQ2/DQ8 |
| Down syndrome | ~5-12% have celiac disease |
| IgA deficiency | Increases false-negative IgA-based serology → use IgG-based tests |
| Autoimmune thyroid disease (Hashimoto's, Graves') | ~20% of adult celiac patients |
| Microscopic colitis | Associated; contributes to diarrhea |
| Sjögren syndrome, type 1 diabetes, thyroiditis | Other immune associations |
Serology (Diagnosis)
| Test | Sensitivity | Specificity | Notes |
|---|---|---|---|
| IgA anti-tTG (tissue transglutaminase) | ~95-98% | ~95% | Best first-line test; gold standard serology |
| IgA anti-endomysial (EMA) | ~85-90% | ~99% | Highly specific; operator-dependent (IF-based) |
| IgA/IgG anti-deamidated gliadin (DGP) | ~85-90% | ~90% | Better than AGA; useful in IgA deficiency (IgG) |
| Antigliadin antibodies (AGA-IgA/IgG) | Low | Low | No longer recommended - too many false positives |
| HLA-DQ2/DQ8 testing | ~100% NPV | Low PPV | Not for diagnosis; used to exclude celiac (high negative predictive value) |
In selective IgA deficiency (~2% of celiac patients), all IgA-based tests are falsely negative - use IgG-based tTG or IgG-DGP instead.
Diagnosis - Gold Standard
- 4-6 biopsies from 2nd and 3rd parts of duodenum
- Correlation with serology is essential (histology not specific alone)
- Diagnosis confirmed when: positive serology + characteristic histology (Marsh III) + clinical/histologic response to GFD
Complications
Refractory Celiac Disease (RCD)
- Ongoing symptoms/villous atrophy despite strict GFD for >6-12 months
- Type I RCD: Normal IEL phenotype; better prognosis
- Type II RCD: Aberrant, clonally expanded IELs (abnormal CD3+/CD8- phenotype); precursor to EATL; poor prognosis
Enteropathy-Associated T-Cell Lymphoma (EATL)
- Most common malignancy complicating celiac disease
- Arises from intraepithelial T lymphocytes (CD8+ IELs)
- Aggressive tumor; diffuse and multifocal
- Presents with abdominal pain, weight loss, obstruction, perforation
- T-cell receptor gene rearrangement (monoclonal)
- Type II RCD → ulcerative jejunoileitis → EATL (a continuum)
- Prognosis very poor: 1-year survival ~31%, 5-year survival ~11%
Small Intestinal Adenocarcinoma
- Also increased risk in celiac disease
Ulcerative Jejunoileitis
- Multiple ulcers with mucosal atrophy; precursor to EATL
Endoscopic/Macro Images
Treatment
- Lifelong gluten-free diet (GFD) - eliminates wheat, rye, barley (oats may be tolerated if uncontaminated)
- Nutritional supplementation (iron, folate, B12, calcium, vitamin D)
- Corticosteroids for refractory disease / celiac crisis
- Monitoring: repeat serology (anti-tTG IgA) to confirm dietary compliance; levels fall with GFD
High-Yield Exam Points Summary
| Feature | Key Fact |
|---|---|
| Trigger | Gliadin (alcohol-soluble fraction of gluten) |
| Key enzyme | Tissue transglutaminase (tTG) - deamidates gliadin |
| HLA | DQ2 (90-95%), DQ8 (5-10%) - present in ALL patients |
| Best serology | IgA anti-tTG (95-98% sensitive) |
| Most specific serology | IgA anti-EMA (99% specific) |
| Gold standard diagnosis | Small bowel biopsy (4-6 samples from 2nd/3rd duodenum) |
| Classic histology | Villous atrophy + crypt hyperplasia + increased IELs |
| Skin manifestation | Dermatitis herpetiformis (IgA deposits in papillary dermis) |
| Most feared complication | EATL (T-cell lymphoma from IELs) |
| Worst prognosis subset | Type II RCD → EATL continuum |
| False-negative serology | IgA deficiency - use IgG-based tests |
| Treatment | Lifelong gluten-free diet |
| IEL cutoff | >25 IELs per 100 enterocytes = abnormal |