
from Guyton and Hall textbook of medical physiology, 4th South Asia edition write a 5 mark short note on .Connections of Unipolar and Bipolar Limb Leads while regarding ECG
Short Note: Connections of Unipolar and Bipolar Limb Leads in ECG
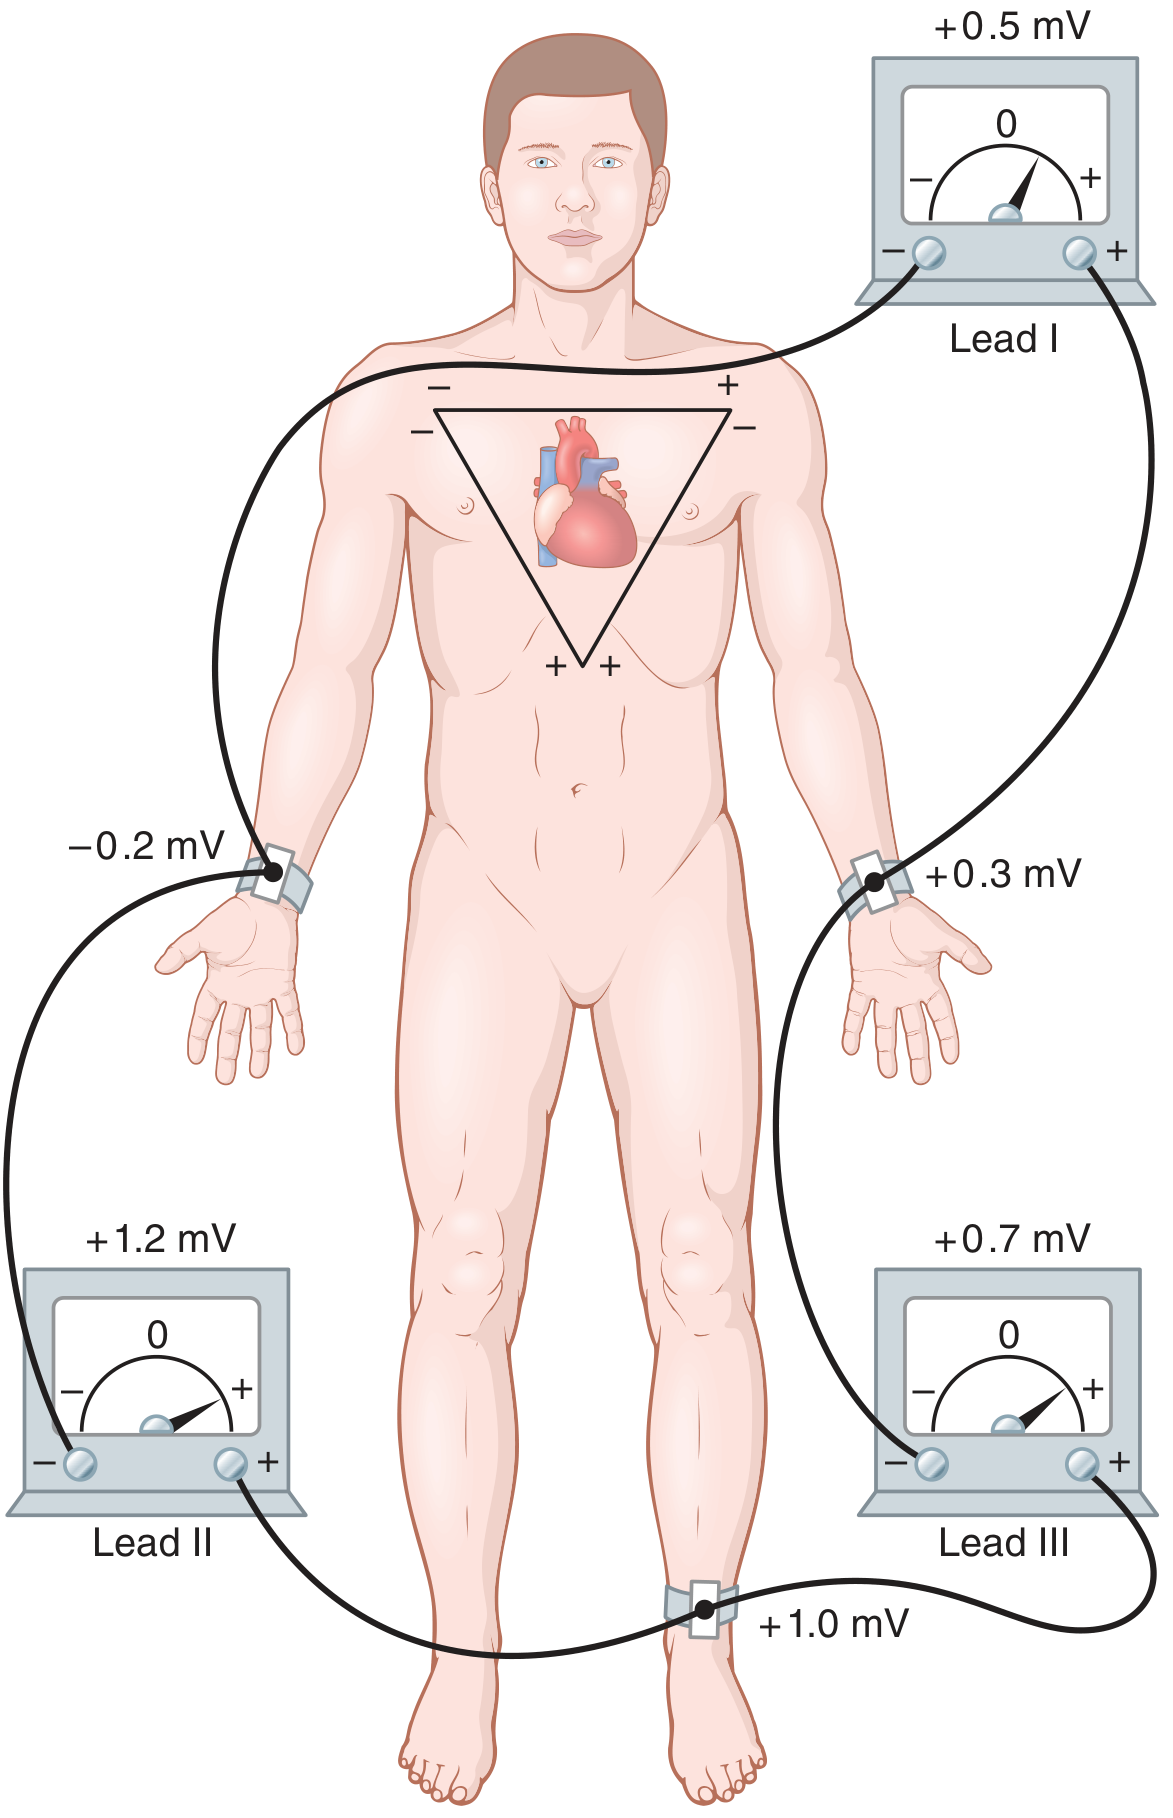
1. Bipolar Limb Leads (Standard Limb Leads: I, II, III)
| Lead | Negative Terminal | Positive Terminal | Records positively when... |
|---|---|---|---|
| Lead I | Right arm (RA) | Left arm (LA) | RA is electronegative with respect to LA |
| Lead II | Right arm (RA) | Left leg (LL) | RA is negative with respect to LL |
| Lead III | Left arm (LA) | Left leg (LL) | LA is negative with respect to LL |
Lead I + Lead III = Lead II
2. Unipolar Limb Leads (Augmented Limb Leads: aVR, aVL, aVF)
- Two limbs are connected through equal electrical resistances to the negative terminal
- The third limb is connected to the positive terminal
| Lead | Positive Terminal | Negative Terminal (combined through resistances) |
|---|---|---|
| aVR | Right arm (RA) | Left arm + Left leg |
| aVL | Left arm (LA) | Right arm + Left leg |
| aVF | Left leg (LL) | Right arm + Left arm |
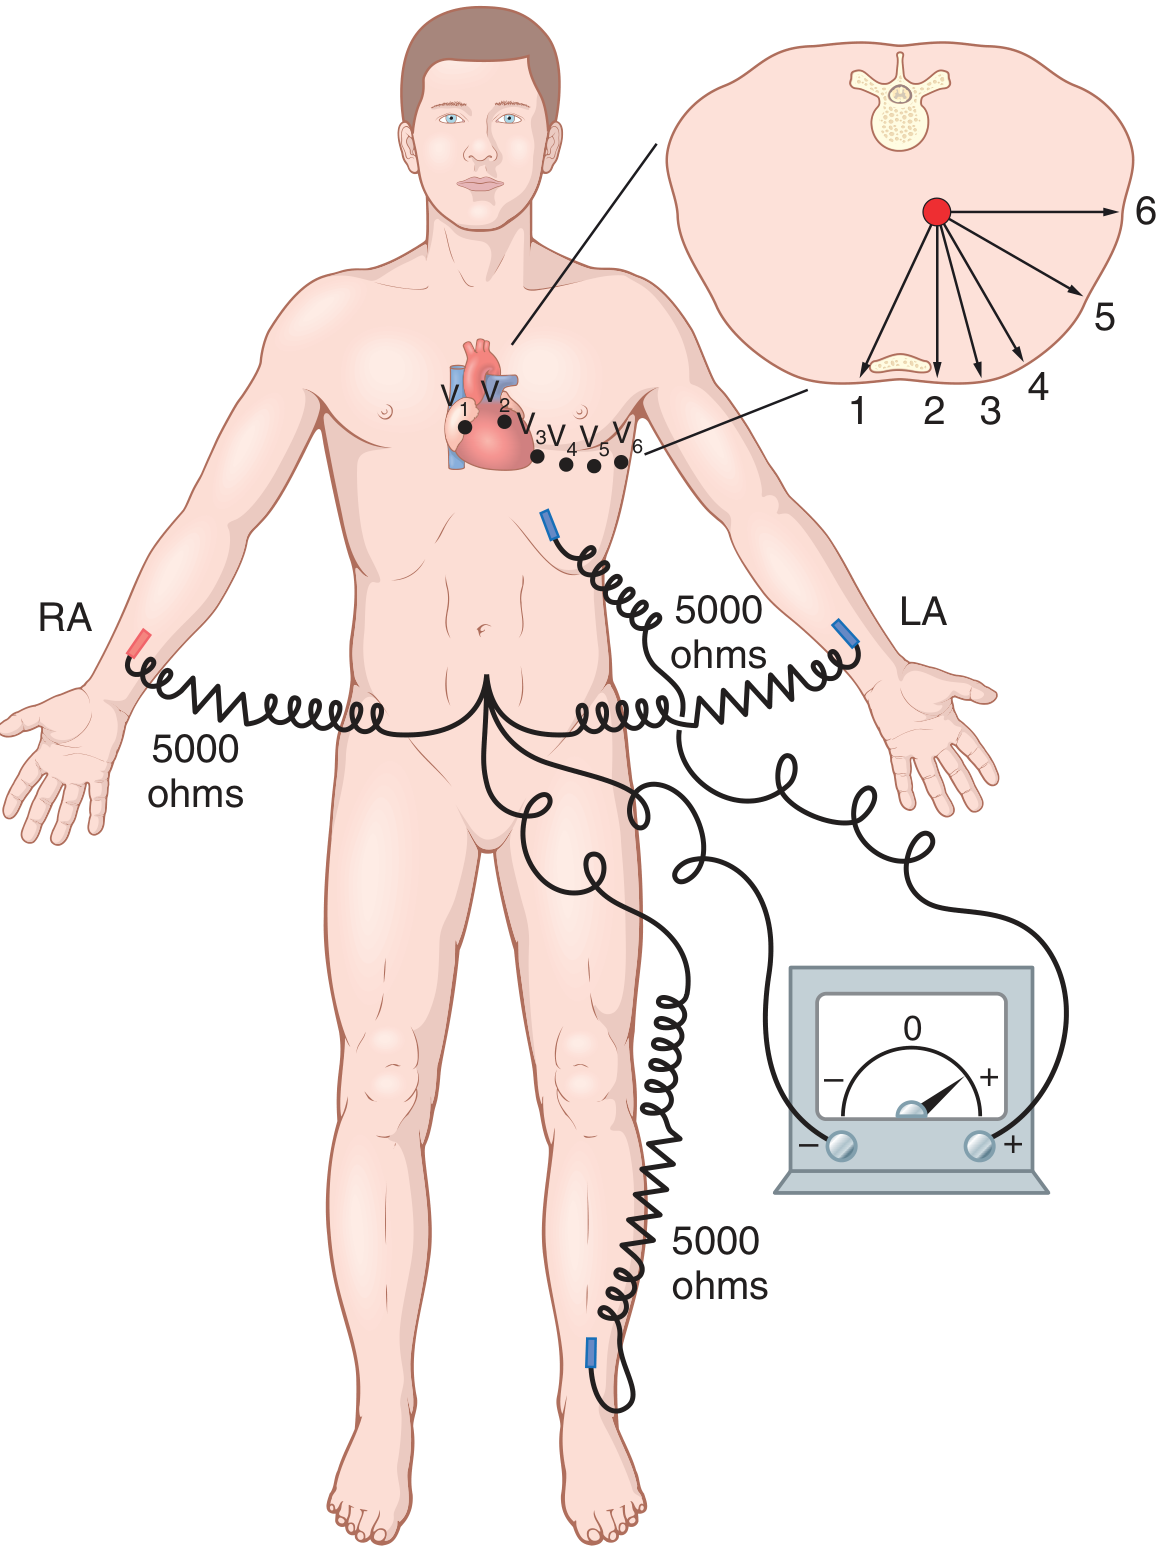
3. Unipolar Precordial (Chest) Leads (V1-V6)
Summary Table
| Feature | Bipolar Limb Leads | Unipolar Augmented Leads | Unipolar Precordial Leads |
|---|---|---|---|
| Leads | I, II, III | aVR, aVL, aVF | V1-V6 |
| Positive electrode | One limb | One limb | Chest wall |
| Negative electrode | Another limb | Average of other two limbs | Wilson central terminal (RA + LA + LL via 5000Ω) |
| Principle | Potential difference between two limbs | Absolute potential at one limb | Absolute potential at chest point |
from Guyton and Hall textbook of medical physiology, 4th South Asia edition write a 5 mark short note on .ECG Trace inLead II -draw, label,mark interval
A clean, detailed ECG trace in Lead II on graph paper background showing one complete cardiac cycle. Label all the following components clearly with arrows: P wave (small positive deflection for atrial depolarization), Q wave (small negative deflection), R wave (tall positive deflection, the tallest peak), S wave (small negative deflection after R), T wave (broad positive deflection for ventricular repolarization), U wave (small optional positive deflection after T). Mark all intervals with double-headed arrows and text: PR interval (0.16 sec, from start of P to start of QRS), QRS interval (0.08 sec, duration of QRS complex), QT interval (0.35 sec, from start of Q to end of T), RR interval (0.83 sec, between two consecutive R peaks), ST segment (isoelectric flat segment between S and T). Y-axis labeled Millivolts with +1.0 at top and -1.0 at bottom, zero baseline marked. X-axis labeled Time in seconds. Medical textbook style diagram, black and red on white background with grid lines.
404 Not Found. {'message': '{\n "error": {\n "code": 404,\n "message": "Publisher model `projects/engaged-beaker-474810-u2/locations/global/publishers/google/models/gemini-3-pro-image-preview` was not found or your project does not have access to it. Ensure you are using a valid model name and that the model is available in the specified region. For more information, see: https://docs.cloud.google.com/gemini-enterprise-agent-platform/resources/locations.",\n "status": "NOT_FOUND"\n }\n}\n', 'status': 'Not Found'}
We encountered an error while processing your request. Please try again or reach out to us for help.