
Explain myocRdial i farction in detail
myocardial infarction pathology ECG coronary artery occlusion
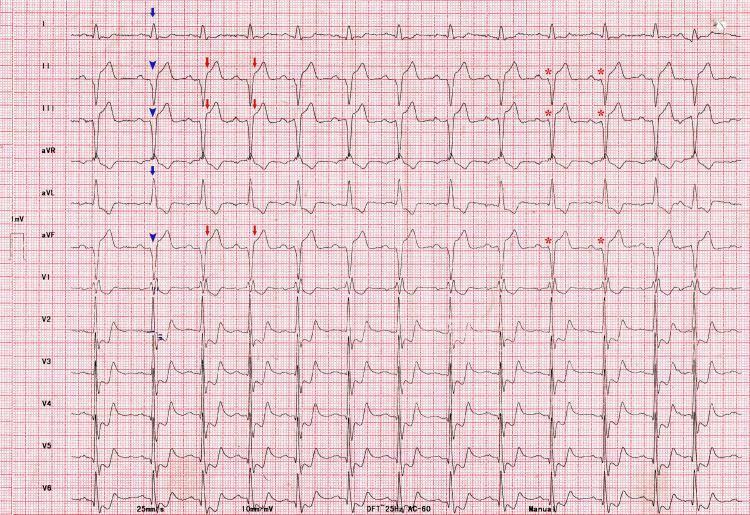
This diagnostic image is a 12-lead electrocardiogram (ECG) demonstrating multiple acute and chronic conduction abnormalities consistent with a multi-vessel or proximal culprit coronary artery occlusion. The tracing shows a Right Bundle Branch Block (RBBB) combined with Left Axis Deviation (LAD), indicated by qR complexes in leads I and aVL and rS complexes in inferior leads (II, III, aVF), diagnostic of a co-existing Left Anterior Hemiblock (LAHB). Acute pathology is evident by significant ST-segment elevation (approximately 3 mm) in the inferior leads (II, III, aVF), representing an acute inferior ST-elevation myocardial infarction (STEMI). Furthermore, the precordial leads (V1-V6) exhibit downsloping ST-segment depression. In V1 and V2, the presence of tall R waves (R/S ratio > 1) alongside ST depression is highly suggestive of a concomitant posterior wall myocardial infarction. The PR interval is approximately 200 ms. These combined findings signify extensive myocardial ischemia/infarction involving the inferior and posterior walls with significant trifascicular system involvement.
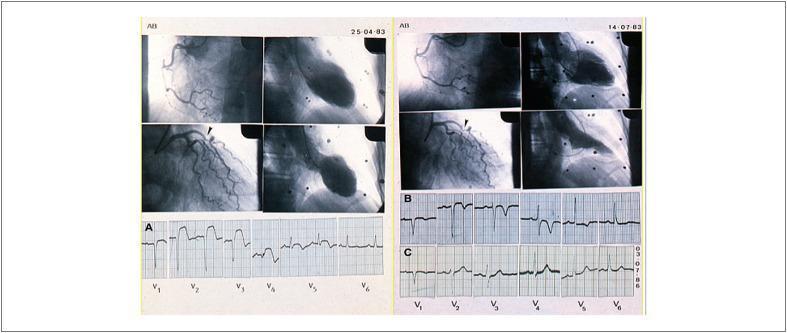
This composite medical image displays a longitudinal clinical case study involving coronary cineangiography, ventriculography, and serial electrocardiograms (ECG). The left panel (dated 25-04-83) depicts acute pathology: the coronary angiogram shows sub-occlusion of the left anterior descending (LAD) artery (arrowhead), and the ventriculogram demonstrates severe systolic dysfunction. Corresponding ECG (A) reveals significant ST-segment elevation in precordial leads V1-V3, consistent with an acute anterior myocardial infarction. The right panel (dated 14-07-83) shows the patient three months later; while the LAD sub-occlusion persists, the ventriculogram shows a notable recovery of left ventricular systolic function. ECG (B) reflects this progression with ST-segment recovery and deep T-wave inversion. A follow-up ECG (C) from 1986 shows a near-normalization of the tracing with the absence of pathological Q waves, suggesting myocardial recovery and a lack of significant residual fibrosis. This image serves as an educational tool for cardiology, illustrating the correlation between angiographic findings, ventricular hemodynamics, and the temporal evolution of ischemic ECG changes.
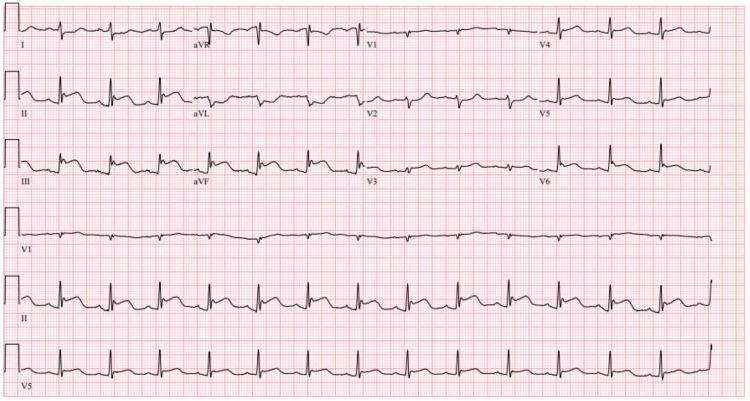
A standard 12-lead electrocardiogram (ECG) printed on standard red grid paper, demonstrating findings consistent with an acute inferior wall myocardial infarction (STEMI). The primary visual pathology includes significant ST-segment elevation in the inferior leads (II, III, and aVF). In lead III, the ST elevation is more pronounced than in lead II, a feature often associated with right ventricular involvement or a right coronary artery (RCA) occlusion. Reciprocal ST-segment depressions are visible in the lateral leads, particularly in lead I and aVL. The precordial leads (V1-V6) show mild ST-segment changes, with some flattening in V2 and V3. The QRS complexes are relatively narrow, and the baseline rhythm appears to be a regular sinus rhythm. This diagnostic image serves as a classic educational example of an ST-elevation myocardial infarction (STEMI) involving the inferior myocardial wall, highlighting the importance of recognizing regional lead patterns and reciprocal changes in emergency cardiology.
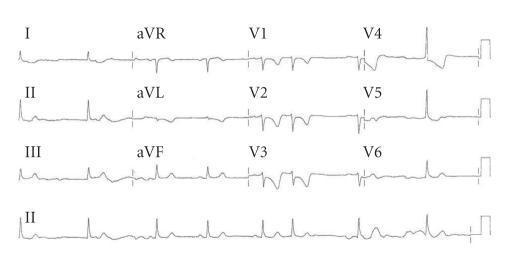
This diagnostic image is a 12-lead electrocardiogram (ECG) demonstrating signs consistent with an acute inferoposterior myocardial infarction. The tracing shows sinus rhythm with intermittent heart block. Notable pathology includes significant ST-segment elevation in the inferior leads (II, III, and aVF), indicating an inferior wall injury pattern. Concurrently, there is evidence of reciprocal changes and posterior involvement, characterized by horizontal ST-segment depression and prominent asymmetric T-wave inversions across the precordial leads, specifically from V2 through V5. The T-wave inversion is most pronounced and deep in lead V2, with a gradual decrease in depth toward V5. These findings are critical for the diagnosis of ST-elevation myocardial infarction (STEMI) involving the inferior and posterior myocardial segments, often associated with occlusion or severe vasospasm of the right coronary artery or circumflex artery.
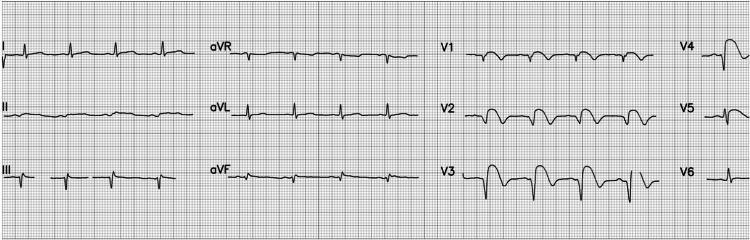
A 12-lead electrocardiogram (ECG) demonstrating an acute ST-elevation myocardial infarction (STEMI) with characteristic anterior and anterolateral findings. The tracing displays a normal sinus rhythm with a heart rate of approximately 84 beats per minute and normal P wave morphology. Significant pathology is localized to the precordial leads, specifically V2 through V5, which exhibit pronounced ST-segment elevation. This elevation presents with a convex 'tombstoning' morphology, a high-risk indicator of extensive myocardial injury. Additionally, evolving QS waves are visible in leads V2 and V3, indicating necrotic changes or transmural infarction. These findings are clinically consistent with an acute occlusion of the left anterior descending (LAD) coronary artery. The limb leads (I, II, III, aVR, aVL, aVF) show relatively stable baselines, though mild reciprocal changes or secondary ST-T wave abnormalities may be present in the inferior leads. This diagnostic image serves as a classic educational example of early-stage STEMI progression and the visual identification of localized ischemic injury on electrocardiography.
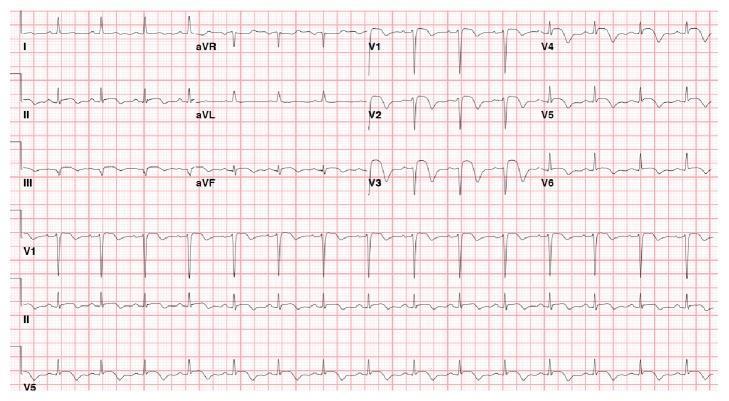
A 12-lead electrocardiogram (ECG) recorded on standard grid paper, demonstrating acute diagnostic findings consistent with an ST-elevation myocardial infarction (STEMI). The tracing shows normal sinus rhythm with a physiological heart rate. The primary pathology is significant ST-segment elevation (STE) visible in the precordial leads, most prominently in V2, V3, and V4, measuring approximately 2–3 mm above the isoelectric baseline. These anterior leads also display upright, peaked T waves associated with the acute ST elevation. The QRS complexes maintain relatively normal duration and morphology without evidence of bundle branch blocks. These findings are clinically diagnostic of acute myocardial injury in the territory of the left anterior descending (LAD) coronary artery, often indicating complications such as acute stent thrombosis or new-onset occlusion in the anteroseptal and apical regions. The limb leads (I, II, III, aVR, aVL, aVF) show relatively stable baselines compared to the precordial changes. This ECG serves as a critical educational tool for identifying hyperacute ischemic changes in a post-intervention clinical context.
"myocardial infarction"[MeSH Terms] AND "management"[MeSH Terms]
Myocardial Infarction (MI) - A Comprehensive Overview
1. Definition
2. Epidemiology & Risk Factors
- The frequency rises progressively with age and atherosclerotic risk factors
- ~10% of MIs occur before 40 years of age; 45% occur before 65 years
- Men are at greater risk than women, but the gap narrows with age
- Women are relatively protected during reproductive years due to estrogen; menopause accelerates risk
- IHD is the most common cause of death in older adult women
- Robbins & Kumar Basic Pathology, p. 354
3. Etiology and Pathogenesis
Primary Cause: Atherosclerotic Plaque Rupture
- An atheromatous plaque is eroded or suddenly disrupted by endothelial injury, intraplaque hemorrhage, or mechanical forces - this exposes subendothelial collagen and necrotic plaque contents to blood
- Platelets adhere, aggregate, and activate - releasing thromboxane A2, ADP, and serotonin, causing further platelet aggregation and vasospasm
- Coagulation is activated by exposure of tissue factor, adding to the growing thrombus
- Within minutes, the enlarging thrombus may completely occlude the coronary artery lumen
Less Common Causes (10% of MIs)
- Coronary artery vasospasm
- Embolization from mural thrombi (e.g., atrial fibrillation) or valve vegetations
- Small intramyocardial arteriolar disorders: vasculitis, amyloid deposition, sickle cell disease
- Robbins & Kumar Basic Pathology, p. 354
4. Coronary Artery Territories and Infarct Location
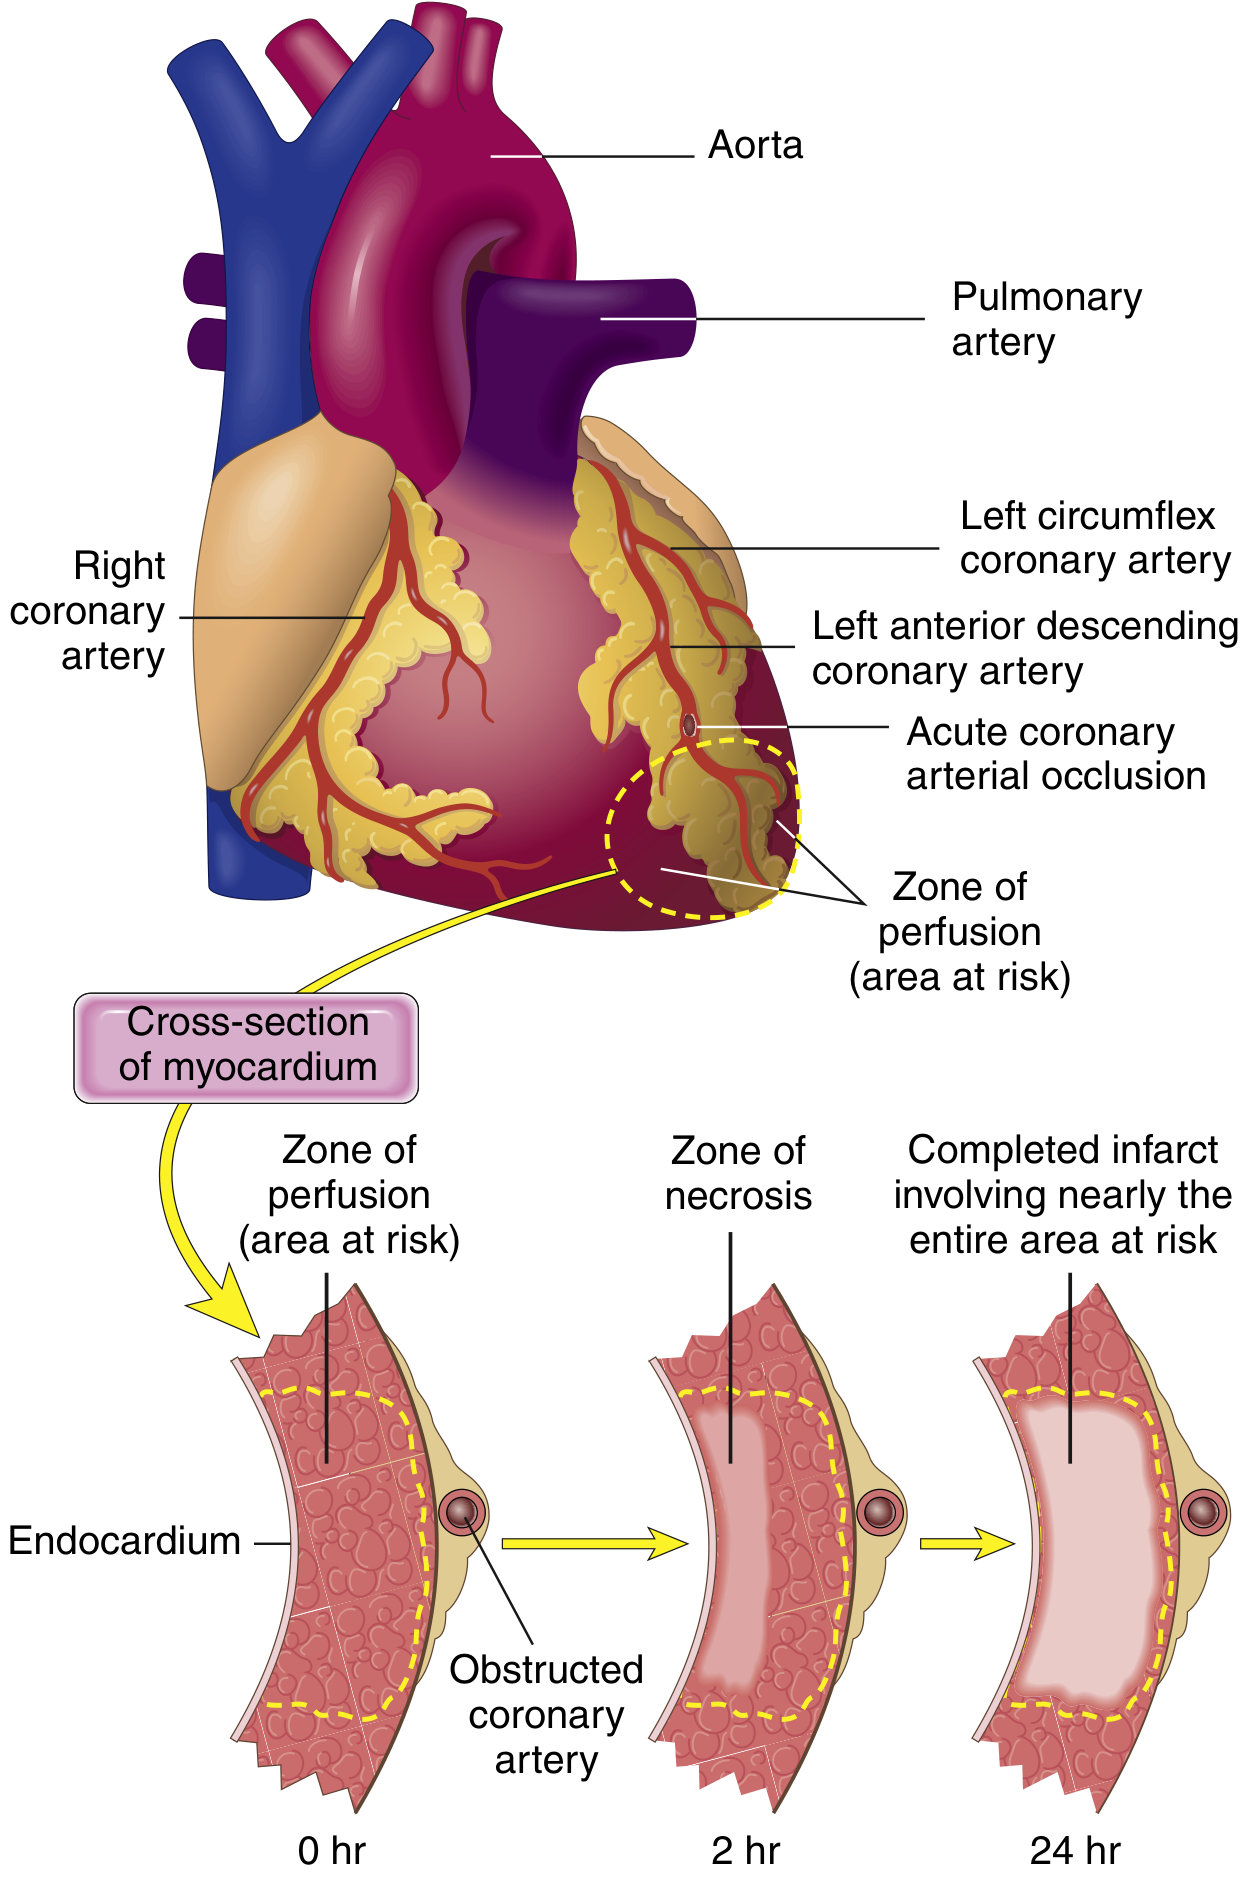
| Artery Occluded | Frequency | Area Infarcted |
|---|---|---|
| Left Anterior Descending (LAD) - proximal | 40-50% | Anterior LV wall, anterior 2/3 of septum, heart apex |
| Right Coronary Artery (RCA) - proximal | 30-40% | Much of right ventricle, posterior septum, inferior LV |
| Left Circumflex (LCX) - proximal | 15-20% | Lateral left ventricle |
5. Patterns of Infarction
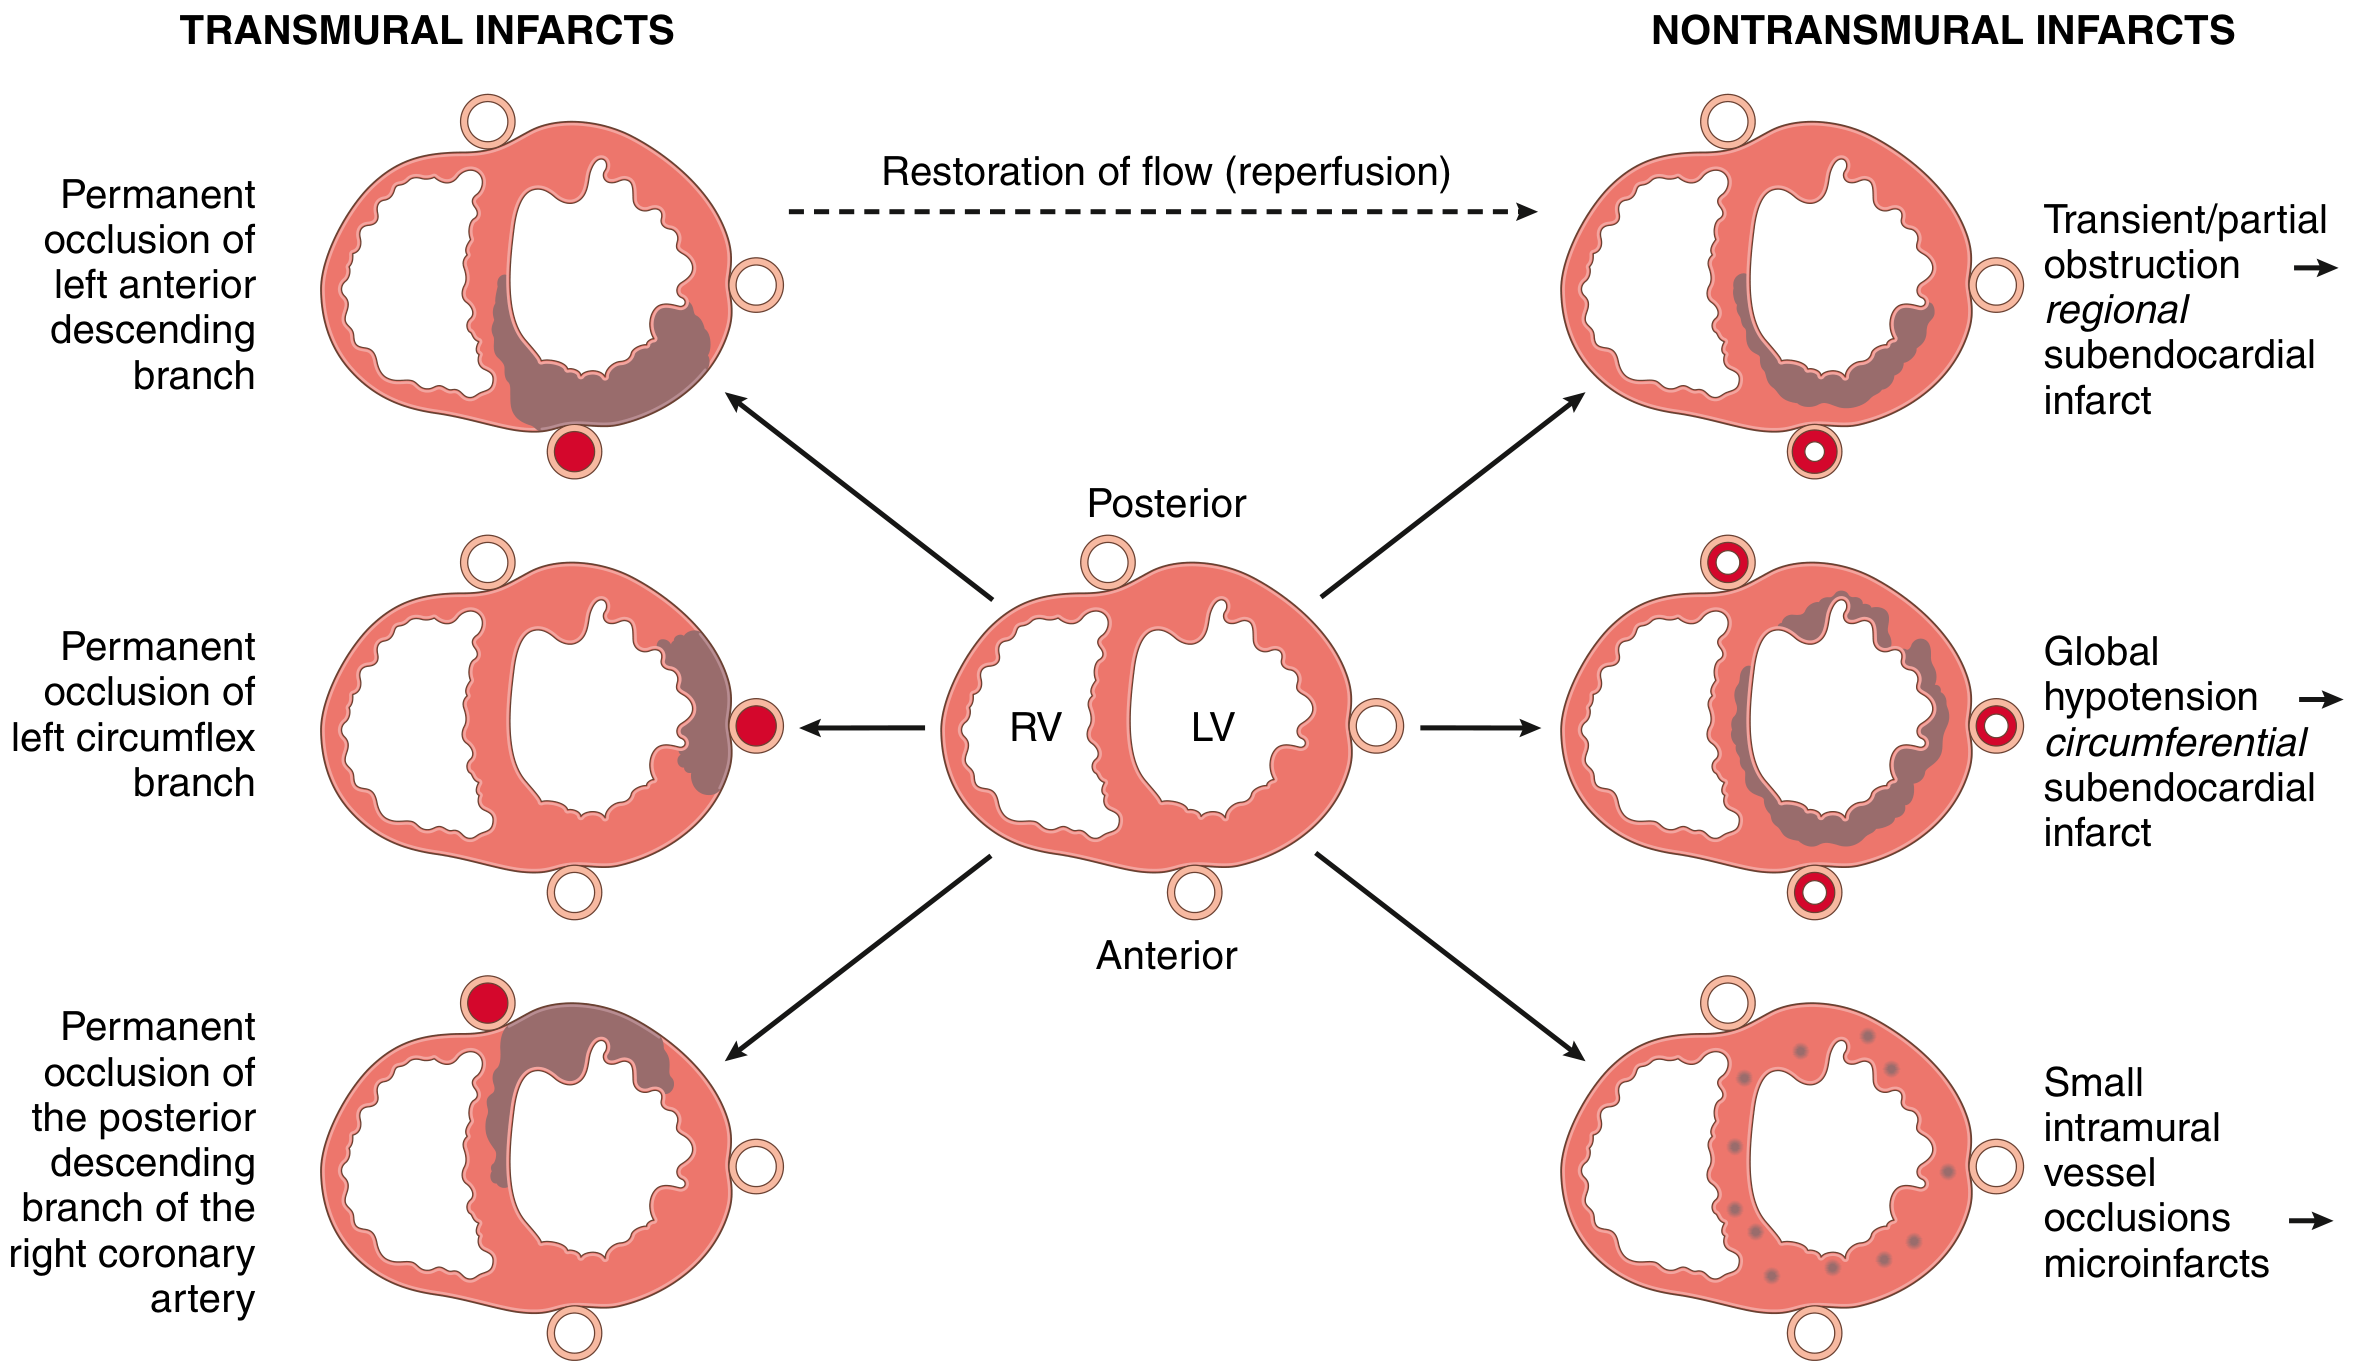
| Type | Description | Cause |
|---|---|---|
| Transmural | Full wall thickness | Complete epicardial vessel occlusion with thrombosis |
| Subendocardial | Inner 1/3 of myocardium | Partial/transient occlusion; thrombus lysed before necrosis becomes transmural |
| Microscopic | Multiple small foci | Small-vessel occlusions (vasculitis, embolism, cocaine-induced spasm) |
| Circumferential subendocardial | Rings the entire inner LV | Global hypotension superimposed on severe 3-vessel disease |
6. Myocardial Response to Ischemia
- Aerobic metabolism ceases
- ATP drops; lactic acid accumulates
- Contractility is lost within minutes
- Irreversible coagulative necrosis begins
- Sarcolemmal membrane disruption releases intracellular macromolecules (troponins, CK-MB, LDH) into blood - the basis of cardiac biomarker testing
- An infarct achieves its full extent in 3 to 6 hours
Stunned Myocardium
7. Morphologic Changes Over Time
| Time Frame | Gross Features | Light Microscopy | EM Findings |
|---|---|---|---|
| 0-30 min | None | None | Relaxation of myofibrils; glycogen loss; mitochondrial swelling |
| 30 min - 4 hrs | None | Usually none; variable waviness of fibers at border | Sarcolemmal disruption; mitochondrial amorphous densities |
| 4-12 hrs | Occasional dark mottling | Onset coagulation necrosis; edema; hemorrhage | - |
| 12-24 hrs | Dark mottling | Coagulation necrosis; pyknosis of nuclei; hypereosinophilic myocytes; contraction band necrosis; early neutrophilic infiltrate | - |
| 1-3 days | Mottling with yellow-tan center | Coagulation necrosis with loss of nuclei and striations; increased neutrophils | - |
| 3-7 days | Hyperemic border; central yellow-tan softening | Disintegration of dead myofibers; early macrophage phagocytosis at border | - |
| 7-10 days | Maximally yellow-tan and soft; depressed red-tan margins | Well-developed phagocytosis; early granulation tissue at margins | - |
| 10-14 days | Red-gray depressed borders | Well-established granulation tissue with new blood vessels and collagen deposition | - |
| 2-8 weeks | Gray-white scar progressing from border inward | Increased collagen; decreased cellularity | - |
| >2 months | Dense white scar | Dense collagenous scar | - |
8. Clinical Features
Symptoms
- Severe, crushing, pressure-like chest pain - classically radiating to the left arm, jaw, neck, or back
- Diaphoresis (cold sweat), nausea, vomiting
- Dyspnea
- Sense of impending doom (angor animi)
- Silent MI - up to 25% of MIs are painless (especially in diabetics and elderly) - detected incidentally on ECG or biomarkers
Signs
- Tachycardia, hypotension (in large infarcts/cardiogenic shock)
- S3 or S4 gallop
- New mitral regurgitation murmur (papillary muscle dysfunction)
- Pericardial friction rub (Dressler's syndrome, days later)
9. ECG Changes
| Defect in Infarcted Cells | Current Flow | ECG Change |
|---|---|---|
| Rapid repolarization (accelerated K+ channel opening) | Out of infarct | ST segment elevation |
| Decreased resting membrane potential (loss of intracellular K+) | Into infarct | TQ segment depression (manifests as ST elevation) |
| Delayed depolarization | Out of infarct | ST segment elevation |
ECG Evolution
- Hyperacute T waves - first minutes (tall, peaked T waves)
- ST elevation (STEMI) - hallmark of acute transmural MI
- Q wave formation - dead myocardium is electrically silent; pathological Q waves indicate irreversible necrosis
- T wave inversion - subacute phase
- ST normalization - days/weeks later
Reciprocal Changes
10. Cardiac Biomarkers
| Biomarker | Rise | Peak | Return to Normal | Notes |
|---|---|---|---|---|
| Troponin I / T | 3-6 hrs | 12-24 hrs | 7-14 days | Most sensitive and specific; gold standard |
| CK-MB | 4-8 hrs | 18-24 hrs | 48-72 hrs | Useful for detecting reinfarction |
| LDH | 12-24 hrs | 48-72 hrs | 7-10 days | Historical; LDH1 > LDH2 pattern |
| Myoglobin | 1-4 hrs | 6-8 hrs | 24 hrs | Early marker; not cardiac-specific |
11. Classification: STEMI vs. NSTEMI
| Feature | STEMI | NSTEMI |
|---|---|---|
| Mechanism | Complete occlusion | Partial/transient occlusion |
| ECG | ST elevation | ST depression, T-wave changes, or normal |
| Infarct type | Usually transmural | Usually subendocardial |
| Troponin | Elevated | Elevated |
| Treatment urgency | Emergency PCI within 90 min | Urgent (within 24-72 hrs) |
12. Complications of MI
Early (hours to days)
- Ventricular fibrillation - most common cause of sudden death in MI (80-90% of cardiac deaths in ischemia are due to VF); occurs due to electrical instability of ischemic zones
- Cardiogenic shock - occurs when >40% of LV is infarcted; mortality >50%
- Acute heart failure / pulmonary edema - from reduced LV systolic function
- Systolic stretch - ischemic myocardium bulges outward during systole instead of contracting, worsening pump failure - Guyton & Hall, p. 271
- Papillary muscle rupture - causes acute severe mitral regurgitation (day 3-5)
- Ventricular septal defect - septal rupture (day 3-5)
- Free wall rupture - catastrophic; leads to hemopericardium and tamponade (most common days 3-7, peak day 5)
Late (weeks to months)
- Dressler's syndrome - autoimmune pericarditis, 2-10 weeks post-MI
- LV aneurysm - thinning and outward bulging of scar tissue; promotes mural thrombus and persistent ST elevation
- Mural thrombus formation - in dyskinetic segments; risk of systemic embolism
- Reinfarction - especially with subendocardial (non-Q-wave) MIs
13. Management
Immediate Goals (MONA + Reperfusion)
| Drug | Dose | Purpose |
|---|---|---|
| Aspirin (ASA) | 162-325 mg (chewed) | Antiplatelet - immediate |
| P2Y12 inhibitor (ticagrelor 180 mg / prasugrel 60 mg / clopidogrel 600 mg) | Loading dose | Dual antiplatelet therapy |
| Nitroglycerin | SL or IV | Pain relief, afterload reduction (avoid if SBP < 90, RV infarct, recent PDE5 inhibitor) |
| Morphine | 2-4 mg IV | Refractory pain; reduces catecholamines |
| Anticoagulation | UFH / LMWH / bivalirudin | Prevent thrombus extension |
| Beta-blocker (oral) | Within 24 hrs | Reduces ischemia, limits infarct size, prevents arrhythmias (avoid in shock, acute HF) |
| O₂ | If SpO₂ < 90% | Supplemental oxygenation |
Reperfusion Strategy
- Door-to-balloon time: < 90 minutes
- If PCI-capable center not available within 120 min → fibrinolysis (within 12 hrs of symptom onset)
- After fibrinolysis → transfer to PCI center; rescue PCI if no reperfusion
Long-Term Secondary Prevention
| Drug Class | Benefit |
|---|---|
| Dual antiplatelet therapy | Minimum 12 months post-PCI |
| ACE inhibitor / ARB | Reduces LV remodeling and mortality (especially if EF < 40%) |
| Beta-blocker | Reduces mortality post-MI |
| Statin (high-intensity) | LDL reduction; plaque stabilization |
| Aldosterone antagonist (eplerenone) | If EF ≤ 40% with symptoms of HF |
14. Causes of Death After MI
- Decreased cardiac output (cardiogenic shock)
- Damming of blood in pulmonary vessels → pulmonary edema
- Ventricular fibrillation (most common sudden cause)
- Rupture of the heart (free wall rupture)
Summary
- Robbins & Kumar Basic Pathology, Ch. 9, pp. 354-360
- Guyton & Hall Textbook of Medical Physiology, Ch. 21, pp. 271-275
- Ganong's Review of Medical Physiology, Ch. 29, pp. 534-537
- Washington Manual of Medical Therapeutics, Ch. 4, pp. 150-155
- Robbins, Cotran & Kumar Pathologic Basis of Disease, Ch. 9