
10 common ecg findings
1. ST-Segment Elevation
- Anterior (V1-V6 + I, aVL) - LAD territory
- Inferior (II, III, aVF) - RCA territory
- Lateral (I, aVL, V5-V6) - LCx territory
- Posterior - reciprocal ST depression in V1-V3
- Harrison's Principles of Internal Medicine 22E, p. 1915
2. Atrial Fibrillation (AF)
- Absence of distinct P waves; flat or chaotic isoelectric baseline (fibrillatory f-waves)
- Irregularly irregular narrow QRS complexes (unless bundle branch block or pre-excitation is present)
- Ventricular rate typically 100-180 bpm if uncontrolled
- Tintinalli's Emergency Medicine, p. 149
3. Left Ventricular Hypertrophy (LVH)
- SV1 + RV5 or RV6 ≥ 35 mm (Sokolow-Lyon)
- R in aVL ≥ 11 mm (Cornell)
- Often accompanied by ST depression + T-wave inversion in lateral leads (the "strain" pattern)
- Left atrial abnormality (broad, notched P in II; deep negative terminal P in V1) increases specificity
- Harrison's Principles of Internal Medicine 22E, p. 1914
4. Bundle Branch Blocks
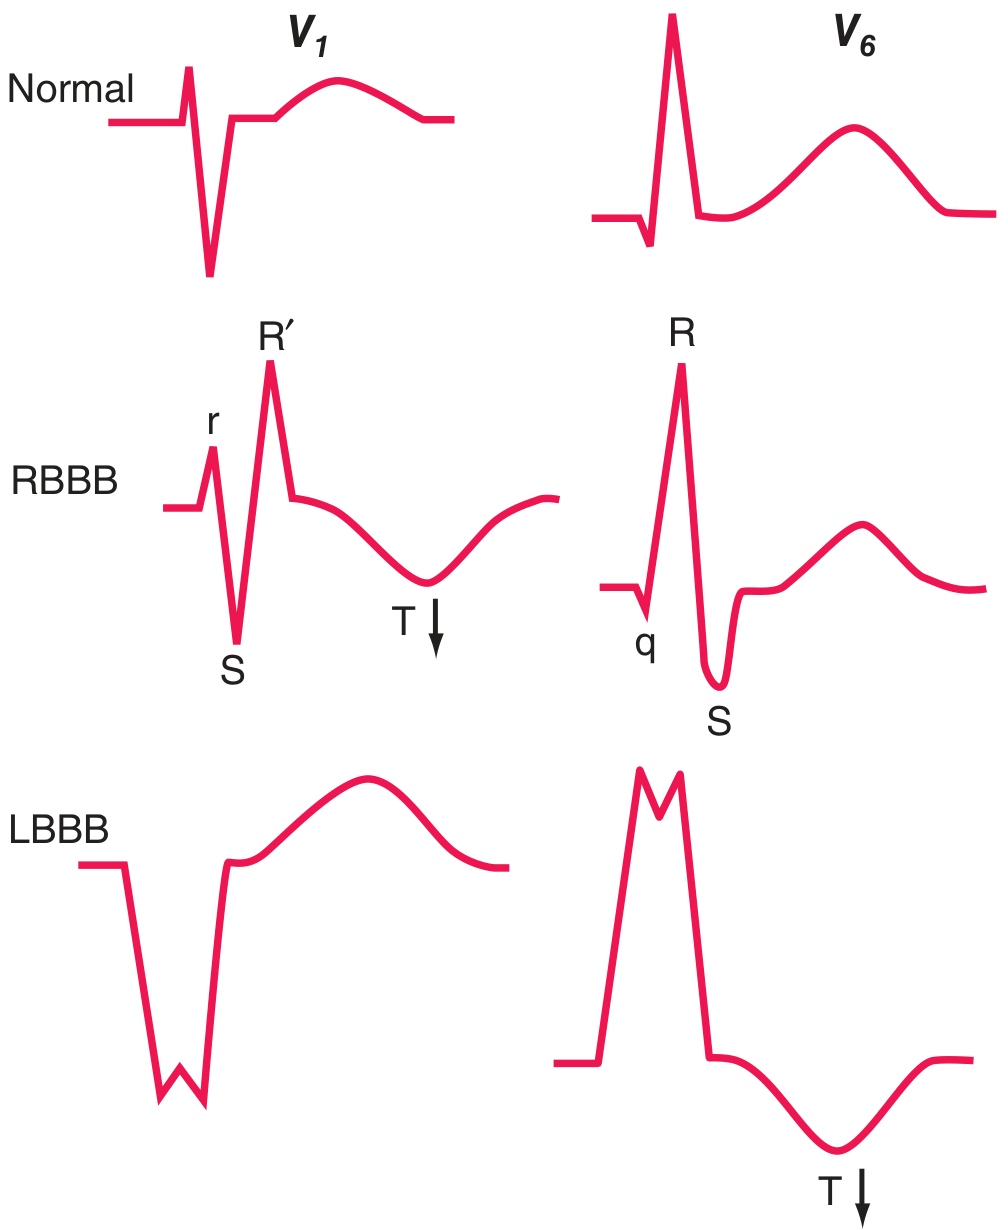
- rSR' ("M-shaped" or "rabbit ears") in V1
- Wide, slurred S wave in V6 and lead I
- Secondary T-wave inversion in V1-V3
- RBBB alone is often benign; also seen with pulmonary embolism, ASD, RV strain
-
Wide, predominantly negative (QS) in V1
-
Broad, tall, entirely positive (R) in V6
-
Septal activation reversal - no septal Q wave in V6
-
LBBB is almost always pathological - associated with coronary artery disease, hypertension, dilated cardiomyopathy, valvular disease; a new LBBB in ACS is treated like STEMI (Sgarbossa criteria apply)
-
Harrison's Principles of Internal Medicine 22E, p. 1914-1915
5. Atrioventricular (AV) Block
- PR interval >200 ms (>5 small squares); every P conducts
- Often benign; can be from increased vagal tone, inferior MI, digoxin
- Progressive PR lengthening until a P wave fails to conduct (dropped QRS)
- Usually at the AV node level; often benign
- Fixed PR interval with sudden, unpredictable dropped QRS beats
- At or below the bundle of His; high risk of progressing to complete heart block
-
No relationship between P waves and QRS complexes (AV dissociation)
-
Escape rhythm: junctional (narrow, ~40-60 bpm) or ventricular (wide, <40 bpm)
-
Requires urgent pacing
-
Harrison's Principles of Internal Medicine 22E; Robbins & Kumar Basic Pathology
6. Prolonged QT Interval
-
Congenital: LQTS1 (KCNQ1), LQTS2 (KCNH2), LQTS3 (SCN5A)
-
Drugs: antiarrhythmics (sotalol, amiodarone), antipsychotics, macrolides, fluoroquinolones
-
Electrolytes: hypokalemia, hypomagnesemia, hypocalcemia
-
Hypothyroidism, hypothermia, myocarditis
-
Fuster and Hurst's The Heart 15E; Harrison's 22E
7. Hyperkalemia
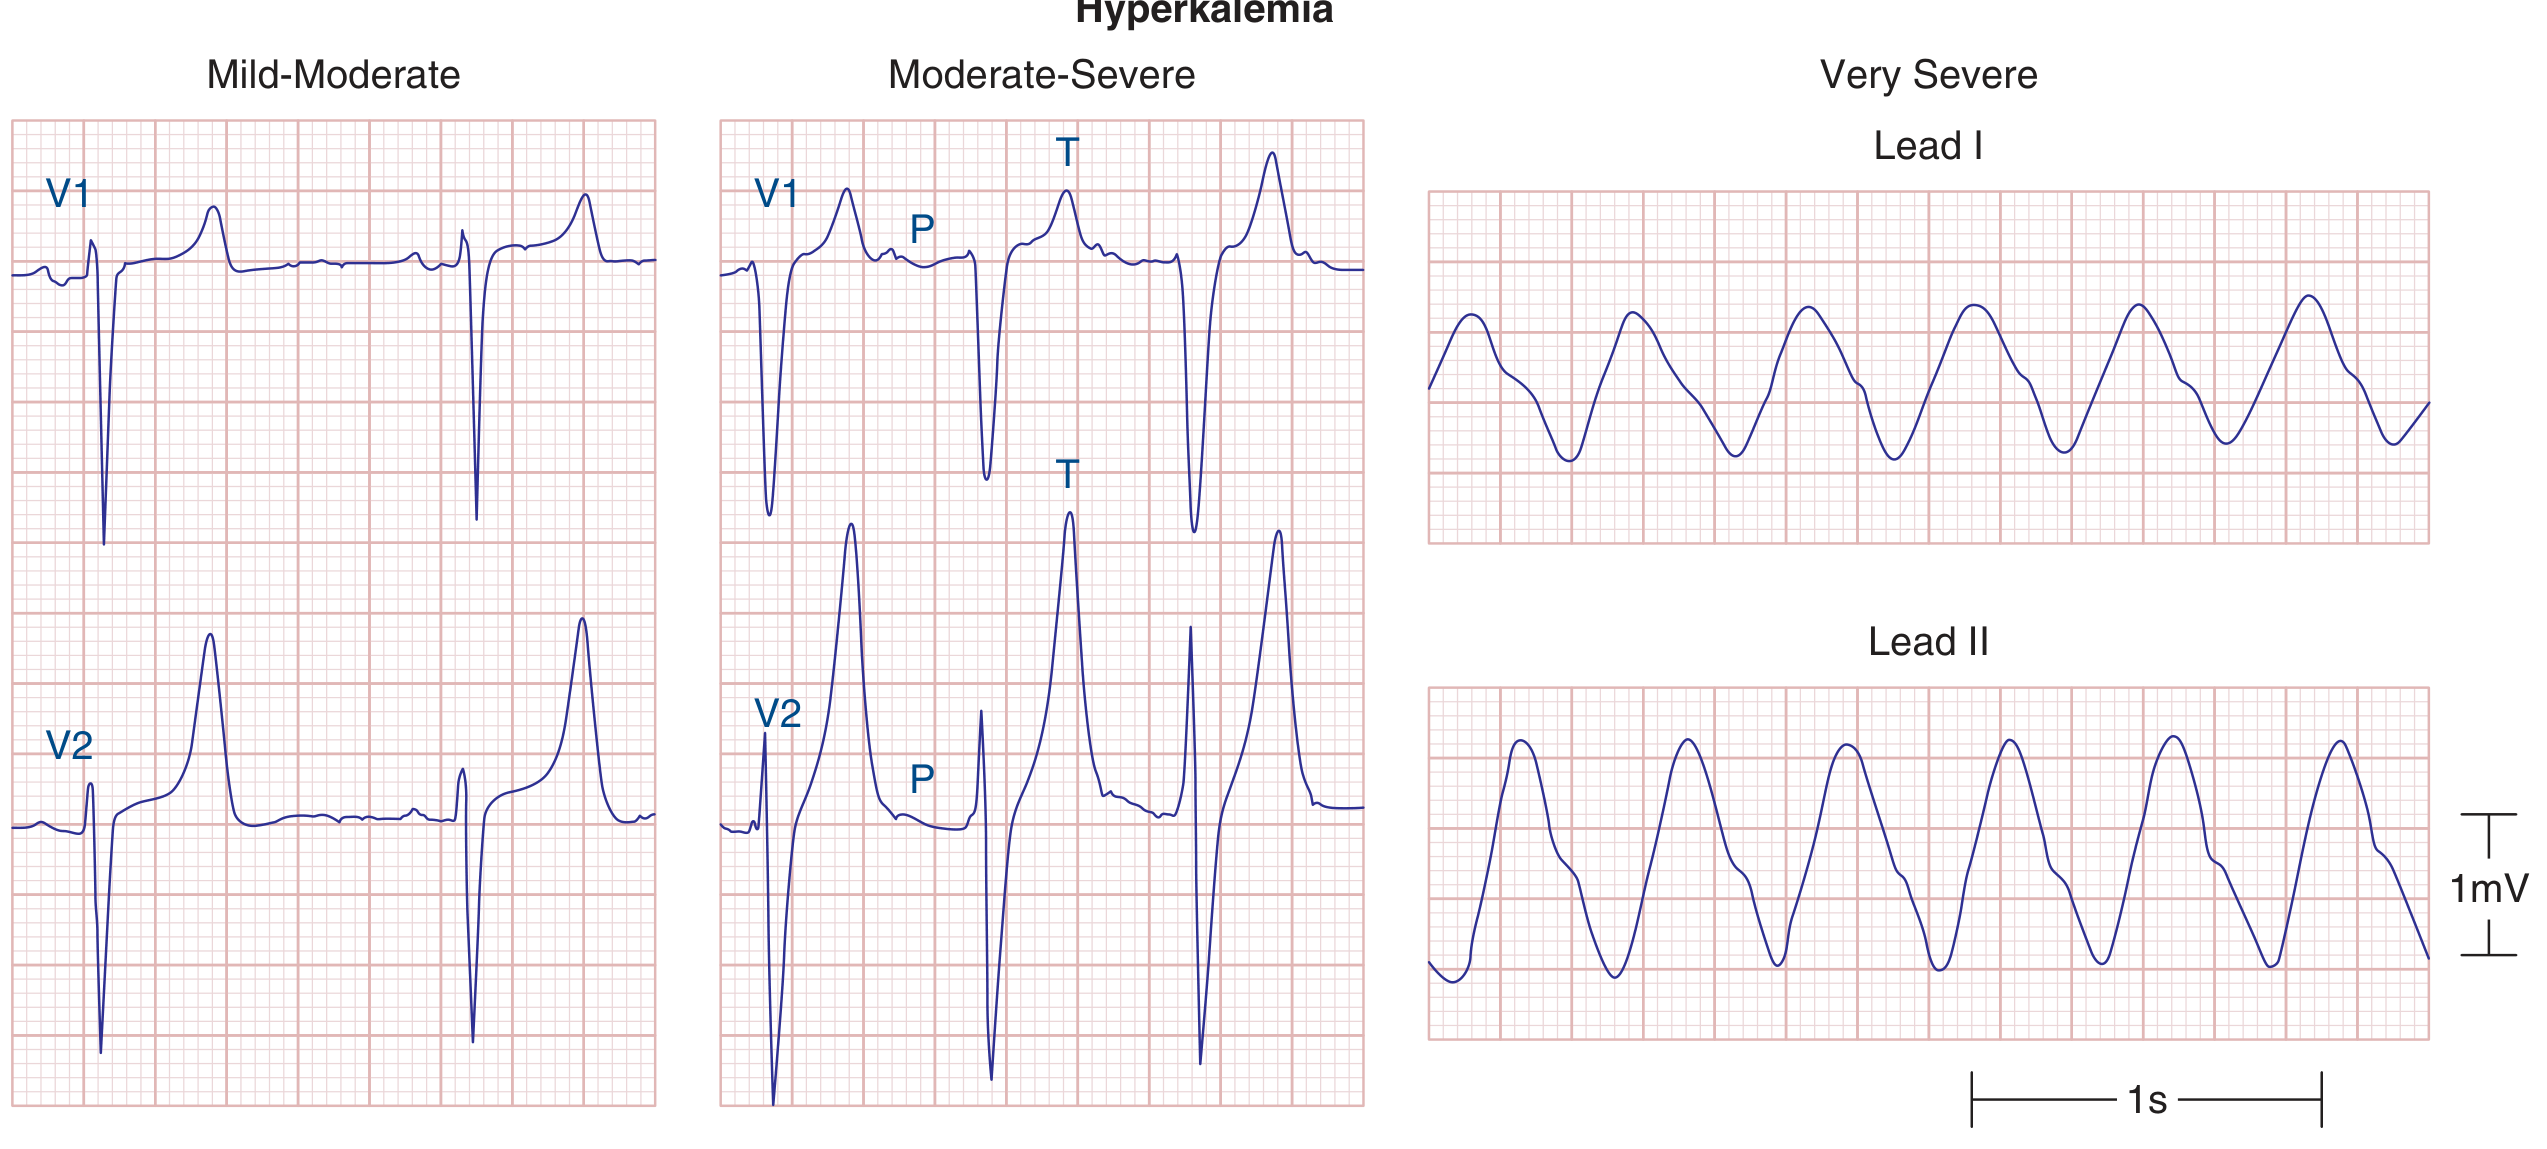
| K+ level | ECG change |
|---|---|
| 5.5-6.5 mEq/L | Tall, peaked ("tented") T waves - earliest sign |
| 6.5-7.5 mEq/L | Widening QRS, PR prolongation, P-wave flattening |
| >7.5 mEq/L | P waves disappear, sine-wave pattern |
| >8-9 mEq/L | Ventricular fibrillation or asystole |
- Harrison's Principles of Internal Medicine 22E, p. 1918
8. Pericarditis / Pericardial Effusion
- Diffuse, concave-up ST elevation with PR segment depression (most leads except aVR/V1)
- ST and PR normalization
- Diffuse T-wave inversions
- T-wave normalization
- Sinus tachycardia
- PR depression
- Low voltage QRS (amplitude ≤5 mm in all limb leads or ≤10 mm in precordial leads)
- Electrical alternans - beat-to-beat alternation in QRS amplitude/axis; total (P+QRS+T) alternans with sinus tachycardia is relatively specific for cardiac tamponade
- Roberts and Hedges' Clinical Procedures in Emergency Medicine, p. 393
9. Sinus Bradycardia and Sinus Tachycardia
- Causes: high vagal tone (athletes, vasovagal), hypothyroidism, hypothermia, sick sinus syndrome, inferior MI, beta-blockers/calcium channel blockers, raised ICP
- Causes: pain, fever, hypovolemia, anemia, heart failure, PE, hyperthyroidism, sepsis, sympathomimetics
- A reflex sinus tachycardia with a clearly identifiable cause should prompt treatment of the underlying condition, not the rate itself.
10. Pathological Q Waves
- Anterior Q waves (V1-V4): LAD infarction
- Inferior Q waves (II, III, aVF): RCA infarction
- Lateral Q waves (I, aVL, V5-V6): circumflex infarction
- Harrison's Principles of Internal Medicine 22E, p. 1916
Quick Reference Summary
| Finding | Key ECG Feature | Primary Concern |
|---|---|---|
| ST elevation | ≥1 mm elevation in ≥2 contiguous leads | STEMI / pericarditis |
| Atrial fibrillation | Irregularly irregular, no P waves | Stroke risk, rate control |
| LVH | Tall R waves (SV1+RV5 ≥35 mm) | Hypertension, HCM |
| RBBB/LBBB | Wide QRS, specific morphology | LBBB: often pathological |
| AV block | PR prolongation / dropped beats | 3rd degree: urgent pacing |
| Long QT | QTc ≥440-460 ms | Torsades de Pointes |
| Hyperkalemia | Peaked T waves → sine wave | Life-threatening arrhythmia |
| Pericarditis | Diffuse saddle ST + PR depression | Tamponade if effusion |
| Sinus bradycardia/tachy | Rate <60 or >100, normal P axis | Treat underlying cause |
| Pathological Q | Wide/deep Q in ≥2 contiguous leads | Old/evolving infarction |
Give me images with marked changes compared to normal
1. ST Elevation - Mechanism
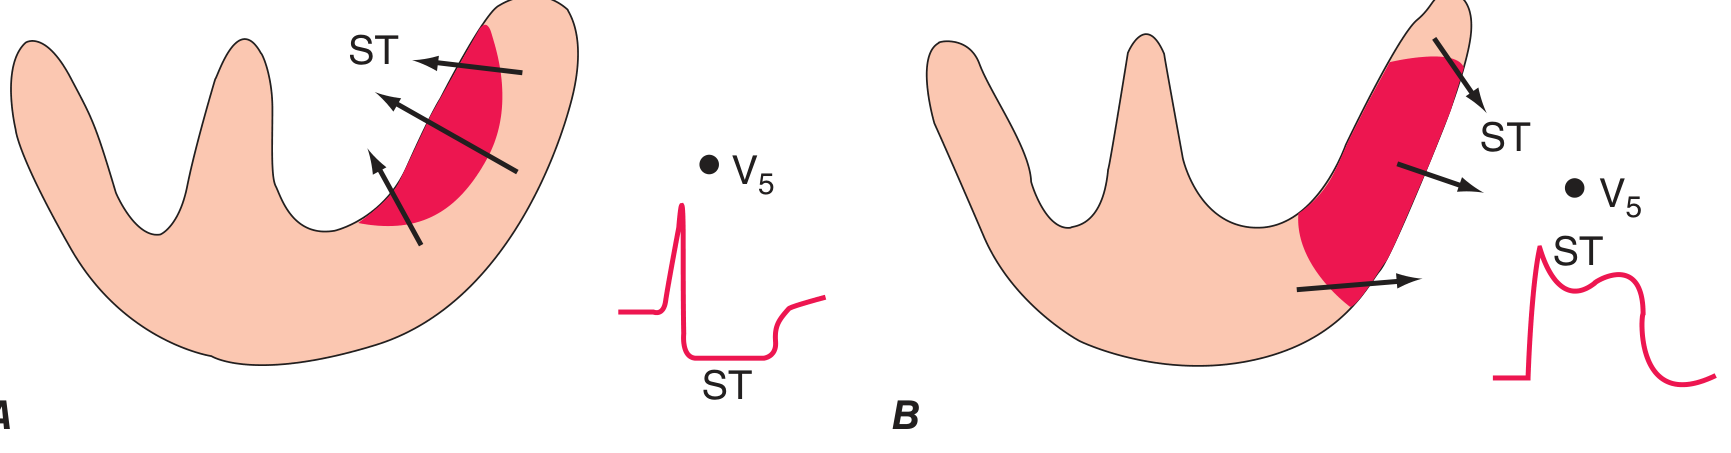
- Harrison's 22E, Fig. 247-11
2. Anterior STEMI - Evolving ECG Sequence
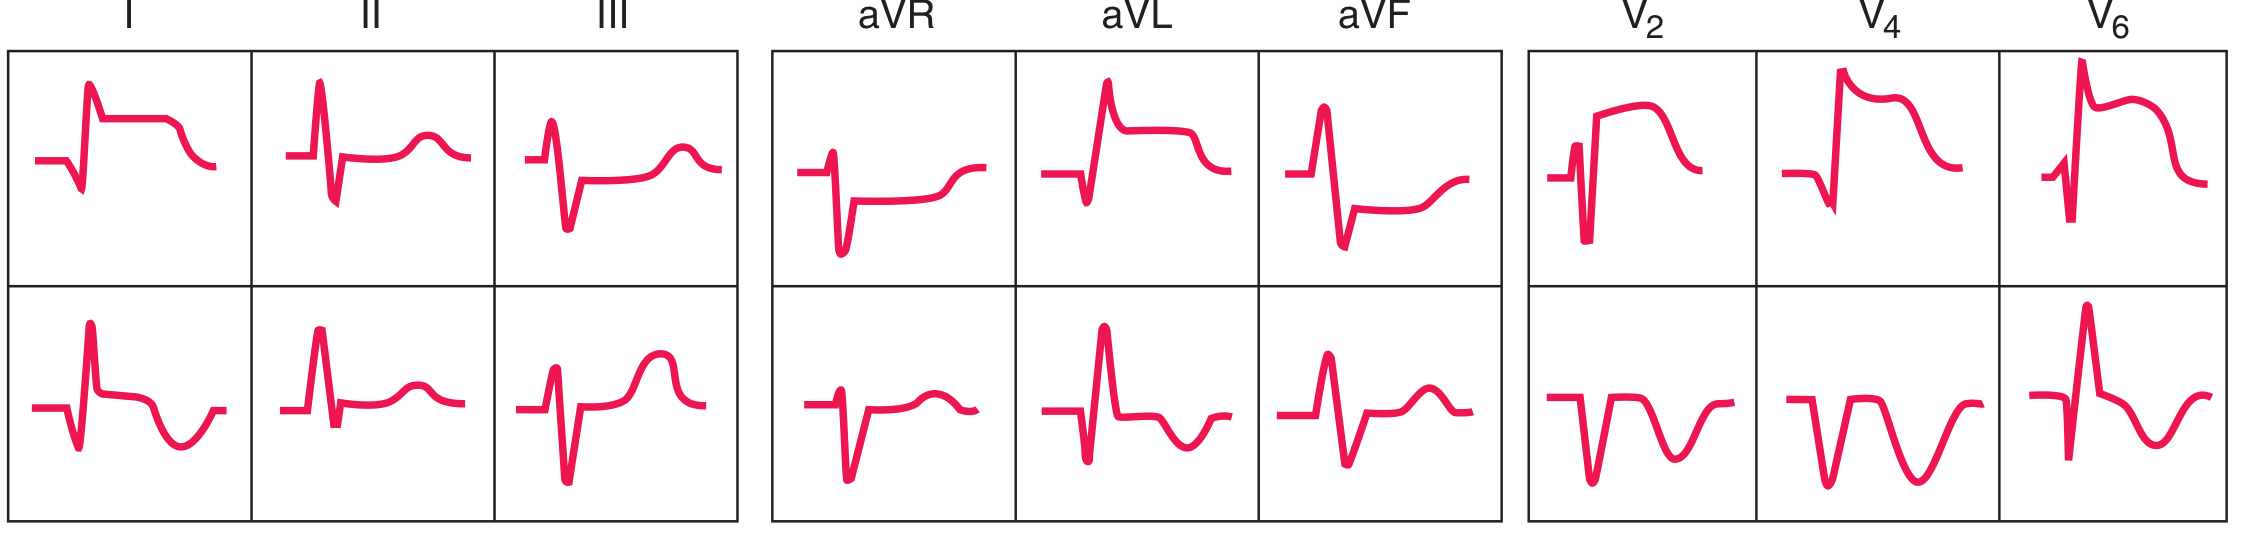
- Harrison's 22E, Fig. 247-13A
3. Inferior STEMI - Evolving ECG Sequence
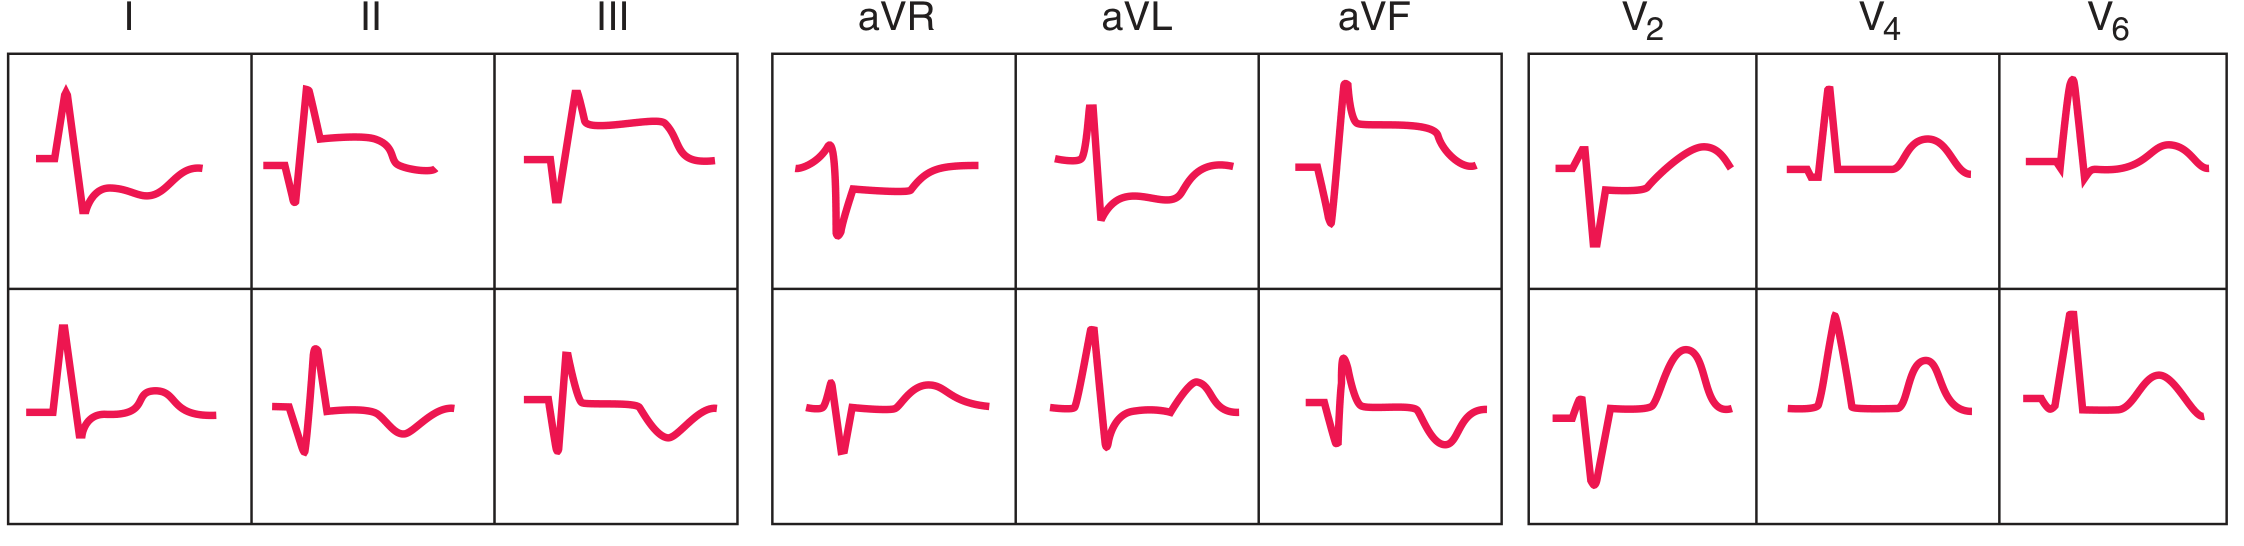
- Harrison's 22E, Fig. 247-13B
4. Anterior STEMI - Real 12-Lead Tracing
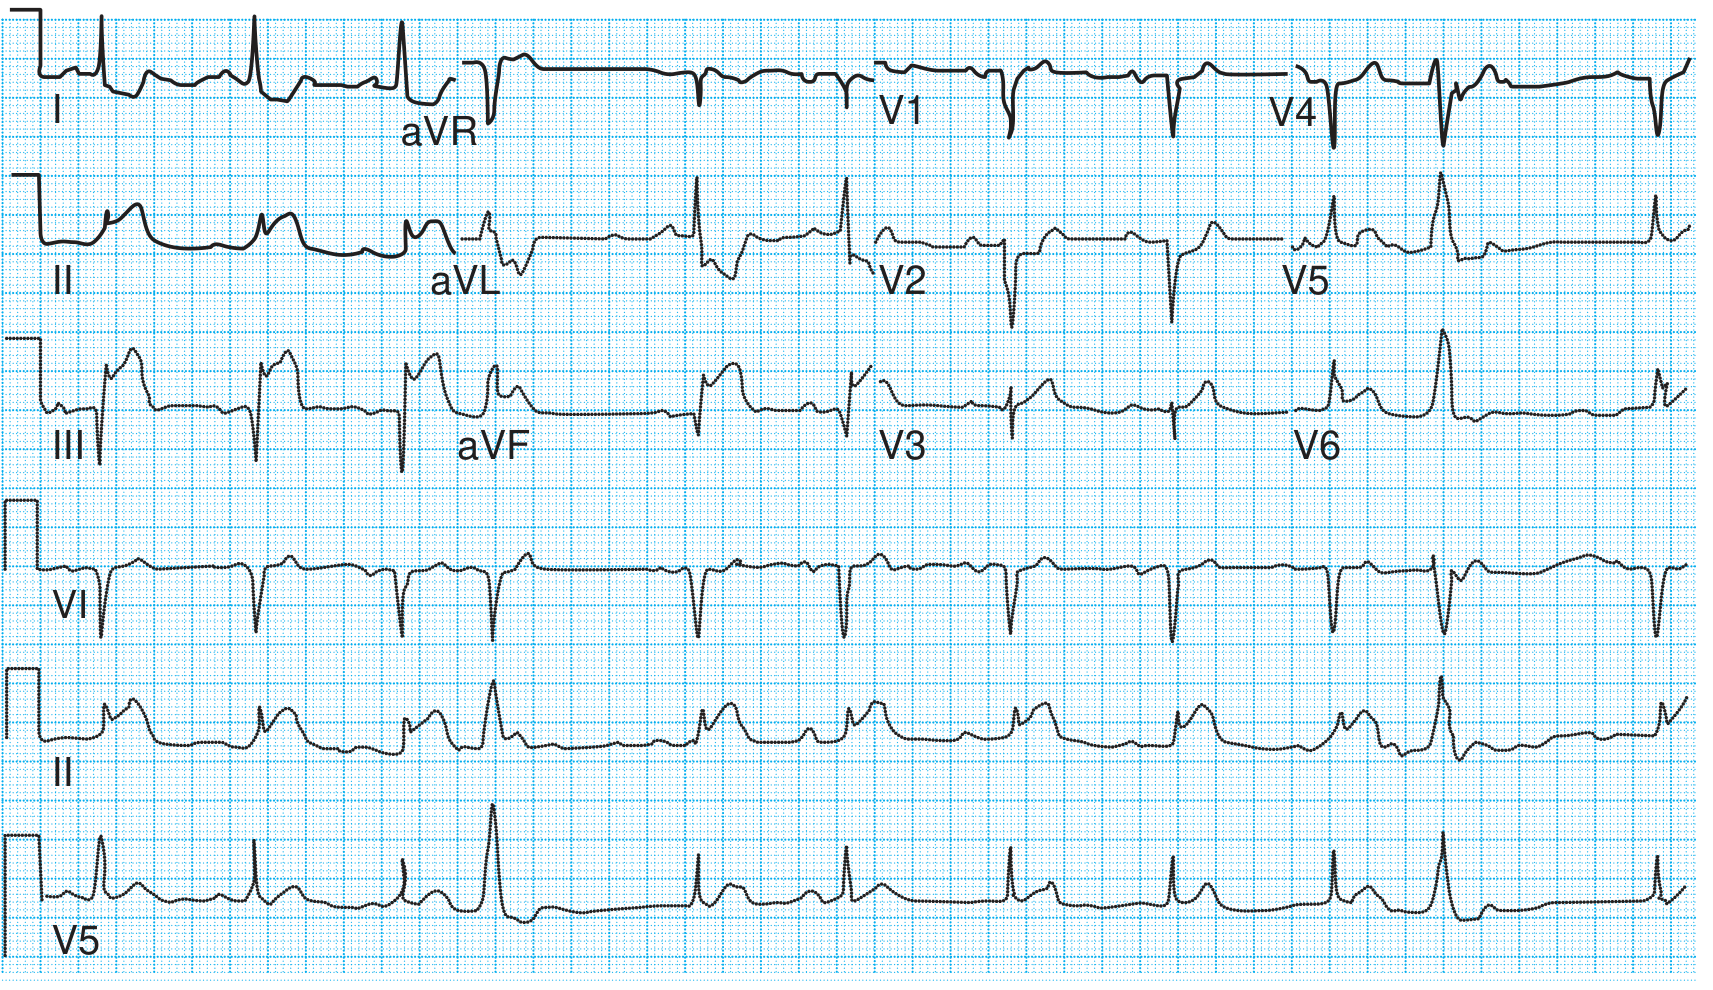
- Textbook of Family Medicine 9E, Fig. 27-12 - "Acute inferior MI with ST elevation in inferior leads"
5. Wellens T-Wave Pattern (Anterior Ischemia / LAD Stenosis)
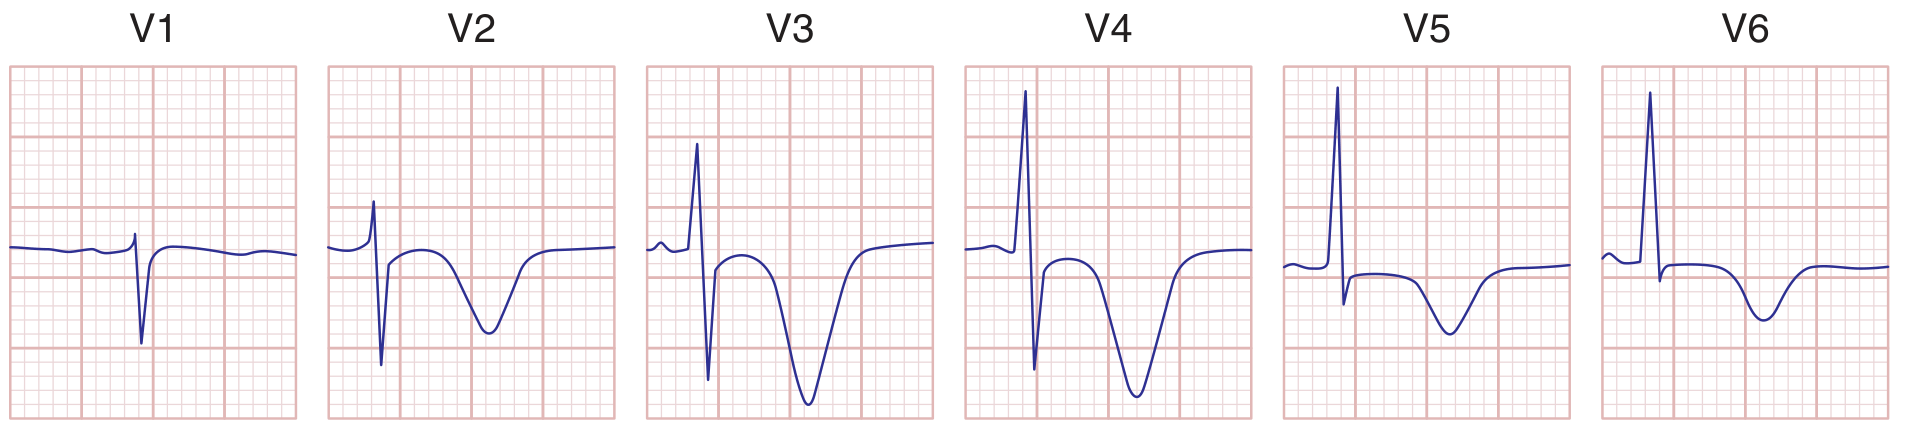
- Harrison's 22E, Fig. 247-12
6. Bundle Branch Blocks (RBBB vs LBBB)
| V1 | V6 | |
|---|---|---|
| Normal | Small r, deep S | Narrow qR, upright T |
| RBBB | rSR' ("rabbit ears"), inverted T | qRS with wide slurred S |
| LBBB | Wide, entirely negative (QS) | Broad, monophasic tall R, inverted T |
- Harrison's 22E, Fig. 247-10
7. Atrial Fibrillation

- No P waves - chaotic fibrillatory baseline
- Irregularly irregular QRS complexes (note the varying R-R intervals)
- Narrow QRS unless BBB is present
- Pye's Surgical-Handicraft, Fig. 17.35
8. Complete Heart Block (3rd Degree AV Block)
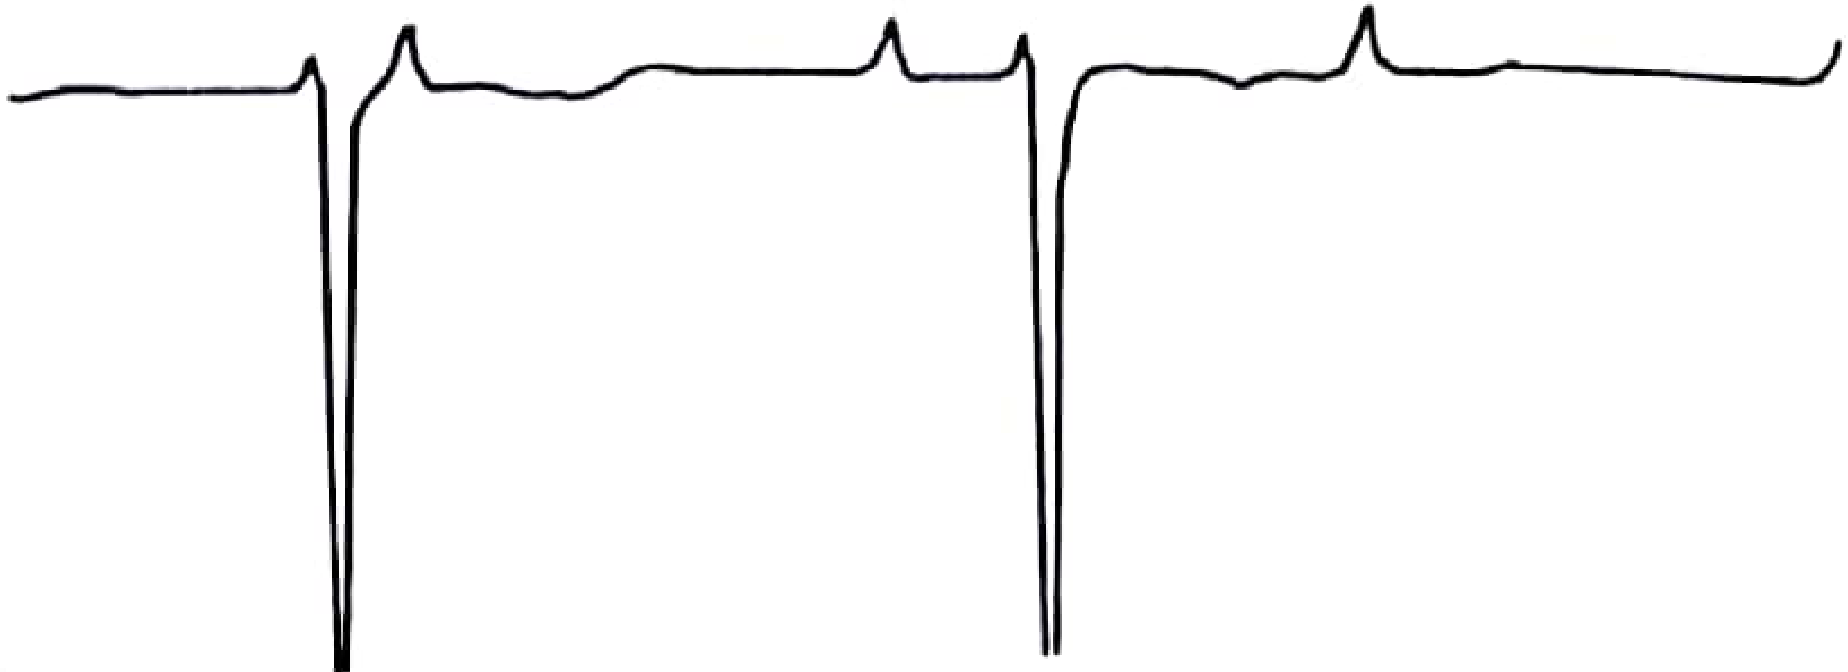
- Small P waves (atrial rate ~70-80 bpm) firing independently
- Wide, slow QRS complexes (ventricular escape rhythm, ~30-40 bpm)
- No relationship between P waves and QRS complexes (AV dissociation)
- The long flat stretches after each QRS represent the slow ventricular rate with no conducted beats
- Pye's Surgical-Handicraft, Fig. 17.34
9. Hyperkalemia - Progressive Changes
- Harrison's 22E, Fig. 247-14
10. Hypokalemia - Prominent U Wave
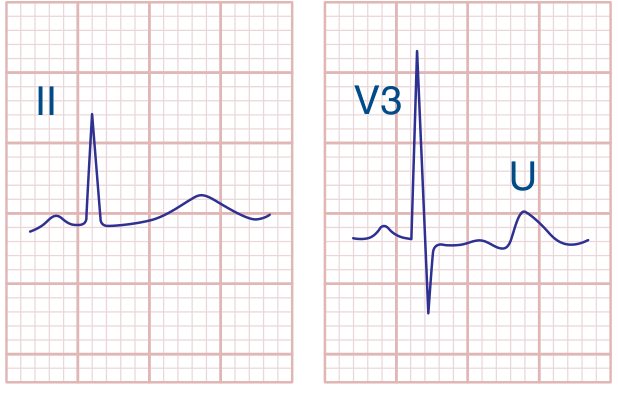
- Flat or inverted T waves
- Prominent U wave (the rounded deflection after the T wave, labeled "U" in V3) - represents delayed Purkinje fiber repolarization
- Apparent QT prolongation (actually QU prolongation)
- Risk of Torsades de Pointes
- Harrison's 22E - Hypokalemia panel
Summary of What to Look for
| Finding | Abnormal Feature | Normal comparator |
|---|---|---|
| STEMI | ST elevation ≥1 mm, hyperacute T | Flat ST, smooth upright T |
| Wellens sign | Deep symmetric T inversions V1-V6 | Upright T precordially |
| Inferior STEMI | ST ↑ in II, III, aVF + reciprocal ↓ in I, aVL | Isoelectric ST everywhere |
| RBBB | rSR' in V1 / wide S in V6 | Small r, deep S in V1 |
| LBBB | QS in V1 / monophasic R in V6 | rS in V1, qR in V6 |
| AF | No P waves, irregular QRS | Regular rhythm, clear P waves |
| Complete heart block | P-QRS dissociation, slow escape | 1:1 PR relationship |
| Hyperkalemia | Peaked T → sine wave | Normal T amplitude |
| Hypokalemia | Flat T + prominent U wave | No U wave visible |
Create a quick-reference ECG findings guide (PDF or document)
mkdir -p /home/daytona/workspace/ecg-guide && ls /home/daytona/workspace/ecg-guide
~/ecg-guide/ecg_guide.html
<!DOCTYPE html>
<html lang="en">
<head>
<meta charset="UTF-8"/>
<title>Quick-Reference ECG Findings Guide</title>
<style>
@import url('https://fonts.googleapis.com/css2?family=Inter:wght@400;600;700&display=swap');
* { box-sizing: border-box; margin: 0; padding: 0; }
body {
font-family: 'Inter', Arial, sans-serif;
font-size: 9.5pt;
color: #1a1a2e;
background: #fff;
}
/* ── COVER PAGE ── */
.cover {
height: 100vh;
background: linear-gradient(145deg, #0f3460 0%, #16213e 60%, #1a1a2e 100%);
display: flex;
flex-direction: column;
align-items: center;
justify-content: center;
color: #fff;
text-align: center;
padding: 60px 40px;
page-break-after: always;
}
.cover .badge {
background: #e94560;
color: #fff;
font-size: 8pt;
font-weight: 700;
letter-spacing: 2px;
text-transform: uppercase;
padding: 5px 18px;
border-radius: 20px;
margin-bottom: 24px;
}
.cover h1 {
font-size: 32pt;
font-weight: 700;
line-height: 1.15;
margin-bottom: 16px;
color: #fff;
}
.cover h1 span { color: #e94560; }
.cover .subtitle {
font-size: 13pt;
color: #a8b2d8;
margin-bottom: 40px;
max-width: 500px;
}
.cover .divider {
width: 60px; height: 4px;
background: #e94560;
border-radius: 2px;
margin: 0 auto 36px;
}
.cover .meta {
font-size: 8.5pt;
color: #8892b0;
line-height: 1.8;
}
.cover .findings-list {
display: flex;
flex-wrap: wrap;
justify-content: center;
gap: 8px;
margin-top: 36px;
max-width: 520px;
}
.cover .pill {
background: rgba(233,69,96,0.15);
border: 1px solid rgba(233,69,96,0.4);
color: #e9c0c9;
font-size: 7.5pt;
padding: 4px 12px;
border-radius: 14px;
}
/* ── PAGE LAYOUT ── */
@page {
size: A4;
margin: 14mm 12mm 14mm 12mm;
@bottom-center {
content: "ECG Quick-Reference Guide • Page " counter(page);
font-size: 7.5pt;
color: #8892b0;
}
}
/* ── SECTION HEADERS ── */
.section-header {
page-break-before: always;
background: linear-gradient(90deg, #0f3460 0%, #16213e 100%);
color: #fff;
padding: 10px 16px;
border-radius: 6px;
display: flex;
align-items: center;
gap: 12px;
margin-bottom: 12px;
}
.section-header .num {
background: #e94560;
color: #fff;
font-size: 11pt;
font-weight: 700;
width: 32px; height: 32px;
border-radius: 50%;
display: flex; align-items: center; justify-content: center;
flex-shrink: 0;
}
.section-header h2 {
font-size: 14pt;
font-weight: 700;
color: #fff;
}
.section-header .tag {
margin-left: auto;
background: rgba(233,69,96,0.3);
border: 1px solid #e94560;
color: #e9c0c9;
font-size: 7pt;
padding: 3px 10px;
border-radius: 10px;
white-space: nowrap;
}
/* ── CONTENT GRID ── */
.two-col {
display: grid;
grid-template-columns: 1fr 1fr;
gap: 14px;
margin-bottom: 14px;
}
.three-col {
display: grid;
grid-template-columns: 1fr 1fr 1fr;
gap: 12px;
margin-bottom: 14px;
}
.full-col { margin-bottom: 14px; }
/* ── CARDS ── */
.card {
background: #f8f9ff;
border: 1px solid #dde3f0;
border-radius: 8px;
padding: 12px 14px;
}
.card.red { border-left: 4px solid #e94560; }
.card.blue { border-left: 4px solid #0f3460; }
.card.green { border-left: 4px solid #00b894; }
.card.amber { border-left: 4px solid #f39c12; }
.card.purple{ border-left: 4px solid #8e44ad; }
.card h3 {
font-size: 9.5pt;
font-weight: 700;
color: #0f3460;
margin-bottom: 7px;
text-transform: uppercase;
letter-spacing: 0.5px;
}
.card p, .card li {
font-size: 8.5pt;
line-height: 1.55;
color: #333;
}
.card ul { padding-left: 14px; }
/* ── KEY FINDING HIGHLIGHT ── */
.key-finding {
background: #fff0f3;
border: 1px solid #f9b4c0;
border-radius: 6px;
padding: 8px 12px;
margin: 8px 0;
font-size: 8.5pt;
color: #c0392b;
font-weight: 600;
}
.key-finding span { font-weight: 400; color: #555; }
/* ── TABLES ── */
table {
width: 100%;
border-collapse: collapse;
font-size: 8pt;
margin: 8px 0;
}
thead tr {
background: #0f3460;
color: #fff;
}
thead th {
padding: 6px 8px;
text-align: left;
font-weight: 600;
}
tbody tr:nth-child(even) { background: #f0f4ff; }
tbody tr:nth-child(odd) { background: #fff; }
tbody td {
padding: 5px 8px;
border-bottom: 1px solid #dde3f0;
vertical-align: top;
}
.badge-r { background:#e94560; color:#fff; padding:1px 6px; border-radius:3px; font-size:7pt; font-weight:700; }
.badge-o { background:#f39c12; color:#fff; padding:1px 6px; border-radius:3px; font-size:7pt; font-weight:700; }
.badge-g { background:#00b894; color:#fff; padding:1px 6px; border-radius:3px; font-size:7pt; font-weight:700; }
/* ── IMAGES ── */
.img-block {
background: #f0f4ff;
border: 1px solid #c8d3f0;
border-radius: 8px;
padding: 10px;
margin: 10px 0;
text-align: center;
}
.img-block img {
max-width: 100%;
max-height: 200px;
border-radius: 4px;
}
.img-block .caption {
font-size: 7.5pt;
color: #555;
margin-top: 6px;
font-style: italic;
}
.img-block .source {
font-size: 7pt;
color: #8892b0;
margin-top: 2px;
}
/* ── MECHANISM BOX ── */
.mech-box {
background: #eef2ff;
border: 1px solid #c5cff5;
border-radius: 6px;
padding: 8px 12px;
margin: 8px 0;
font-size: 8.5pt;
line-height: 1.5;
}
.mech-box strong { color: #0f3460; }
/* ── QUICK-REF SUMMARY (last page) ── */
.summary-page {
page-break-before: always;
}
.summary-header {
background: linear-gradient(90deg, #e94560 0%, #c0392b 100%);
color: #fff;
text-align: center;
padding: 14px;
border-radius: 8px 8px 0 0;
font-size: 14pt;
font-weight: 700;
letter-spacing: 1px;
margin-bottom: 0;
}
.summary-table table { margin: 0; }
.summary-table thead tr { background: #16213e; }
.summary-table tbody tr:nth-child(even) { background: #f8f0ff; }
/* ── UTILITY ── */
.mt8 { margin-top: 8px; }
.mt12 { margin-top: 12px; }
.bold { font-weight: 700; }
.red-text { color: #e94560; font-weight: 700; }
.blue-text { color: #0f3460; font-weight: 700; }
.small { font-size: 7.5pt; color: #666; }
hr.section-rule {
border: none;
border-top: 2px solid #e94560;
margin: 10px 0;
opacity: 0.3;
}
</style>
</head>
<body>
<!-- ══════════════ COVER PAGE ══════════════ -->
<div class="cover">
<div class="badge">Clinical Reference</div>
<h1>Quick-Reference<br/><span>ECG Findings</span><br/>Guide</h1>
<div class="divider"></div>
<p class="subtitle">10 Common Electrocardiographic Patterns — Mechanisms, Diagnostic Criteria & Clinical Significance</p>
<div class="findings-list">
<span class="pill">ST Elevation (STEMI)</span>
<span class="pill">Atrial Fibrillation</span>
<span class="pill">LVH</span>
<span class="pill">RBBB / LBBB</span>
<span class="pill">AV Block</span>
<span class="pill">Prolonged QT</span>
<span class="pill">Hyperkalemia</span>
<span class="pill">Pericarditis</span>
<span class="pill">Sinus Arrhythmias</span>
<span class="pill">Pathological Q Waves</span>
</div>
<p class="meta" style="margin-top:40px;">
Sources: Harrison's Principles of Internal Medicine 22E •
Tintinalli's Emergency Medicine • <br/>
Braunwald's Heart Disease • Roberts & Hedges' Clinical Procedures<br/><br/>
<em>For educational use. Always correlate with clinical context.</em>
</p>
</div>
<!-- ══════════════════════════════════════════════
FINDING 1 — ST ELEVATION / STEMI
══════════════════════════════════════════════ -->
<div class="section-header">
<div class="num">1</div>
<h2>ST-Segment Elevation (STEMI)</h2>
<span class="tag">⚠ EMERGENCY</span>
</div>
<div class="two-col">
<div>
<div class="card red">
<h3>Diagnostic Criteria</h3>
<ul>
<li>ST elevation <strong>≥1 mm</strong> in ≥2 contiguous leads</li>
<li>New LBBB with ischaemic symptoms = STEMI equivalent</li>
<li>Hyperacute (tall, broad) T waves — earliest sign</li>
<li>Reciprocal ST <em>depression</em> in opposite leads</li>
</ul>
</div>
<div class="key-finding mt8">🔴 Anterior STEMI: <span>ST ↑ in V1–V6, I, aVL → LAD occlusion</span></div>
<div class="key-finding">🔴 Inferior STEMI: <span>ST ↑ in II, III, aVF → RCA occlusion</span></div>
<div class="key-finding">🔴 Posterior STEMI: <span>Reciprocal ST ↓ in V1–V3 (mirror image)</span></div>
<div class="card blue mt8">
<h3>Mechanism</h3>
<p>Transmural ischaemia shifts the injury current vector toward the <strong>epicardium</strong>. Overlying leads record ST elevation; opposite leads show reciprocal depression. Subendocardial ischaemia does the reverse (ST depression only).</p>
</div>
</div>
<div>
<div class="img-block">
<img src="https://cdn.orris.care/cdss_images/90b2a4e8d8bfd20d740aafeb6a9a46d5110b4355298ab357e1f13d6592fccdef.png"
alt="ST deviation mechanism diagram"/>
<div class="caption">A: Subendocardial ischaemia → ST depression (V5). B: Transmural ischaemia → ST elevation (V5).</div>
<div class="source">Harrison's Principles of Internal Medicine 22E, Fig. 247-11</div>
</div>
<div class="card amber">
<h3>Time to Treatment</h3>
<ul>
<li><strong>Door-to-balloon:</strong> <90 min (primary PCI)</li>
<li><strong>Door-to-needle:</strong> <30 min (thrombolysis if PCI unavailable)</li>
<li>Repeat ECG every 5–10 min if initial is non-diagnostic</li>
</ul>
</div>
</div>
</div>
<div class="two-col">
<div class="img-block">
<img src="https://cdn.orris.care/cdss_images/b2b5c8464b561684b3b8a2cc95393c3af1b8f9ed6381dc7b32369ffca928d62d.png"
alt="Anterior STEMI evolving ECG"/>
<div class="caption"><strong>Anterior STEMI sequence.</strong> Top: Acute — ST elevation I, aVL, V2–V6; hyperacute T waves; reciprocal ST ↓ in II, III, aVF. Bottom: Evolving — deep Q waves V2–V4, T-wave inversions.</div>
<div class="source">Harrison's 22E, Fig. 247-13A</div>
</div>
<div class="img-block">
<img src="https://cdn.orris.care/cdss_images/7efb10c6a3da958c12e7f371fd6a91e0c371475fe60d5407cab75d3f036c4b5e.png"
alt="Inferior STEMI evolving ECG"/>
<div class="caption"><strong>Inferior STEMI sequence.</strong> Top: Acute — ST elevation in II, III, aVF; reciprocal ST ↓ in I, aVL, V1–V4. Bottom: Evolving — Q waves II, III, aVF; T-wave inversions.</div>
<div class="source">Harrison's 22E, Fig. 247-13B</div>
</div>
</div>
<div class="img-block">
<img src="https://cdn.orris.care/cdss_images/adead81bbf6a6b405ebe5fcb2d8a38aaf43371d3988355961a3824c62a1d50b9.png"
alt="Real 12-lead inferior STEMI ECG"/>
<div class="caption"><strong>Real 12-lead ECG — Acute Inferior STEMI.</strong> Marked ST elevation in II, III, aVF with deep reciprocal ST depression in I, aVL, V1–V2. Right ventricular leads would show ST elevation in V3R–V4R confirming RV involvement.</div>
<div class="source">Textbook of Family Medicine 9E, Fig. 27-12</div>
</div>
<!-- ══════════════════════════════════════════════
FINDING 2 — Wellens Sign (bonus, grouped with STEMI)
══════════════════════════════════════════════ -->
<div class="card purple mt12" style="page-break-inside:avoid;">
<h3>⚠ Wellens T-Wave Sign — Critical LAD Stenosis</h3>
<div class="two-col" style="margin-bottom:0;">
<div>
<p>Deep, symmetric T-wave inversions in V1–V4 (sometimes V6) <em>without</em> ST elevation and <em>without</em> Q waves. Seen in pain-free window after LAD ischaemia.</p>
<ul class="mt8">
<li><strong>Type A:</strong> Biphasic T waves (V2–V3) — earlier pattern</li>
<li><strong>Type B:</strong> Deep symmetric T inversions — more common</li>
<li>Indicates <strong>≥70% LAD stenosis</strong> — impending anterior STEMI</li>
<li><strong>Do NOT stress-test</strong> these patients</li>
</ul>
</div>
<div class="img-block" style="margin:0;">
<img src="https://cdn.orris.care/cdss_images/f3e984a53a0a64a9ac96e6035acfa4f3e60f0b0b4f43f8a50327252b01f9f891.png"
alt="Wellens T-wave sign V1-V6"/>
<div class="caption">Deep symmetric T inversions V1–V6. No Q waves. No ST elevation.</div>
<div class="source">Harrison's 22E, Fig. 247-12</div>
</div>
</div>
</div>
<!-- ══════════════════════════════════════════════
FINDING 3 — ATRIAL FIBRILLATION
══════════════════════════════════════════════ -->
<div class="section-header">
<div class="num">2</div>
<h2>Atrial Fibrillation (AF)</h2>
<span class="tag">Common Arrhythmia</span>
</div>
<div class="two-col">
<div>
<div class="card red">
<h3>ECG Criteria (all 3 required)</h3>
<ul>
<li><strong>No distinct P waves</strong> — flat or chaotic fibrillatory baseline (f-waves 350–600/min)</li>
<li><strong>Irregularly irregular</strong> QRS rhythm (varying R-R intervals)</li>
<li><strong>Narrow QRS</strong> — unless pre-existing BBB or pre-excitation (WPW)</li>
</ul>
</div>
<div class="mech-box mt8">
<strong>Mechanism:</strong> Multiple chaotic re-entrant wavelets in both atria fire at 350–600/min. The AV node cannot conduct all impulses — it filters them, producing a randomly irregular ventricular response.
</div>
<div class="card amber mt8">
<h3>Clinical Consequences</h3>
<ul>
<li>Loss of atrial "kick" → ↓CO by ~20% (more in stiff LV)</li>
<li>Rapid ventricular rate → angina, HF</li>
<li><strong>Thromboembolism risk</strong> — use CHA₂DS₂-VASc score</li>
<li>Conversion risk if >48 h — anticoagulate ≥3 weeks first</li>
</ul>
</div>
</div>
<div>
<div class="img-block">
<img src="https://cdn.orris.care/cdss_images/fe540927466023e89897808fc74499319d5538d36547710049c60da77a0ffea7.png"
alt="Atrial fibrillation ECG tracing"/>
<div class="caption"><strong>Atrial Fibrillation.</strong> Note: no discernible P waves, chaotic baseline, and irregularly irregular QRS complexes with varying R-R intervals.</div>
<div class="source">Pye's Surgical-Handicraft, Fig. 17.35</div>
</div>
<table class="mt8">
<thead>
<tr><th>Type</th><th>Duration</th><th>Key Point</th></tr>
</thead>
<tbody>
<tr><td>Paroxysmal</td><td><7 days</td><td>Terminates spontaneously</td></tr>
<tr><td>Persistent</td><td>>7 days</td><td>Requires cardioversion</td></tr>
<tr><td>Long-standing</td><td>>1 year</td><td>Structural remodelling</td></tr>
<tr><td>Permanent</td><td>Ongoing</td><td>Rhythm control abandoned</td></tr>
</tbody>
</table>
</div>
</div>
<!-- ══════════════════════════════════════════════
FINDING 4 — BUNDLE BRANCH BLOCKS
══════════════════════════════════════════════ -->
<div class="section-header">
<div class="num">3</div>
<h2>Bundle Branch Blocks</h2>
<span class="tag">Conduction Defect</span>
</div>
<div class="img-block full-col">
<img src="https://cdn.orris.care/cdss_images/ad352bb18c8368864e520ff78d27c0ceb0cb0271df10661e01be29f6d32f38b3.png"
alt="RBBB and LBBB compared to normal in V1 and V6" style="max-height:250px;"/>
<div class="caption"><strong>Comparison of Normal, RBBB, and LBBB in leads V1 and V6.</strong> Normal (top) → rS in V1, qR in V6. RBBB (middle) → rSR' in V1, slurred S in V6. LBBB (bottom) → QS in V1, broad monophasic R in V6.</div>
<div class="source">Harrison's Principles of Internal Medicine 22E, Fig. 247-10</div>
</div>
<div class="two-col">
<div class="card red">
<h3>Right Bundle Branch Block (RBBB)</h3>
<ul>
<li><strong>QRS ≥120 ms</strong></li>
<li>V1: <strong>rSR'</strong> ("rabbit ears" / M-shaped)</li>
<li>V6 + Lead I: wide, slurred <strong>S wave</strong></li>
<li>Secondary T-wave inversions in V1–V3</li>
</ul>
<div class="mech-box mt8">
RV depolarisation delayed → terminal QRS vector rightward + anterior
</div>
<p class="mt8 small"><strong>Causes:</strong> Benign (normal variant), PE, ASD, RV strain, ischaemia</p>
</div>
<div class="card blue">
<h3>Left Bundle Branch Block (LBBB)</h3>
<ul>
<li><strong>QRS ≥120 ms</strong></li>
<li>V1: wide, entirely negative (<strong>QS complex</strong>)</li>
<li>V6: broad, tall, entirely positive (<strong>R wave</strong>)</li>
<li>No septal Q wave in V6 (reversed septal activation)</li>
<li>Secondary T-wave inversion where R is dominant</li>
</ul>
<div class="mech-box mt8">
LV depolarisation delayed; septal activation reversed (R→L instead of L→R)
</div>
<p class="mt8 small"><strong>Causes (almost always pathological):</strong> CAD, hypertension, dilated CMP, valvular disease. New LBBB + chest pain → treat as STEMI equivalent (Sgarbossa criteria)</p>
</div>
</div>
<!-- ══════════════════════════════════════════════
FINDING 5 — LVH
══════════════════════════════════════════════ -->
<div class="section-header">
<div class="num">4</div>
<h2>Left Ventricular Hypertrophy (LVH)</h2>
<span class="tag">Structural Change</span>
</div>
<div class="two-col">
<div class="card red">
<h3>Voltage Criteria (any one = LVH)</h3>
<table>
<thead><tr><th>Criterion</th><th>Threshold</th></tr></thead>
<tbody>
<tr><td><strong>Sokolow-Lyon</strong></td><td>SV1 + RV5 or RV6 ≥ 35 mm</td></tr>
<tr><td><strong>Cornell (men)</strong></td><td>R aVL > 28 mm</td></tr>
<tr><td><strong>Cornell (women)</strong></td><td>R aVL > 20 mm</td></tr>
<tr><td><strong>R aVL alone</strong></td><td>≥ 11 mm (simple screen)</td></tr>
</tbody>
</table>
</div>
<div>
<div class="card blue">
<h3>Associated Features</h3>
<ul>
<li><strong>"Strain" pattern:</strong> ST depression + T-wave inversion in lateral leads (I, aVL, V5–V6) where R is tall</li>
<li><strong>Left atrial abnormality:</strong> broad notched P in II; deep negative terminal P in V1 — increases specificity</li>
<li>May progress to LBBB</li>
</ul>
</div>
<div class="card amber mt8">
<h3>Pitfalls</h3>
<ul>
<li>High voltage is a <strong>normal variant</strong> in young/athletic individuals</li>
<li>Sensitivity low in obese, COPD, older adults</li>
<li>Echo/MRI provides definitive anatomic assessment</li>
<li>LVH on ECG = independent cardiovascular risk marker</li>
</ul>
</div>
</div>
</div>
<!-- ══════════════════════════════════════════════
FINDING 6 — AV BLOCK
══════════════════════════════════════════════ -->
<div class="section-header">
<div class="num">5</div>
<h2>Atrioventricular (AV) Block</h2>
<span class="tag">Conduction Defect</span>
</div>
<div class="img-block">
<img src="https://cdn.orris.care/cdss_images/1b7cd0186cf60b18a2a29dd04908ddeac5265c3fadc40a2a02cf2f87bf522be7.png"
alt="Complete heart block ECG tracing"/>
<div class="caption"><strong>Complete (3rd-degree) Heart Block.</strong> Small independent P waves fire at ~75/min (atrial rate). Wide, slow QRS complexes represent ventricular escape rhythm at ~35/min. No relationship between P and QRS.</div>
<div class="source">Pye's Surgical-Handicraft, Fig. 17.34</div>
</div>
<table>
<thead>
<tr>
<th>Type</th><th>PR Interval</th><th>QRS Dropped?</th><th>Site of Block</th><th>Urgency</th>
</tr>
</thead>
<tbody>
<tr>
<td><strong>1st Degree</strong></td>
<td>>200 ms (constant)</td>
<td>Never</td>
<td>AV node</td>
<td><span class="badge-g">Benign</span></td>
</tr>
<tr>
<td><strong>2nd Degree Mobitz I</strong> (Wenckebach)</td>
<td>Progressive lengthening until dropped beat</td>
<td>Yes, periodically</td>
<td>AV node</td>
<td><span class="badge-o">Monitor</span></td>
</tr>
<tr>
<td><strong>2nd Degree Mobitz II</strong></td>
<td>Fixed, sudden dropped QRS</td>
<td>Yes, unpredictably</td>
<td>Bundle of His / below</td>
<td><span class="badge-r">Pace risk</span></td>
</tr>
<tr>
<td><strong>3rd Degree (Complete)</strong></td>
<td>No relationship (AV dissociation)</td>
<td>Total dissociation</td>
<td>Any level</td>
<td><span class="badge-r">Urgent pacing</span></td>
</tr>
</tbody>
</table>
<div class="card amber mt8">
<h3>Common Causes of AV Block</h3>
<p>Inferior MI (RCA supplies AV node) • Digoxin toxicity • Beta-blockers / CCBs • Lyme disease • Sarcoidosis • Congenital • Post-cardiac surgery • Age-related fibrosis (Lenègre disease)</p>
</div>
<!-- ══════════════════════════════════════════════
FINDING 7 — PROLONGED QT
══════════════════════════════════════════════ -->
<div class="section-header">
<div class="num">6</div>
<h2>Prolonged QT Interval</h2>
<span class="tag">Arrhythmia Risk</span>
</div>
<div class="two-col">
<div class="card red">
<h3>Diagnostic Criteria</h3>
<ul>
<li>QTc (Bazett) = QT ÷ √RR interval</li>
<li><strong>Men: QTc ≥ 440 ms</strong></li>
<li><strong>Women: QTc ≥ 460 ms</strong></li>
<li>Symptomatic LQTS diagnosis: QTc ≥ 480 ms</li>
</ul>
<div class="key-finding mt8">Risk of Torsades de Pointes → polymorphic VT → VF</div>
<div class="card green mt8">
<h3>Congenital LQTS Subtypes</h3>
<table>
<thead><tr><th>Subtype</th><th>Gene</th><th>Trigger</th></tr></thead>
<tbody>
<tr><td>LQTS1</td><td>KCNQ1 (IKs ↓)</td><td>Exercise / swimming</td></tr>
<tr><td>LQTS2</td><td>KCNH2 (IKr ↓)</td><td>Sudden noise, emotion</td></tr>
<tr><td>LQTS3</td><td>SCN5A (INa ↑)</td><td>Sleep / bradycardia</td></tr>
</tbody>
</table>
</div>
</div>
<div class="card blue">
<h3>Acquired Causes (DRUGS most common)</h3>
<table>
<thead><tr><th>Category</th><th>Examples</th></tr></thead>
<tbody>
<tr><td>Antiarrhythmics</td><td>Sotalol, amiodarone, quinidine</td></tr>
<tr><td>Antibiotics</td><td>Azithromycin, fluoroquinolones</td></tr>
<tr><td>Antipsychotics</td><td>Haloperidol, quetiapine</td></tr>
<tr><td>Antifungals</td><td>Fluconazole</td></tr>
<tr><td>Electrolytes</td><td>Hypokalaemia, hypomagnesaemia, hypocalcaemia</td></tr>
<tr><td>Other</td><td>Hypothyroidism, hypothermia, myocarditis</td></tr>
</tbody>
</table>
<div class="mech-box mt8">
<strong>Mechanism:</strong> Reduced outward K⁺ current or increased inward Na⁺/Ca²⁺ current → delayed ventricular repolarisation → dispersion of refractoriness → susceptibility to early afterdepolarisations (EADs) → Torsades.
</div>
</div>
</div>
<!-- ══════════════════════════════════════════════
FINDING 8 — HYPERKALEMIA
══════════════════════════════════════════════ -->
<div class="section-header">
<div class="num">7</div>
<h2>Hyperkalemia — ECG Changes</h2>
<span class="tag">⚠ LIFE-THREATENING</span>
</div>
<div class="img-block">
<img src="https://cdn.orris.care/cdss_images/35643c9e9ee1c957d7778234b0449dd100bef8f320fa17fe7fdb50e2cc3d6f38.png"
alt="Sequential ECG changes in hyperkalemia" style="max-height:220px;"/>
<div class="caption"><strong>Hyperkalemia — Progressive ECG Changes.</strong> Left: Mild-moderate — narrow, tall peaked ("tented") T waves in V1–V2. Middle: Moderate-severe — QRS widening, P-wave flattening, tall peaked T persists. Right: Very severe — sine-wave pattern; imminent VF / asystole.</div>
<div class="source">Harrison's Principles of Internal Medicine 22E, Fig. 247-14</div>
</div>
<table>
<thead>
<tr><th>K⁺ Level</th><th>ECG Change</th><th>Action</th></tr>
</thead>
<tbody>
<tr><td>5.5–6.5 mEq/L</td><td>Tall, narrow, peaked ("tented") T waves — <em>earliest change</em></td><td><span class="badge-o">Monitor</span></td></tr>
<tr><td>6.5–7.5 mEq/L</td><td>PR prolongation, QRS widening, P-wave flattening</td><td><span class="badge-o">Treat urgently</span></td></tr>
<tr><td>>7.5 mEq/L</td><td>P waves disappear; sine-wave QRS-T fusion</td><td><span class="badge-r">Emergency</span></td></tr>
<tr><td>>8–9 mEq/L</td><td>VF or asystole</td><td><span class="badge-r">Resuscitation</span></td></tr>
</tbody>
</table>
<div class="card red mt8">
<h3>Emergency Management</h3>
<p><strong>1. Membrane stabilisation:</strong> IV Calcium gluconate 10 ml 10% (immediate, 30-min effect) | <strong>2. Shift K⁺ intracellularly:</strong> Insulin 10 U + Glucose 50% 50 ml IV; Nebulised salbutamol 10–20 mg; IV Sodium bicarbonate (if acidotic) | <strong>3. Eliminate K⁺:</strong> Furosemide (if urine output adequate); Calcium resonium; Dialysis (definitive in renal failure)</p>
</div>
<!-- ══════════════════════════════════════════════
FINDING 9 — HYPOKALEMIA
══════════════════════════════════════════════ -->
<div class="section-header">
<div class="num">8</div>
<h2>Hypokalemia — U Waves & QT Prolongation</h2>
<span class="tag">Electrolyte</span>
</div>
<div class="two-col">
<div class="img-block">
<img src="https://cdn.orris.care/cdss_images/ec713da1bee437018189466a17d21250e796dea97ac8a54750c9cd42ebde487f.png"
alt="Hypokalemia ECG showing U waves in lead II and V3"/>
<div class="caption"><strong>Hypokalemia.</strong> Lead II: flat T wave, low amplitude. Lead V3: Prominent U wave (labeled "U") after the T wave — represents delayed Purkinje repolarisation. The apparent long QT is actually QU prolongation.</div>
<div class="source">Harrison's 22E — Hypokalemia panel</div>
</div>
<div>
<div class="card red">
<h3>Key ECG Features</h3>
<ul>
<li><strong>Flat or inverted T waves</strong></li>
<li><strong>Prominent U wave</strong> — most visible in V2–V4 (rounded deflection <em>after</em> T wave, same polarity)</li>
<li>Apparent QT prolongation (actually QU interval)</li>
<li>ST depression</li>
<li>Risk of <strong>Torsades de Pointes</strong></li>
</ul>
</div>
<div class="mech-box mt8">
<strong>U wave origin:</strong> Delayed repolarisation of Purkinje fibres and mid-myocardial (M) cells when extracellular K⁺ is low → prolonged phase 3 of action potential
</div>
<div class="card amber mt8">
<h3>Causes</h3>
<p>Diuretics (most common) • Vomiting / diarrhoea • Hyperaldosteronism • Renal tubular acidosis • Magnesium depletion (co-correct) • Insulin / catecholamines</p>
</div>
</div>
</div>
<!-- ══════════════════════════════════════════════
FINDING 10 — PERICARDITIS
══════════════════════════════════════════════ -->
<div class="section-header">
<div class="num">9</div>
<h2>Acute Pericarditis & Pericardial Effusion</h2>
<span class="tag">Inflammatory</span>
</div>
<div class="two-col">
<div class="card red">
<h3>4 Evolutionary ECG Stages</h3>
<table>
<thead><tr><th>Stage</th><th>Timeframe</th><th>ECG Change</th></tr></thead>
<tbody>
<tr><td><strong>1</strong></td><td>Hours–days</td><td>Diffuse <em>concave-up</em> ("saddle") ST elevation + PR depression (most leads except aVR/V1 which show opposite)</td></tr>
<tr><td><strong>2</strong></td><td>Days 1–3</td><td>ST & PR normalise</td></tr>
<tr><td><strong>3</strong></td><td>Days 3–14</td><td>Diffuse T-wave inversions</td></tr>
<tr><td><strong>4</strong></td><td>Weeks</td><td>T waves normalise</td></tr>
</tbody>
</table>
<div class="key-finding mt8">Key distinguisher from STEMI: <span>Concave (smiley-face) ST elevation is diffuse across multiple territories; STEMI is focal + reciprocal changes</span></div>
</div>
<div>
<div class="card blue">
<h3>Pericardial Effusion / Tamponade ECG Signs</h3>
<ul>
<li><strong>Sinus tachycardia</strong> — usually first finding</li>
<li><strong>Low QRS voltage</strong> — ≤5 mm in all limb leads <em>or</em> ≤10 mm in all precordial leads</li>
<li><strong>PR depression</strong> — ≥1 mm in ≥1 lead (not aVR)</li>
<li><strong>Electrical alternans</strong> — beat-to-beat alternation in QRS amplitude (heart "swinging" in fluid). Total P+QRS+T alternans with tachycardia = relatively specific for <strong>cardiac tamponade</strong></li>
</ul>
</div>
<div class="card amber mt8">
<h3>Important Caveat</h3>
<p>ECG sensitivity for pericardial effusion is only <strong>1–17%</strong>. A normal ECG does <strong>not</strong> exclude tamponade. <strong>Bedside echo is mandatory</strong> for confirmation (look for RA/RV collapse in diastole).</p>
</div>
</div>
</div>
<!-- ══════════════════════════════════════════════
FINDING 11 — PATHOLOGICAL Q WAVES
══════════════════════════════════════════════ -->
<div class="section-header">
<div class="num">10</div>
<h2>Pathological Q Waves (Old/Evolving Infarction)</h2>
<span class="tag">Infarction Marker</span>
</div>
<div class="two-col">
<div class="card red">
<h3>Diagnostic Criteria</h3>
<ul>
<li>Width <strong>≥40 ms</strong> (≥1 small square at 25 mm/s) <strong>OR</strong></li>
<li>Depth <strong>≥25%</strong> of the R-wave amplitude in the same lead</li>
<li>Present in ≥2 contiguous leads in the same territory</li>
</ul>
<div class="mech-box mt8">
<strong>Mechanism:</strong> Infarcted myocardium is electrically silent. The "window" created faces the ventricular cavity. Leads overlying the infarct record the opposing cavity's negative vector → deep Q wave.
</div>
</div>
<div>
<div class="card blue">
<h3>Localisation by Lead Group</h3>
<table>
<thead><tr><th>Leads with Q waves</th><th>Territory</th><th>Artery</th></tr></thead>
<tbody>
<tr><td>V1–V4</td><td>Anterior</td><td>LAD</td></tr>
<tr><td>II, III, aVF</td><td>Inferior</td><td>RCA (85%)</td></tr>
<tr><td>I, aVL, V5–V6</td><td>Lateral</td><td>LCx</td></tr>
<tr><td>V1–V2 (tall R)</td><td>Posterior</td><td>RCA/LCx</td></tr>
</tbody>
</table>
</div>
<div class="card green mt8">
<h3>Normal Q Waves (do NOT over-diagnose)</h3>
<ul>
<li>Small septal Q waves (<40 ms, <2 mm) in I, V5, V6 — normal septal activation</li>
<li>Q in aVR — always normal</li>
<li>Q in III alone (without II + aVF) — often positional</li>
<li>Q in V1 — normal variant</li>
</ul>
</div>
</div>
</div>
<!-- ══════════════════════════════════════════════
QUICK-REFERENCE SUMMARY TABLE (final page)
══════════════════════════════════════════════ -->
<div class="summary-page">
<div class="summary-header">⚡ QUICK-REFERENCE SUMMARY — 10 Common ECG Findings</div>
<div class="summary-table">
<table>
<thead>
<tr>
<th>#</th>
<th>Finding</th>
<th>Key ECG Feature</th>
<th>Normal Comparator</th>
<th>Primary Concern</th>
<th>Urgency</th>
</tr>
</thead>
<tbody>
<tr>
<td>1</td>
<td><strong>ST Elevation (STEMI)</strong></td>
<td>≥1 mm ST ↑ in ≥2 contiguous leads; hyperacute T</td>
<td>Isoelectric ST segment</td>
<td>Total coronary occlusion</td>
<td><span class="badge-r">Emergency</span></td>
</tr>
<tr>
<td>2</td>
<td><strong>Wellens Sign</strong></td>
<td>Deep symmetric T inversions V1–V4, no Q, no ST ↑</td>
<td>Upright T waves precordially</td>
<td>Critical LAD stenosis; impending STEMI</td>
<td><span class="badge-r">Urgent</span></td>
</tr>
<tr>
<td>3</td>
<td><strong>Atrial Fibrillation</strong></td>
<td>No P waves; irregularly irregular narrow QRS</td>
<td>Regular rhythm; clear P waves</td>
<td>Stroke risk; rate/rhythm control</td>
<td><span class="badge-o">Manage</span></td>
</tr>
<tr>
<td>4</td>
<td><strong>RBBB</strong></td>
<td>rSR' in V1; wide slurred S in V6; QRS ≥120 ms</td>
<td>rS in V1; narrow QRS</td>
<td>Can be benign; check for PE/ASD</td>
<td><span class="badge-g">Context</span></td>
</tr>
<tr>
<td>5</td>
<td><strong>LBBB</strong></td>
<td>QS in V1; monophasic R in V6; QRS ≥120 ms</td>
<td>rS in V1; narrow QRS</td>
<td>Usually pathological; new LBBB = STEMI equivalent</td>
<td><span class="badge-r">Urgent</span></td>
</tr>
<tr>
<td>6</td>
<td><strong>LVH</strong></td>
<td>SV1 + RV5/V6 ≥35 mm; lateral ST depression/T inversions</td>
<td>Normal QRS amplitude</td>
<td>Hypertension; HCM; increased CV risk</td>
<td><span class="badge-o">Investigate</span></td>
</tr>
<tr>
<td>7</td>
<td><strong>Complete Heart Block</strong></td>
<td>P-QRS dissociation; slow escape rhythm</td>
<td>1:1 PR relationship; regular rhythm</td>
<td>Haemodynamic compromise; syncope</td>
<td><span class="badge-r">Urgent pacing</span></td>
</tr>
<tr>
<td>8</td>
<td><strong>Prolonged QT</strong></td>
<td>QTc ≥440 ms (M) / ≥460 ms (F)</td>
<td>QTc <440 ms (M) <460 ms (F)</td>
<td>Torsades de Pointes; VF</td>
<td><span class="badge-r">Urgent</span></td>
</tr>
<tr>
<td>9</td>
<td><strong>Hyperkalemia</strong></td>
<td>Peaked T → QRS widening → sine wave</td>
<td>Normal T amplitude; narrow QRS</td>
<td>VF / asystole</td>
<td><span class="badge-r">Emergency</span></td>
</tr>
<tr>
<td>10</td>
<td><strong>Hypokalemia</strong></td>
<td>Flat T; prominent U wave; apparent long QT</td>
<td>No U wave; normal T amplitude</td>
<td>Torsades de Pointes</td>
<td><span class="badge-o">Correct</span></td>
</tr>
<tr>
<td>11</td>
<td><strong>Pericarditis</strong></td>
<td>Diffuse concave ST ↑ + PR depression (Stage 1)</td>
<td>Isoelectric ST/PR</td>
<td>Tamponade if effusion (look for electrical alternans)</td>
<td><span class="badge-o">Monitor</span></td>
</tr>
<tr>
<td>12</td>
<td><strong>Pathological Q Waves</strong></td>
<td>Q ≥40 ms wide or ≥25% R amplitude in ≥2 contiguous leads</td>
<td>No Q or small septal Q <40 ms</td>
<td>Old or evolving myocardial infarction</td>
<td><span class="badge-o">Investigate</span></td>
</tr>
</tbody>
</table>
</div>
<div class="card amber" style="margin-top:16px; page-break-inside:avoid;">
<h3>ECG Interpretation Checklist (Systematic Approach)</h3>
<div class="three-col" style="margin:8px 0 0 0;">
<div>
<p class="bold">1. Rate</p>
<p class="small">300 ÷ large squares between R-R. Normal 60–100 bpm.</p>
<p class="bold mt8">2. Rhythm</p>
<p class="small">Regular? P before every QRS? QRS after every P?</p>
<p class="bold mt8">3. Axis</p>
<p class="small">Normal –30° to +90°. LAD if negative in aVF. RAD if positive in aVF + negative in I.</p>
</div>
<div>
<p class="bold">4. P Wave</p>
<p class="small">Upright in II, inverted in aVR. Duration <120 ms. Amplitude <2.5 mm.</p>
<p class="bold mt8">5. PR Interval</p>
<p class="small">Normal 120–200 ms. Short → WPW/junctional. Long → AV block.</p>
<p class="bold mt8">6. QRS Complex</p>
<p class="small">Duration <120 ms. Check for Q waves, R progression (V1→V6), voltage.</p>
</div>
<div>
<p class="bold">7. ST Segment</p>
<p class="small">Isoelectric at J-point. Elevation or depression ≥1 mm = abnormal until proved otherwise.</p>
<p class="bold mt8">8. T Wave</p>
<p class="small">Upright in I, II, V4–V6. Inversion = ischaemia, strain, BBB, PE.</p>
<p class="bold mt8">9. QT Interval</p>
<p class="small">Correct for rate (Bazett). QTc ≥500 ms = very high TdP risk.</p>
</div>
</div>
</div>
<p style="text-align:center; margin-top:14px; font-size:7pt; color:#8892b0;">
Sources: Harrison's Principles of Internal Medicine 22E (2025) • Tintinalli's Emergency Medicine • Braunwald's Heart Disease • Roberts & Hedges' Clinical Procedures in Emergency Medicine • Textbook of Family Medicine 9E • Pye's Surgical-Handicraft<br/>
<em>This guide is for educational purposes only. Clinical decisions should always incorporate full patient context, serial ECGs, and senior clinical review.</em>
</p>
</div>
</body>
</html>
cd /home/daytona/workspace/ecg-guide && python3 -c "import weasyprint; print(weasyprint.__version__)"
which wkhtmltopdf && wkhtmltopdf --version 2>/dev/null; which chromium-browser 2>/dev/null; which google-chrome 2>/dev/null; which chromium 2>/dev/null; python3 -c "import pdfkit; print('pdfkit ok')" 2>/dev/null; python3 -c "from reportlab.lib import pagesizes; print('reportlab ok')" 2>/dev/null; python3 -c "import playwright; print('playwright ok')" 2>/dev/null
chromium --headless --no-sandbox --disable-gpu --print-to-pdf=/home/daytona/workspace/ecg-guide/ECG_Quick_Reference_Guide.pdf --print-to-pdf-no-header "file:///home/daytona/workspace/ecg-guide/ecg_guide.html" 2>&1 | tail -5
ls -lh /home/daytona/workspace/ecg-guide/ECG_Quick_Reference_Guide.pdf
ECG Quick Reference Guide
PDF Document · PDF
| Section | Content |
|---|---|
| Cover page | Styled title page listing all 10 findings |
| Findings 1–10 | Each on its own section with colour-coded cards |
| Textbook ECG images | Anterior STEMI, Inferior STEMI, Wellens sign, RBBB/LBBB comparison, AF, Complete heart block, Hyperkalemia progression, Hypokalemia U waves, ST deviation mechanism diagram |
| Mechanism boxes | Brief pathophysiology for each finding |
| Urgency badges | Emergency / Urgent / Monitor / Benign colour coding |
| Quick-reference summary table | All 12 findings in one table with key ECG features, normal comparators, and urgency |
| ECG interpretation checklist | 9-step systematic approach (Rate → Rhythm → Axis → P → PR → QRS → ST → T → QT) |