
CNS physiology full chapter form basic to advanced
neuron action potential membrane CNS physiology diagram
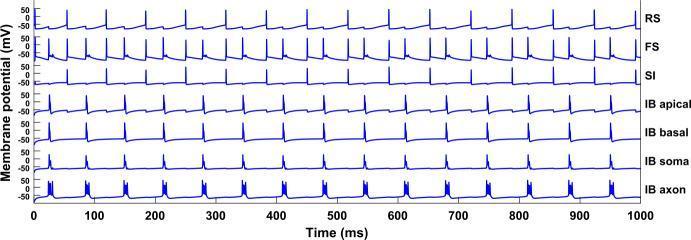
This pathophysiology diagram displays a Hodgkin-Huxley type simulation of neuronal network activity over a 1000 ms duration. The visual illustrates the periodic membrane potential (mV) oscillations of different neuronal types and compartments. The traces represent: regular spiking (RS), fast-spiking (FS), slow inhibitory (SI), and four compartments of an intrinsically bursting (IB) neuron (apical dendrite, basal dendrite, soma, and axon). Membrane potentials fluctuate between approximately -70 mV and +50 mV. Key educational concepts include firing patterns and synchronization. The RS and SI traces exhibit single spikes in phase with each other at approximately 15 Hz. In contrast, the FS neuron fires at double this frequency (30 Hz). The IB compartments demonstrate complex spatial dynamics; while the apical and basal dendrites, soma, and soma-proximal structures show single periodic spikes, the IB axon specifically exhibits characteristic high-frequency bursts of multiple spikes. The diagram serves as a model for understanding neural rhythms, such as parietal beta1 oscillations, and the influence of cellular architecture on action potential morphology.
![This pathophysiology diagram illustrates the simulated electrophysiological response of a chemosensitive neuron from the Locus Coeruleus (LC) to electrical stimulation. Panel A displays the membrane potential (V, mV) responding to a hyperpolarizing pulse (-0.5 nA) and subsequent depolarizing pulse (0.6 nA). The trace shows an initial decrease in potential followed by a rapid burst of action potentials and spike frequency adaptation. Panel B details the postinhibitory rebound phase (3.0-4.5 s), highlighting the roles of the A-type potassium current (A) and T-type calcium current (T), the latter showing a significant influx correlating with a sharp rise in intracellular calcium concentration ([Ca2+]i). Panel C focuses on post-stimulation recovery, demonstrating the activation of M-type (M) and small-conductance calcium-activated potassium (SK) currents. The accumulation and gradual decay of [Ca2+]i modulate the firing frequency, showing that these ionic currents regulate the neuron's repetitive firing dynamics and recovery toward resting states.](https://cdn.orris.care/cdss_images/pmc_clinical_VQA_708e942ad67f1f4f8b69c6b8477d5171bac4e6c1959de6f72414bf2ca5b805da.jpg)
This pathophysiology diagram illustrates the simulated electrophysiological response of a chemosensitive neuron from the Locus Coeruleus (LC) to electrical stimulation. Panel A displays the membrane potential (V, mV) responding to a hyperpolarizing pulse (-0.5 nA) and subsequent depolarizing pulse (0.6 nA). The trace shows an initial decrease in potential followed by a rapid burst of action potentials and spike frequency adaptation. Panel B details the postinhibitory rebound phase (3.0-4.5 s), highlighting the roles of the A-type potassium current (A) and T-type calcium current (T), the latter showing a significant influx correlating with a sharp rise in intracellular calcium concentration ([Ca2+]i). Panel C focuses on post-stimulation recovery, demonstrating the activation of M-type (M) and small-conductance calcium-activated potassium (SK) currents. The accumulation and gradual decay of [Ca2+]i modulate the firing frequency, showing that these ionic currents regulate the neuron's repetitive firing dynamics and recovery toward resting states.
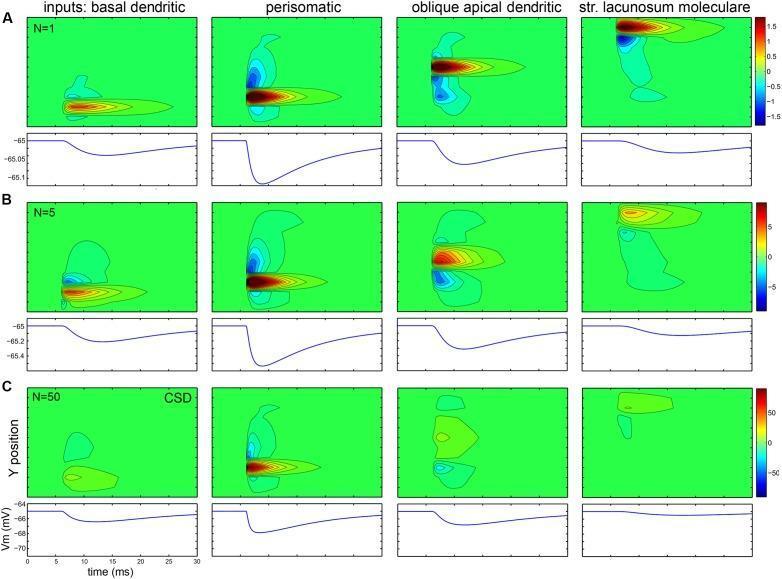
Educational neurophysiology diagram illustrating current source density (CSD) and membrane potential (Vm) dynamics in a neuron model across three input scales (N=1, N=5, N=50). The figure is organized into four columns representing specific synaptic input locations: basal dendritic, perisomatic, oblique apical dendritic, and stratum lacunosum moleculare. Each row (A, B, C) depicts the increasing number of synaptic inputs. The top sub-panels show heat maps of CSD over time (X-axis) and spatial Y-position, where red indicates current sources and blue indicates current sinks (scale in pA). The bottom sub-panels show line graphs of membrane potential (Vm in mV) over a 30 ms duration. The data demonstrates that while intracellular potentials (Vm) summate with more inputs, extracellular signals (CSD) tend to cancel out and weaken for non-perisomatic inputs as N increases. This visual resource is used to teach concepts of bioelectricity, synaptic integration, and the biophysical principles underlying local field potentials in neurobiology and clinical neurophysiology.
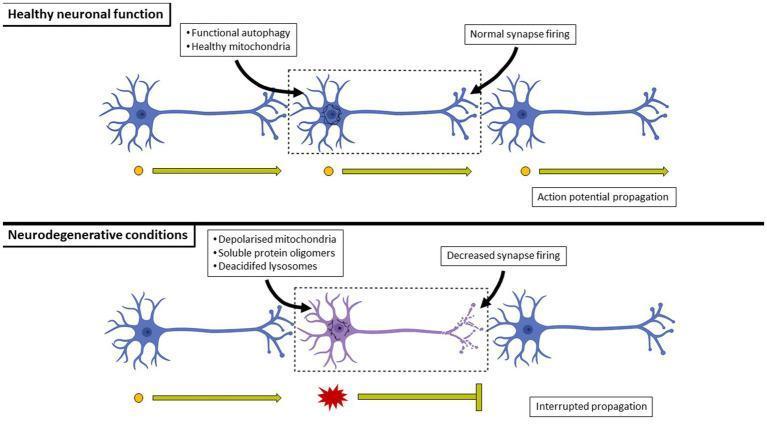
This pathophysiology diagram provides a comparative visualization of neurons under 'Healthy neuronal function' versus 'Neurodegenerative conditions'. The upper panel depicts healthy neurons with intact morphology, functional autophagy, and healthy mitochondria, which facilitate 'Normal synapse firing'. Signal transmission is represented by continuous yellow arrows labeled 'Action potential propagation', indicating efficient neurotransmission. In contrast, the lower panel illustrates the impact of neurodegenerative disease on cellular physiology. The affected neuron exhibits structural changes, including a discolored (purple) soma and fragmented axon terminals. Key pathological features highlighted include depolarized mitochondria, the accumulation of soluble protein oligomers, and deacidified lysosomes. These cellular dysfunctions result in 'Decreased synapse firing' and 'Interrupted propagation', visually represented by a broken action potential arrow with a red burst symbol and a terminal block. The diagram serves as an educational summary of how impaired proteostasis and mitochondrial health lead to the breakdown of neuronal circuits in diseases such as Alzheimer’s, Parkinson’s, and Huntington’s.
synapse neurotransmitter synaptic transmission diagram
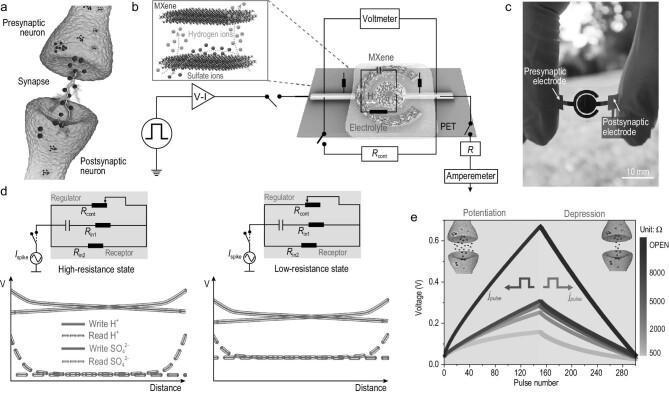
This composite educational image illustrates the design and function of a flexible MXene-based electrochemical synaptic (FMES) device for neuromorphic computing and implantable prosthetics. Panel (a) presents a biological pathophysiology diagram of a synapse, showing neurotransmitter transmission from a presynaptic to a postsynaptic neuron. Panel (b) translates this into an anatomical/electronic diagram of the FMES device, featuring MXene electrodes on a PET substrate with an electrolyte medium; an inset shows the dynamic diffusion of hydrogen and sulfate ions. Panel (c) is a clinical/technical photograph showing the physical device—a small, flexible circular chip with labeled presynaptic and postsynaptic electrodes—held between fingers for scale (10 mm). Panel (d) provides circuit algorithms comparing high-resistance and low-resistance states, with corresponding voltage-distance plots for ionic 'read/write' operations. Panel (e) is a comparison chart showing the potentiation and depression behaviors of artificial synapses, plotting voltage against pulse number across various resistance states. This content demonstrates how bio-inspired electronics can simulate synaptic plasticity for advanced medical engineering applications like neural electrode arrays.
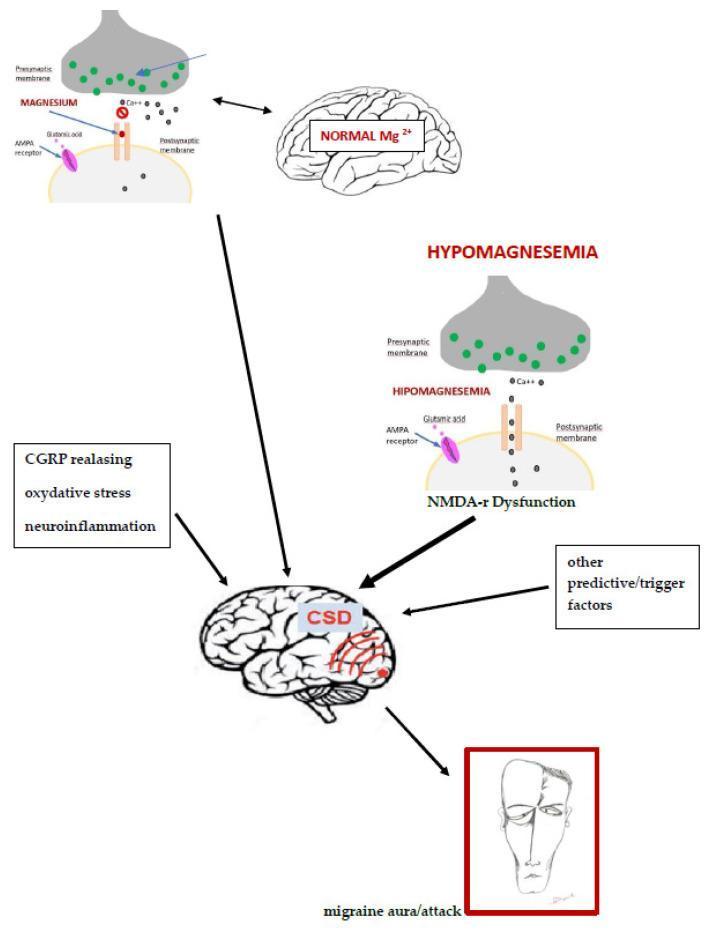
This pathophysiology diagram illustrates the role of magnesium in migraine pathogenesis and synaptic transmission. The top section compares a synapse under 'NORMAL Mg2+' conditions with one in 'HYPOMAGNESEMIA'. In the normal state, the NMDA receptor is shown with a magnesium block, regulating calcium (Ca++) entry. In the hypomagnesemia state, the block is absent, leading to 'NMDA-r Dysfunction' and increased ion flux. The diagram depicts key synaptic components including the presynaptic membrane with neurotransmitter vesicles, the postsynaptic membrane with AMPA and NMDA receptors, and glutamic acid signaling. The central flow shows how hypomagnesemia contributes to Cortical Spreading Depression (CSD), indicated on a brain illustration. Additional contributory factors shown include CGRP release, oxidative stress, neuroinflammation, and other trigger factors. The culmination of these processes is linked to 'migraine aura/attack,' represented by a facial illustration and a brain with focal excitatory waves. This diagram is designed for neurology and biochemistry education to explain the molecular mechanisms of magnesium deficiency in migraine development.
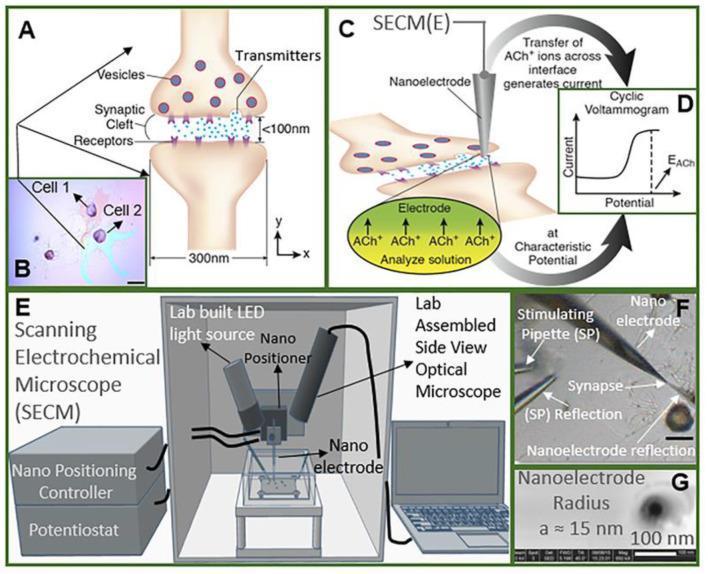
Educational scientific illustration and clinical micrograph set detailing cholinergic neurotransmission and its measurement via scanning electrochemical microscopy (SECM). (A) Pathophysiology diagram of a synapse showing a <100nm synaptic cleft, neurotransmitter vesicles, and postsynaptic receptors. (B) Light micrograph of cultured Aplysia ganglion neurons (Cell 1 and Cell 2). (C, D) Schematic of a nanoITIES pipette electrode and associated cyclic voltammogram demonstrating acetylcholine (ACh+) detection through ion transfer across a nanoscale interface. (E) Diagram of the experimental SECM setup, including a nano-positioning controller, potentiostat, and side-view optical microscope. (F) Real-time optical microscope image showing the spatial orientation of a stimulating pipette and nanoelectrode relative to a target synapse. (G) High-resolution scanning electron microscope (SEM) image of the nanoelectrode tip with a 15 nm radius. The composite illustrates high-precision electrochemical monitoring of neurotransmitter release dynamics at the single-synapse level, relevant to neurophysiology and diagnostic imaging research.
cerebral cortex brain lobes anatomy motor sensory areas
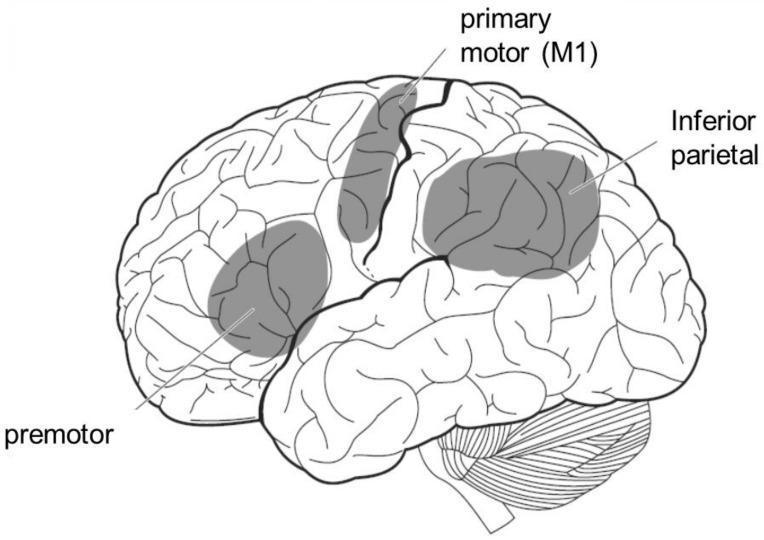
This anatomical diagram provides a lateral view of the human brain, specifically illustrating the cortical regions associated with the mirror neuron system. The line drawing highlights three key functional areas using shaded gray overlays and text labels: the premotor area in the frontal lobe, the primary motor cortex (M1) along the precentral gyrus, and the inferior parietal lobule in the parietal lobe. The diagram clearly depicts the complex surface anatomy of the cerebral cortex, including its gyri and sulci, which define the boundaries of these functional regions. The cerebellum is also visible inferiorly to the occipital and temporal lobes. This illustration is designed to teach the neuroanatomical basis of action-observation processing, demonstrating how the brain bridges visual perception of others' actions with its own motor representation. It is an educational resource suitable for neuroscience and clinical neurology, focusing on sensory-motor integration and the physiological mechanisms of social cognition.
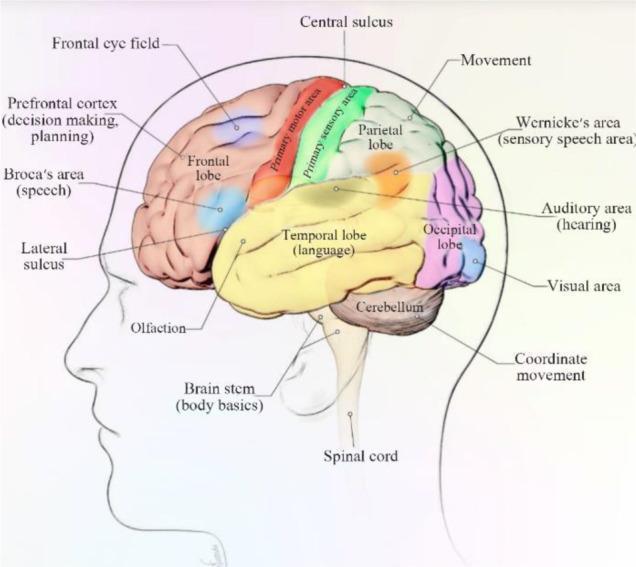
Anatomical diagram of the human brain from a lateral view, illustrating the four major lobes of the cerebral cortex and their functional localizations. The frontal lobe (tan) is shown at the anterior aspect, containing the prefrontal cortex (decision making), Broca's area (speech), and the frontal eye field. Posterior to the central sulcus is the parietal lobe (green), which houses the primary sensory area. The temporal lobe (yellow) is situated inferior to the lateral sulcus, highlighting areas for language, olfaction, and hearing. The occipital lobe (purple) is located at the posterior pole, containing the primary visual area. Key neuroanatomical landmarks labeled include the central and lateral sulci, which define lobar boundaries. The diagram also identifies the primary motor area (red) for movement, Wernicke's area for sensory speech at the temporal-parietal junction, and subcortical structures including the cerebellum (coordinate movement) and brain stem (body basics), transitioning into the spinal cord.
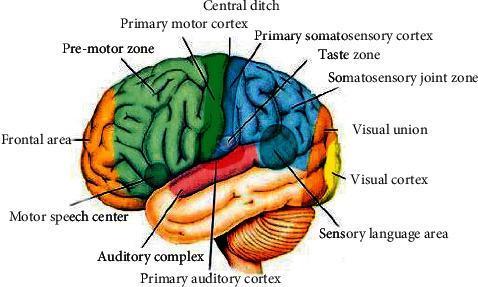
This anatomical diagram provides a color-coded distribution map of the functional areas of the human cerebral cortex, viewed from a lateral perspective. The image illustrates the localization of key neurological functions across the four major lobes: frontal, parietal, temporal, and occipital. The frontal lobe (orange/green) includes the prefrontal area, pre-motor zone, primary motor cortex, and Broca's area (motor speech center). The central sulcus (labeled 'Central ditch') serves as the boundary between the motor areas and the somatosensory regions of the parietal lobe (blue), which contains the primary somatosensory cortex, taste zone, and somatosensory joint zone. The occipital lobe (yellow/orange) at the posterior pole depicts the visual cortex and visual union (association area). The temporal lobe (tan/red) highlights the primary auditory cortex, auditory complex, and Wernicke's area (sensory language area). This educational diagram is used to demonstrate the specialized topographical organization of the brain, facilitating the study of neuroanatomy and the clinical correlation between cortical lesions and specific functional deficits.
autonomic nervous system sympathetic parasympathetic comparison diagram
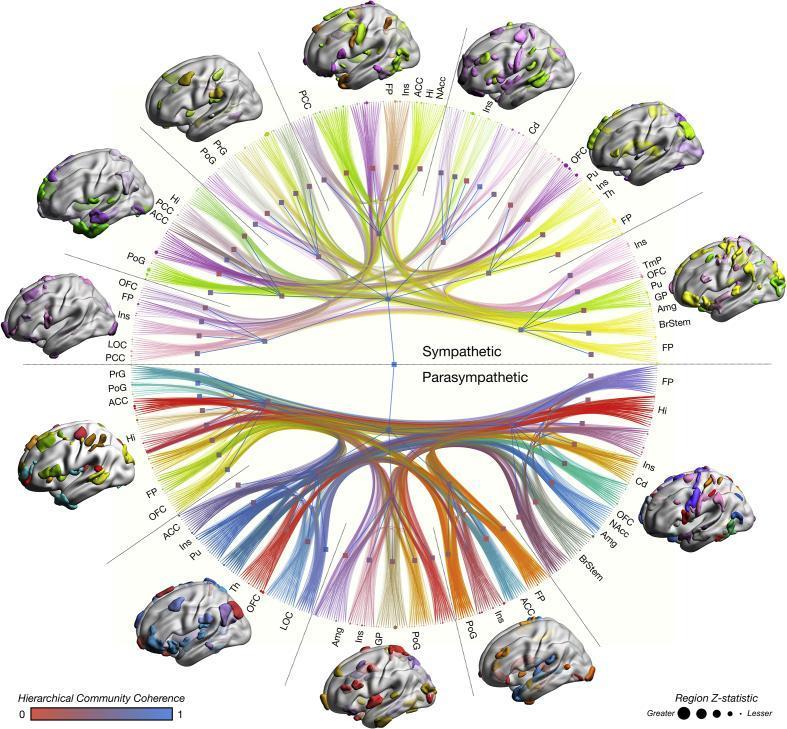
This multimodal anatomical and functional diagram illustrates the human 'autonomic connectome,' detailing the neural infrastructure of sympathetic and parasympathetic regulation. The central element is a circular network graph partitioned into two hemispheres: the upper represents the sympathetic nervous system and the lower the parasympathetic nervous system. Surrounding the center are colorful lines (edges) representing network-based statistics from functional MRI, gray matter morphometry, and white matter tractography. Edge width indicates connection effect size. The outer perimeter contains nodes corresponding to specific brain regions, such as the anterior cingulate cortex (ACC), insula (Ins), amygdala (Amg), and brainstem (BrStem). Node size is proportional to the Z-statistic importance of the region. Surrounding the central connectome are several 3D cortical surface reconstructions displaying color-coded parcellations that visualize hierarchical community structures. A color scale at the bottom indicates hierarchical community coherence (ranging from red to blue), while a size legend defines the regional Z-statistics. This educational visual explains the high-dimensional integration of disparate cortical and subcortical structures involved in autonomic homeostasis and sympathovagal balance.
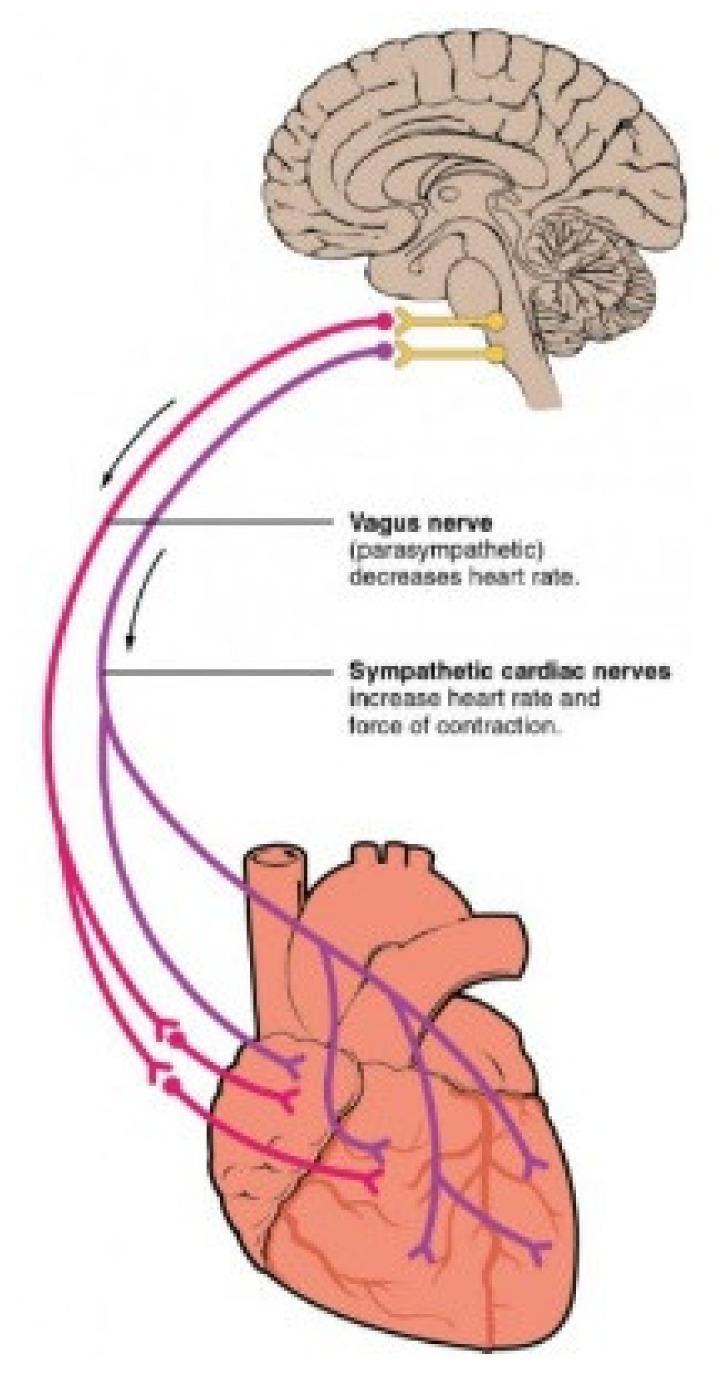
This medical illustration depicts the Autonomic Nervous System (ANS) pathways connecting the brainstem to the heart. A sagittal section of the human brain shows the medulla oblongata as the origin for both parasympathetic and sympathetic innervation. The Vagus nerve (parasympathetic), color-coded in purple, is shown descending from the brainstem to the heart, where it branches to innervate the atria and ventricles; text annotations indicate its role in decreasing heart rate. The sympathetic cardiac nerves, color-coded in red, originate from the same region and follow a parallel descending path, branching across the cardiac tissue; text labels specify their role in increasing both heart rate and the force of contraction. The diagram illustrates the functional antagonism between the two branches of the ANS in cardiac regulation, highlighting the primary innervation sites at the sinoatrial node, atrioventricular node, and the myocardium.
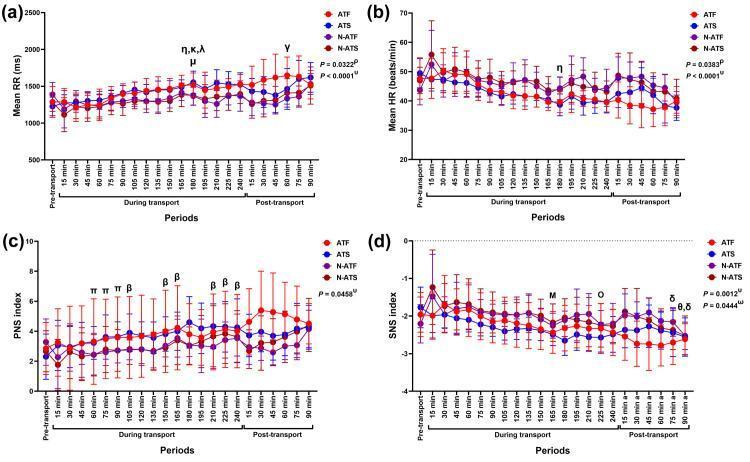
This Comparison Chart illustrates the autonomic nervous system response in horses across different transport conditions. The figure consists of four line graphs (a-d) showing physiological modulations during three phases: pre-transport, during transport (up to 240 minutes), and post-transport (up to 90 minutes). Graph (a) depicts mean RR intervals (ms), showing a gradual increasing trend over time across all conditions. Graph (b) shows mean heart rate (HR in beats/min), generally reflecting an inverse relationship to RR intervals with a slow decline during transport. Graph (c) displays the Parasympathetic Nervous System (PNS) index, while Graph (d) shows the Sympathetic Nervous System (SNS) index. The study compares four experimental groups: air-conditioned full load (ATF), air-conditioned space load (ATS), non-air-conditioned full load (N-ATF), and non-air-conditioned space load (N-ATS). Statistical significance is indicated by Greek letter annotations (e.g., η, κ, λ, μ, γ) representing specific time-point differences and interactions between air conditioning, loading density, and time.
spinal cord cross section reflex arc grey white matter
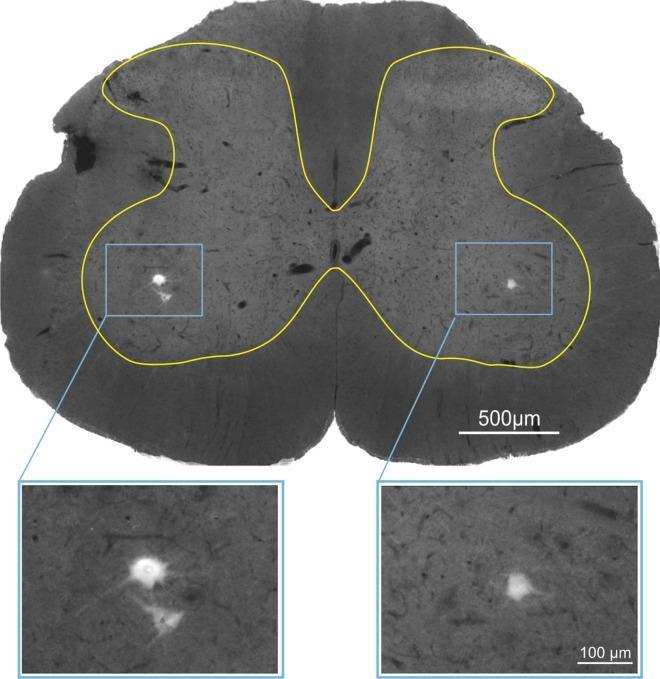
This diagnostic image shows a cross-sectional view of the L5 spinal cord segment, typical for neuroanatomical research. The section displays the characteristic butterfly-shaped central grey matter, demarcated by a yellow border, surrounded by peripheral white matter. The image demonstrates retrograde tracing of alpha-motoneurons (α-MNs) using True Blue fluorescence tracer, which was injected into the lateral gastrocnemius (LG) muscle. Two blue rectangular frames in the ventral horns highlight the bilateral distribution of labeled motoneurons. Below the main section, magnified inset views (100 µm scale) reveal the detailed morphology of these motoneurons, characterized by bright, fluorescent somata against a dark background, showing irregular polygonal shapes and emerging cellular processes. These α-motoneurons are essential components of the lower motor neuron system, and their visualization allows for the study of synaptic connectivity, such as glutamatergic VGLUT1 and cholinergic VAChT terminal density. The main section includes a 500 µm scale bar for anatomical orientation. This material is designed for advanced neuroanatomy and physiology education, focusing on spinal cord circuitry and motor unit innervation.
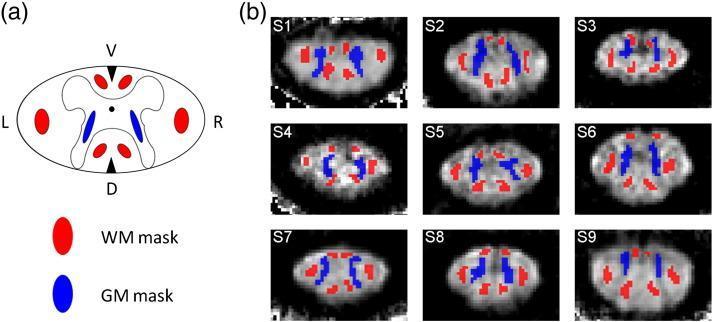
This medical visual consists of two parts: an anatomical diagram and a series of diagnostic images demonstrating spinal cord segmentation. Panel (a) is a schematic cross-section of the cervical spinal cord illustrating the segmentation protocol. Red regions of interest (ROIs) define the White Matter (WM) masks, located in the dorsal (D), ventral (V), and bilateral lateral (L, R) funiculi. Blue ROIs define the Grey Matter (GM) masks, positioned within the characteristic central 'butterfly' structure. Panel (b) presents Fractional Anisotropy (FA) maps derived from Diffusion Tensor Imaging (DTI) for nine human subjects (S1–S9). Each grayscale axial map is overlaid with the manually defined GM (blue) and WM (red) masks. The images demonstrate the variability in spinal cord morphology and pixel intensity across different individuals. The educational focus is on the localization of specific neural tracts and the application of quantitative MRI metrics to differentiate between spinal cord substructures. This material is relevant for neuroimaging research and the clinical assessment of pathologies like multiple sclerosis or spinal cord injury.
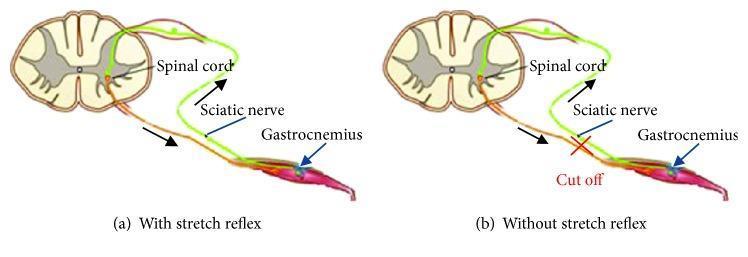
Anatomical diagrams illustrating the components of the monosynaptic stretch reflex arc in two experimental states. Both panels show a transverse section of the spinal cord (white and gray matter) connected to the gastrocnemius muscle via the sciatic nerve. Panel (a), labeled 'With stretch reflex', depicts an intact neural circuit: a sensory (afferent) pathway, colored green, carries signals from the muscle spindle to the dorsal horn, while a motor (efferent) pathway, colored orange/brown, carries impulses from the ventral horn back to the muscle. Black arrows indicate the direction of signal flow. Panel (b), labeled 'Without stretch reflex', demonstrates a disrupted circuit where the sciatic nerve has been severed, indicated by a red 'X' and the text 'Cut off'. This visualization highlights how the interruption of the peripheral nerve abolishes the reflex arc between the spinal cord and the effector muscle, commonly used in physiological studies to compare muscle response forces with and without neural feedback.
blood brain barrier structure astrocyte endothelium
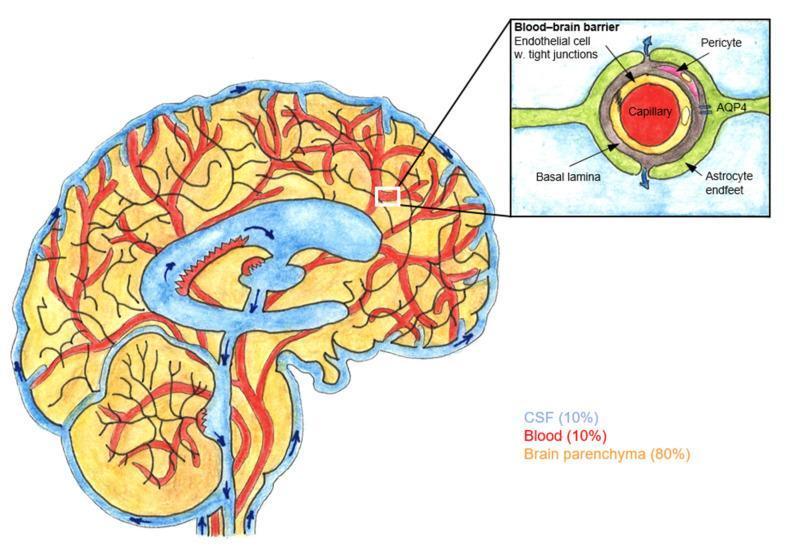
This pathophysiology diagram illustrates the glymphatic pathway and the structure of the blood-brain barrier (BBB) within the human brain. The main image shows a mid-sagittal section of the brain, color-coded to represent volume distribution: brain parenchyma (yellow, 80%), blood vessels (red, 10%), and cerebrospinal fluid (blue, 10%). Blue arrows indicate CSF flow from the subarachnoid space into the ventricles and along perivascular spaces. An inset provides a magnified cross-section of the BBB surrounding a central capillary. Key anatomical components identified in the inset include the endothelial cell layer with tight junctions, the basal lamina, and embedded pericytes. The outer layer consists of astrocyte endfeet, which are explicitly labeled as expressing aquaporin 4 (AQP4) water channels. The diagram demonstrates the physiological relationship between the vascular system and CSF movement, highlighting the cellular interface responsible for fluid transport and metabolic waste clearance in the central nervous system.
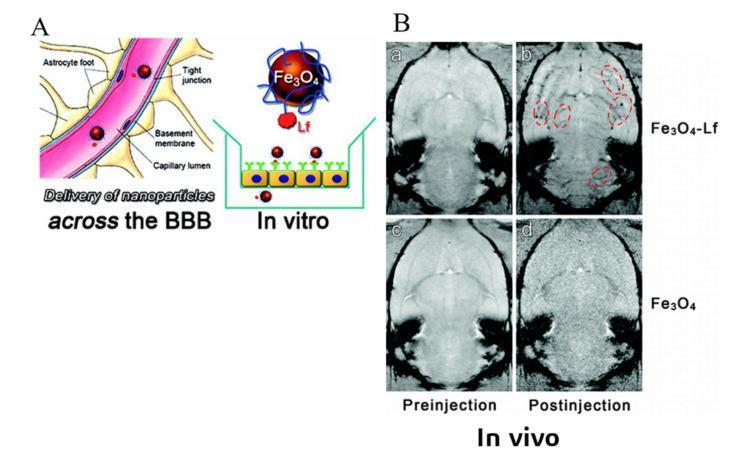
Educational composite figure demonstrating targeted drug delivery across the blood-brain barrier (BBB). Part A consists of a pathophysiology diagram and an in vitro model illustration. The diagram depicts the BBB structure, including astrocyte feet, tight junctions, the basement membrane, and the capillary lumen. Adjacent is a schematic of lactoferrin (Lf)-functionalized Fe3O4 magnetic nanoparticles interacting with receptors for transcytosis. Part B displays in vivo diagnostic imaging using axial T2* Magnetic Resonance Imaging (MRI) of rat brains. The images compare contrast enhancement between Fe3O4-Lf and non-functionalized Fe3O4 groups at pre-injection and 15-minute post-injection intervals. In the Fe3O4-Lf post-injection scan (image b), several brain blood vessels are highlighted with red dashed circles, showing significant signal darkening (hypointensity) due to the T2* shortening effect of the accumulated iron oxide nanoparticles. In contrast, the post-injection image for the bare Fe3O4 group (image d) lacks specific vascular enhancement, illustrating the efficacy of Lf-tagging for receptor-mediated transport across the BBB into the central nervous system.
EEG brain waves sleep wake cycle consciousness
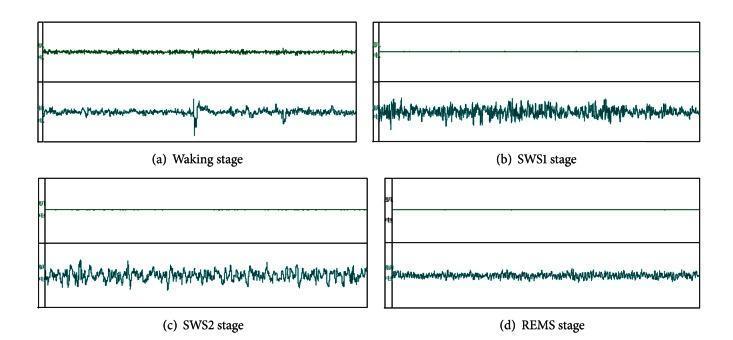
This diagnostic comparison chart displays four panels of synchronized Electromyography (EMG) and Electroencephalography (EEG) tracings, illustrating different physiological states in a sleep-wake cycle. The panels represent: (a) Waking stage, (b) Slow-Wave Sleep 1 (SWS1), (c) Slow-Wave Sleep 2 (SWS2), and (d) Rapid Eye Movement Sleep (REMS). Each panel contains an EMG trace in the upper half and an EEG trace in the lower half. In the Waking stage, the EMG shows moderate tonic activity while the EEG is relatively low-amplitude. Transitions into SWS1 and SWS2 demonstrate a progressive increase in EEG amplitude and irregularity, characterized by higher voltage and slower waves (peaks and valleys), while the EMG maintains some activity. The REMS stage is marked by a distinctive EMG 'flatline' or muscle atonia (quiescence), contrasted with a desynchronized, lower-amplitude EEG signal. These visual biomarkers are critical for neurophysiological sleep staging, polysomnography research, and evaluating the effects of pharmacological interventions on sleep architecture and central nervous system activity.
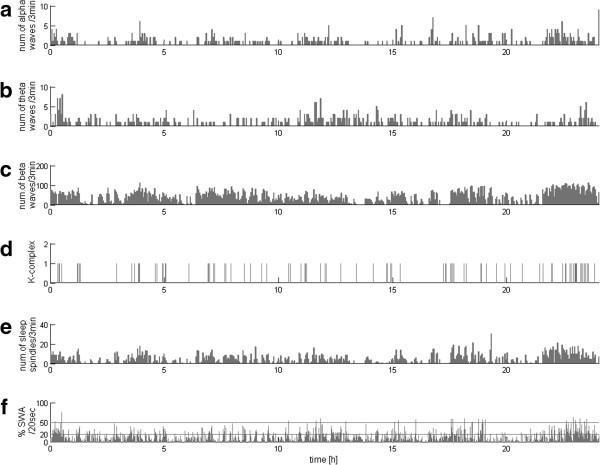
This diagnostic graphic illustrates a 24-hour continuous EEG monitoring profile of a patient, likely in a state of disordered consciousness. The data is presented in six stacked subplots (a-f) representing different EEG components over time (in hours). Subplots (a), (b), (c), and (e) quantify the number of alpha, theta, and beta waves, and sleep spindles per 3-minute epoch, respectively. Subplot (d) indicates discrete markers for K-complex occurrences. Subplot (f) displays the percentage of slow-wave activity (SWA) per 20-second epoch, with horizontal thresholds at 20% and 50% corresponding to classical criteria for sleep stages 3 and 4. The profile demonstrates a lack of normal circadian rhythm, characterized by the absence of nocturnal concentration of sleep spindles and slow waves. There is no clear inverse correlation between sleep spindles and SWA, suggesting an atypical sleep-wake architecture. This method of continuous parametric assessment provides educational value in distinguishing between vegetative states (UWS) and minimally conscious states (MCS) through objective temporal analysis of electroencephalographic features.
CNS Physiology: Complete Chapter — Basic to Advanced
PART 1: ORGANIZATION OF THE NERVOUS SYSTEM
1.1 Overview and Divisions
| Division | Components |
|---|---|
| Central Nervous System (CNS) | Brain + Spinal Cord |
| Peripheral Nervous System (PNS) | Cranial nerves, spinal nerves, ganglia |
| Autonomic Nervous System (ANS) | Sympathetic + Parasympathetic + Enteric |
| Somatic Nervous System | Voluntary motor + sensory |
1.2 The Neuron - Structural and Functional Unit
- Dendrites - receive signals from other neurons (input zone)
- Cell body (soma) - contains nucleus, metabolic center
- Axon hillock - where action potentials are initiated (trigger zone)
- Axon terminals - release neurotransmitters (output zone)
- Sensory (afferent) - carry information toward CNS
- Motor (efferent) - carry commands away from CNS
- Interneurons - connect neurons within CNS (99% of all neurons)
| Cell | Location | Function |
|---|---|---|
| Astrocytes | CNS | Structural support, BBB, K+ buffering, synaptic modulation |
| Oligodendrocytes | CNS | Myelinate CNS axons (each myelinates up to 40 axons) |
| Schwann cells | PNS | Myelinate PNS axons (one cell per axon segment) |
| Microglia | CNS | Immune surveillance (resident macrophages of CNS) |
| Ependymal cells | Ventricles | Line ventricles, produce and circulate CSF |
PART 2: MEMBRANE PHYSIOLOGY AND RESTING POTENTIAL
2.1 Ion Distribution Across the Neuronal Membrane
| Ion | Intracellular (mEq/L) | Extracellular (mEq/L) | Nernst Potential |
|---|---|---|---|
| K+ | 140 | 4 | -94 mV |
| Na+ | 14 | 142 | +61 mV |
| Cl- | 4 | 107 | -86 mV |
| Ca2+ | 0.0001 | 1.2 | +123 mV |
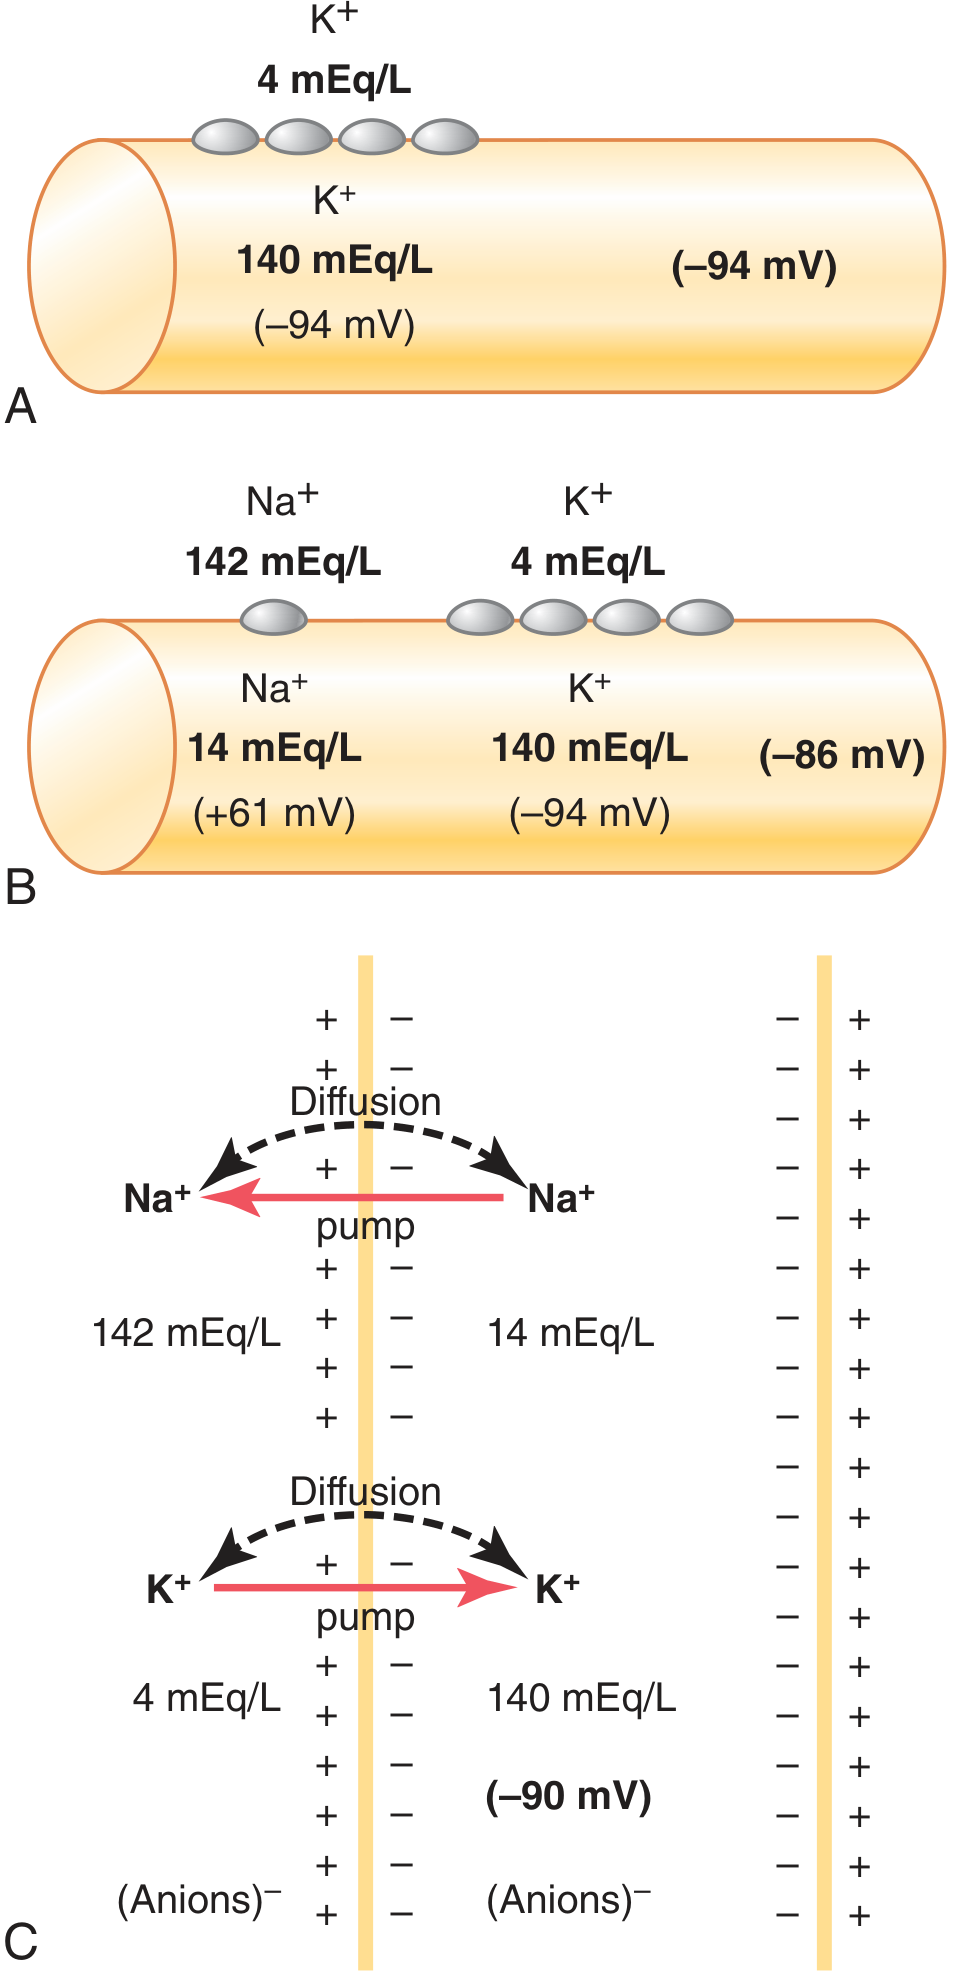
- K+ diffusion - membrane at rest is ~100x more permeable to K+ than Na+. K+ leaks out down its concentration gradient, leaving behind negative intracellular charges. This is the dominant factor (-94 mV if K+ alone).
- Na+ diffusion - small inward Na+ leak moves potential toward +61 mV, partially opposing K+ effects. Net result with both ions is about -86 mV (Goldman equation).
- Na+-K+ ATPase pump - electrogenic pump expels 3 Na+ for every 2 K+ taken in. This creates net negativity of approximately -4 mV more, bringing resting potential to approximately -90 mV.
- Guyton and Hall, p. 79
PART 3: ACTION POTENTIAL
3.1 The Action Potential - Stages
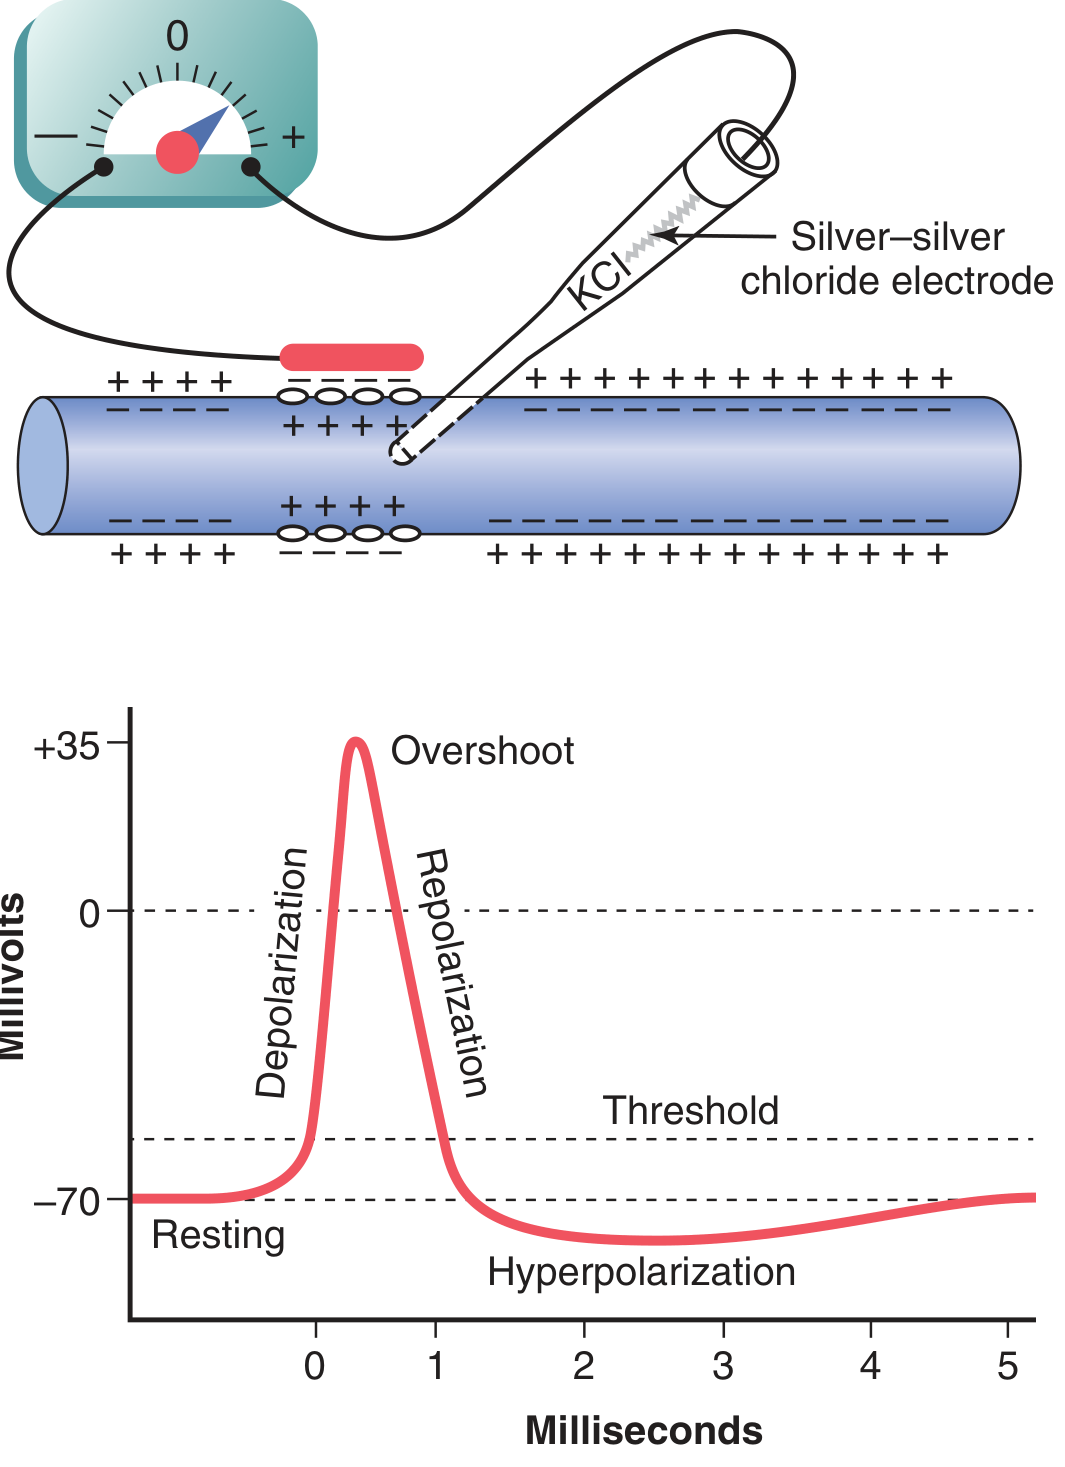
-
Resting Stage: Membrane at -70 mV. Polarized. Na+ channels closed (inactivation gates open, activation gates closed).
-
Depolarization Stage: A stimulus depolarizes the membrane to threshold (~-55 mV). Voltage-gated Na+ channels open explosively - activation gates open rapidly. Na+ rushes in down its electrochemical gradient. Membrane potential rapidly rises to approximately +35 mV (overshoot).
-
Repolarization Stage: Within <1 ms, Na+ channels begin inactivating (inactivation gates close). Voltage-gated K+ channels (slower to open) now open fully. K+ rushes out, restoring negative interior. Membrane potential returns toward resting.
-
Hyperpolarization (Undershoot): K+ channels stay open slightly longer than needed. Membrane transiently overshoots the resting potential (-80 to -90 mV). Called the after-hyperpolarization or undershoot.
- Guyton and Hall, p. 80
3.2 Voltage-Gated Channels
- Has two gates: activation gate (rapid, opens at threshold) and inactivation gate (slow, closes during sustained depolarization)
- Three states: closed (resting), open (activated), inactivated
- Tetrodotoxin (TTX) and local anesthetics block these channels
- Has single activation gate, opens slowly at depolarization
- Tetraethylammonium (TEA) blocks these channels
3.3 All-or-None Law
3.4 Refractory Periods
| Period | Duration | Mechanism | Significance |
|---|---|---|---|
| Absolute refractory | ~1 ms | Na+ channels inactivated, cannot reopen | No second AP possible; limits firing frequency |
| Relative refractory | ~5-15 ms | Na+ channels recovering + K+ channels still open | Second AP requires stronger-than-normal stimulus |
3.5 Propagation and Conduction Velocity
- Axon diameter (larger = faster): Large fibers can be up to 120 m/s (Aα fibers)
- Myelination (saltatory conduction): Action potential "jumps" between nodes of Ranvier instead of conducting continuously. Much faster and energy-efficient.
| Fiber Type | Diameter | Myelination | Speed | Function |
|---|---|---|---|---|
| Aα | 12-20 µm | Heavy | 70-120 m/s | Skeletal motor, proprioception |
| Aβ | 5-12 µm | Heavy | 30-70 m/s | Touch, pressure |
| Aγ | 3-6 µm | Moderate | 15-30 m/s | Muscle spindle efferents |
| Aδ | 1-5 µm | Thin | 5-30 m/s | Pain (sharp), temperature (cold) |
| B | 1-3 µm | Light | 3-15 m/s | Preganglionic autonomic |
| C | 0.2-1.5 µm | None | 0.5-2 m/s | Pain (aching), temperature (warm), postganglionic autonomic |
PART 4: SYNAPTIC TRANSMISSION
4.1 Types of Synapses
- Direct cytoplasmic coupling via connexin proteins
- Bidirectional, instantaneous transmission
- Found in cardiac muscle, smooth muscle, some CNS areas (e.g., inferior olive, retina)
- Pre- and postsynaptic membranes separated by synaptic cleft (~20-40 nm)
- Neurotransmitter is released by exocytosis from presynaptic terminal
- One-directional (presynaptic → postsynaptic)
- Subject to modulation, amplification, and pharmacological intervention
4.2 Steps in Chemical Synaptic Transmission
- Action potential arrives at presynaptic terminal
- Depolarization opens voltage-gated Ca2+ channels (N-type and P/Q-type)
- Ca2+ influx triggers SNARE protein complex-mediated vesicle fusion
- Neurotransmitter released into synaptic cleft by exocytosis
- Neurotransmitter binds postsynaptic receptors
- Receptor activation opens ion channels or activates second messengers
- Neurotransmitter cleared by:
- Reuptake into presynaptic terminal (e.g., dopamine, serotonin, norepinephrine)
- Enzymatic degradation in cleft (e.g., AChE cleaves acetylcholine)
- Diffusion away from cleft
4.3 Postsynaptic Potentials
- Neurotransmitter opens channels permeable to Na+ and K+ (e.g., AMPA receptors for glutamate)
- Net effect: depolarization toward threshold
- Spatial and temporal summation required to reach threshold and fire AP
- Neurotransmitter opens Cl- channels (e.g., GABA-A receptor) or K+ channels (e.g., GABA-B receptor)
- Cl- entry (hyperpolarization) or K+ exit (hyperpolarization) - moves membrane away from threshold
- GABA is the main inhibitory NT in brain; Glycine in spinal cord
4.4 Major Neurotransmitters
| Neurotransmitter | Synthesis | Receptors | Function | Clinical Note |
|---|---|---|---|---|
| Acetylcholine (ACh) | Choline + acetyl-CoA (ChAT) | Nicotinic (ionotropic), Muscarinic (metabotropic) | Neuromuscular junction, ANS ganglia, parasympathetic, basal ganglia | Myasthenia gravis (anti-AChR Ab); Alzheimer's (ACh deficiency) |
| Glutamate | From Krebs cycle | AMPA, NMDA, Kainate (ionotropic); mGluR (metabotropic) | Main excitatory NT in CNS; learning/memory (LTP) | Excitotoxicity in stroke/epilepsy |
| GABA | Glutamate → GABA (GAD) | GABA-A (Cl- channel), GABA-B (K+ channel/GPCR) | Main inhibitory NT in brain | Benzodiazepines, barbiturates enhance GABA-A |
| Glycine | Serine | GlyR (Cl- channel) | Inhibitory NT in spinal cord, brainstem | Strychnine blocks GlyR → tetanic convulsions |
| Dopamine (DA) | Tyrosine → L-DOPA → DA | D1-D5 (all GPCRs) | Reward, movement (nigrostriatal), cognition | Parkinson's (↓DA); schizophrenia (↑DA hypothesis) |
| Norepinephrine (NE) | DA → NE | α1, α2, β1, β2 (GPCRs) | Arousal, attention, fight-or-flight | TCAs, SNRIs block NE reuptake |
| Serotonin (5-HT) | Tryptophan → 5-HT | 5-HT1-7 (most GPCRs, 5-HT3 ionotropic) | Mood, sleep, appetite | SSRIs used in depression |
| Histamine | Histidine | H1, H2, H3 (GPCRs) | Arousal, wakefulness | H1 antihistamines → sedation |
| Endorphins/Enkephalins | Pre-proopiomelanocortin (POMC) | μ, κ, δ opioid receptors | Pain modulation (analgesia), reward | Opioid analgesics mimic these |
| Substance P | Prepro-substance P gene | NK1 receptor (GPCR) | Pain transmission | SP antagonists as analgesics |
| Nitric Oxide (NO) | Arginine → NO (NOS) | Diffusible, activates guanylyl cyclase | Retrograde messenger at synapses, vasodilation | Important in LTP |
4.5 Synaptic Plasticity
- Facilitation: Repeated stimulation → more Ca2+ accumulates → more neurotransmitter released
- Depression: Vesicle depletion with repeated stimulation → decreased release
- Long-Term Potentiation (LTP): Persistent strengthening of synapses. Requires co-activation of pre and postsynaptic neurons (Hebbian plasticity). Key mechanism involves NMDA receptors (require simultaneous glutamate binding AND depolarization to remove Mg2+ block) → Ca2+ influx → PKC/CaMKII activation → AMPA receptor insertion → strengthened synapse.
- Long-Term Depression (LTD): Persistent weakening. Involves AMPA receptor removal.
PART 5: SPINAL CORD
5.1 Cross-Sectional Organization
- Dorsal horn: Receives sensory input; contains interneurons processing pain, temperature, touch
- Lateral horn (T1-L2 and S2-S4 only): Preganglionic sympathetic and parasympathetic neurons
- Ventral horn: Contains alpha and gamma motor neurons controlling skeletal muscle
| Tract | Location | Direction | Function |
|---|---|---|---|
| Dorsal columns (Gracile + Cuneate fasciculi) | Posterior | Ascending | Fine touch, vibration, proprioception (ipsilateral) |
| Spinothalamic tract | Anterolateral | Ascending | Pain, temperature (contralateral; crosses within 1-2 levels) |
| Spinocerebellar tract | Lateral | Ascending | Unconscious proprioception to cerebellum |
| Corticospinal (pyramidal) tract | Lateral/anterior | Descending | Voluntary motor control |
| Reticulospinal, Rubrospinal, Vestibulospinal | Anterior/lateral | Descending | Muscle tone, posture, balance |
5.2 Spinal Reflexes
- Tapping patellar tendon stretches muscle → activates Ia afferents from muscle spindles → directly excites alpha motor neurons in same segment → muscle contracts
- Clinically tests spinal cord integrity at specific levels (e.g., patellar = L3-L4; Achilles = S1-S2)
- Ib afferents from Golgi tendon organs signal excessive tension → inhibit agonist motor neurons, excite antagonist motor neurons
- Protective reflex preventing tendon/muscle rupture
- Painful stimulus → Aδ/C afferents → flexion of ipsilateral limb (withdrawal) + extension of contralateral limb (crossed extensor reflex) to maintain balance
- Polysynaptic
- During any reflex, agonist muscle contraction is accompanied by inhibition of the antagonist muscle via interneurons (Ia inhibitory interneurons). This is Sherrington's law of reciprocal innervation.
- Lie in parallel with extrafusal muscle fibers
- Nuclear bag (Ia, dynamic) + nuclear chain (II, static) fibers
- Gamma motor neurons adjust spindle sensitivity during voluntary contraction (alpha-gamma coactivation)
PART 6: BRAIN STEM
6.1 Medulla Oblongata
- Cardiovascular center - controls heart rate and vasomotor tone (via sympathetic and vagal outflow)
- Respiratory center (Pre-Bötzinger complex, DRG, VRG) - automatic breathing rhythm
- Swallowing center
- Vomiting center - chemoreceptor trigger zone (CTZ) in area postrema
- Cranial nerves IX, X, XI, XII originate here
6.2 Pons
- Contains pneumotaxic and apneustic centers (fine-tune breathing rhythm)
- Cranial nerves V, VI, VII, VIII originate here
- Pontine reticular formation - part of ARAS (arousal)
6.3 Midbrain (Mesencephalon)
- Superior colliculus - visual reflexes (eye movements toward stimuli)
- Inferior colliculus - auditory reflex pathways
- Red nucleus - rubrospinal tract (motor control, especially upper limbs)
- Substantia nigra - dopaminergic neurons projecting to striatum (nigrostriatal pathway); involved in motor planning
- Periaqueductal gray (PAG) - pain modulation, endogenous opioid system
- Cranial nerves III, IV originate here
6.4 Reticular Formation and ARAS
- Arousal and consciousness (Ascending Reticular Activating System - ARAS)
- Sleep-wake cycles
- Muscle tone modulation
- Autonomic function
PART 7: CEREBELLUM
7.1 Structure
| Division | Input | Function |
|---|---|---|
| Vestibulocerebellum (flocculonodular lobe) | Vestibular apparatus | Balance, eye movements, equilibrium |
| Spinocerebellum (vermis + paravermis) | Spinal cord (proprioception) | Gait coordination, limb movement correction |
| Cerebrocerebellum (lateral hemispheres) | Cerebral cortex (via pons) | Planning, timing, and learning motor sequences |
7.2 Neuronal Circuitry
- Purkinje cells - large GABAergic inhibitory output neurons of cerebellar cortex → project to deep cerebellar nuclei (inhibitory)
- Granule cells - excitatory, receive mossy fiber input; form parallel fibers
- Mossy fibers - input from spinal cord, pons; excite granule cells and deep nuclei
- Climbing fibers - from inferior olive; one-to-one with Purkinje cells; carry error signals for motor learning; powerful influence on Purkinje cell activity
- Deep cerebellar nuclei (dentate, interposed, fastigial) - final output of cerebellum; all excitatory
7.3 Cerebellar Function
- Ataxia - uncoordinated movement
- Dysmetria - inability to judge distance (past-pointing, undershooting)
- Intention tremor - tremor during purposeful movement (worse as approaching target)
- Dysdiadochokinesia - inability to perform rapid alternating movements
- Scanning speech - slurred, irregular cadence
- Nystagmus - with vestibulocerebellar lesions
- Hypotonia - decreased muscle tone
PART 8: THALAMUS AND BASAL GANGLIA
8.1 Thalamus - the Gateway to Cortex
| Nucleus | Relay | Cortical projection |
|---|---|---|
| VPL (Ventral postero-lateral) | Somatosensory from body | S1 cortex |
| VPM (Ventral postero-medial) | Somatosensory from face | S1 cortex |
| LGN (Lateral geniculate) | Visual | V1 (occipital cortex) |
| MGN (Medial geniculate) | Auditory | A1 (temporal cortex) |
| VL (Ventro-lateral) | Cerebellar output | Motor cortex |
| VA (Ventro-anterior) | Basal ganglia output | Premotor cortex |
| Pulvinar | Visual association | Parieto-occipital cortex |
| Intralaminar nuclei | Reticular formation | Diffuse cortical arousal |
8.2 Basal Ganglia
| Pathway | Circuit | Net Effect |
|---|---|---|
| Direct | Cortex → Striatum → GPi/SNr (inhibit) → Thalamus disinhibited → Cortex excited | Facilitates desired movement |
| Indirect | Cortex → Striatum → GPe (inhibit) → STN disinhibited → GPi/SNr excited → Thalamus inhibited → Cortex suppressed | Suppresses competing movements |
- Parkinson's disease - loss of SNc dopaminergic neurons → imbalance toward indirect pathway → bradykinesia, rigidity, resting tremor (pill-rolling), postural instability
- Huntington's disease - loss of striatal neurons (especially indirect pathway interneurons initially) → chorea (involuntary, jerky movements)
- Hemiballismus - subthalamic nucleus lesion → wild flinging movements of contralateral limbs
PART 9: CEREBRAL CORTEX
9.1 Structural Organization
| Layer | Name | Key Connections |
|---|---|---|
| I | Molecular | Horizontal connections, dendrites from deep layers |
| II | External granular | Sends axons to other cortical areas |
| III | External pyramidal | Corticocortical connections (ipsi + contralateral) |
| IV | Internal granular | Receives thalamic input (most prominent in sensory cortices) |
| V | Internal pyramidal | Long projection axons (to spinal cord, brainstem) - Betz cells in M1 |
| VI | Multiform (fusiform) | Reciprocal connections with thalamus |
9.2 Functional Areas
- Controls fine voluntary movements (especially digits, face, tongue)
- Organized as a motor homunculus - somatotopic map of the body. Disproportionately large areas represent hand, face, lips (areas requiring fine control)
- Betz cells (giant pyramidal neurons in layer V) send axons down the corticospinal tract
- Upper motor neuron (UMN) lesions → contralateral spastic paralysis, hyperreflexia, positive Babinski
- Receives somatosensory information from contralateral body
- Sensory homunculus - lips, tongue, and hands have largest representation
- Organized by modality (BA 3a: proprioception; BA 3b: discriminative touch; BA 1: texture; BA 2: size/shape)
- Receives input from LGN (ipsilateral LGN receives from both eyes)
- Organized in ocular dominance columns and orientation columns
- Retinotopic map: macula (central vision) has disproportionately large representation
- Tonotopic map (frequency organized)
- Input from contralateral ear predominates (via MGN)
- Plan and program movement sequences
- Supplementary motor area (SMA): internally generated movements, sequential tasks, bimanual coordination
- Premotor cortex: externally cued movements
- Broca's area (BA 44, 45) - inferior frontal gyrus, usually left hemisphere: motor speech production. Lesion → Broca's (expressive) aphasia - understands but cannot speak fluently; non-fluent, telegraphic speech
- Wernicke's area (BA 22) - posterior superior temporal gyrus, left hemisphere: language comprehension. Lesion → Wernicke's (receptive) aphasia - fluent but nonsensical speech; poor comprehension
- Arcuate fasciculus - connects Wernicke's to Broca's. Lesion → Conduction aphasia - cannot repeat, but comprehension and fluency preserved
9.3 Corticospinal (Pyramidal) Tract
- Upper motor neurons originate in M1 (and premotor, SMA, S1)
- Axons descend through the internal capsule (posterior limb)
- Pass through cerebral peduncles (midbrain)
- 85-90% cross in pyramidal decussation at medulla-spinal cord junction
- Form lateral corticospinal tract → synapse on alpha motor neurons in ventral horn
- 10-15% uncrossed → anterior corticospinal tract (axial muscles)
| Feature | UMN Lesion | LMN Lesion |
|---|---|---|
| Weakness | Contralateral | Ipsilateral |
| Tone | Increased (spasticity) | Decreased (flaccidity) |
| Reflexes | Hyperreflexia | Hyporeflexia/absent |
| Babinski sign | Positive (extension of big toe) | Negative |
| Atrophy | Mild (disuse) | Severe (denervation) |
| Fasciculations | Absent | Present |
PART 10: SENSORY SYSTEMS
10.1 Somatosensory Pathways
- First-order neuron: dorsal root ganglion → ipsilateral dorsal column (ascends)
- Synapse in medulla (nucleus gracilis/cuneatus) → second-order neuron crosses (internal arcuate fibers) → medial lemniscus
- Ascends to VPL thalamus → third-order neuron → S1 cortex
- First-order neuron enters spinal cord → crosses within 1-2 spinal segments via anterior white commissure
- Second-order neuron ascends in contralateral anterolateral column → VPL thalamus
- Third-order neuron → S1 cortex
10.2 Pain Physiology
- Mechanical injury (Aδ fibers - sharp, fast pain)
- Thermal extremes (Aδ and C fibers)
- Chemical stimuli: bradykinin, substance P, H+, K+, prostaglandins (C fibers - slow, aching, burning pain)
- Large myelinated fibers (Aβ) activate inhibitory interneurons in substantia gelatinosa → "close the gate" → reduce pain signal transmission
- Explains why rubbing an injured area reduces pain
- PAG → Nucleus raphe magnus → dorsal horn
- Releases enkephalins, serotonin, norepinephrine → presynaptically inhibit pain transmission
- Endogenous opioids act on μ, κ, δ receptors at multiple levels
10.3 Proprioception
- Muscle spindles (Ia, II afferents) → signal muscle length and rate of length change
- Golgi tendon organs (Ib afferents) → signal muscle tension
- Joint receptors → signal joint angle and movement
- Conscious proprioception → dorsal columns → VPL → S1 cortex
- Unconscious proprioception → spinocerebellar tracts → cerebellum
PART 11: MOTOR SYSTEMS
11.1 Motor Hierarchy
Cerebral Cortex (M1, Premotor, SMA)
        ↓
Brainstem (reticulospinal, vestibulospinal, rubrospinal)
        ↓
Spinal Cord interneurons
        ↓
Alpha Motor Neurons (Lower Motor Neurons - "final common pathway")
        ↓
Neuromuscular Junction
        ↓
Skeletal Muscle
11.2 Neuromuscular Junction
- AP arrives at motor nerve terminal
- Voltage-gated Ca2+ channels open
- Ca2+ triggers ACh vesicle exocytosis
- ACh binds nicotinic ACh receptors (nAChR) at motor end plate
- Na+ influx → end plate potential (EPP) → action potential in muscle
- AChE rapidly degrades ACh in cleft
- Myasthenia gravis - autoantibodies against nAChR → fatigable weakness
- Lambert-Eaton syndrome - autoantibodies against presynaptic Ca2+ channels → proximal weakness (improves with repetition)
- Botulinum toxin - cleaves SNARE proteins → prevents ACh release → flaccid paralysis
PART 12: AUTONOMIC NERVOUS SYSTEM
12.1 Comparison of Sympathetic vs Parasympathetic
| Feature | Sympathetic | Parasympathetic |
|---|---|---|
| Origin | Thoracolumbar (T1-L2) | Craniosacral (CN III, VII, IX, X; S2-S4) |
| Ganglia location | Paravertebral/prevertebral (close to spinal cord) | Terminal ganglia (close to/in target organ) |
| Preganglionic fiber | Short, myelinated | Long, myelinated |
| Postganglionic fiber | Long, unmyelinated | Short, unmyelinated |
| Preganglionic NT | ACh (nicotinic) | ACh (nicotinic) |
| Postganglionic NT | NE (adrenergic) | ACh (muscarinic) |
| Exception | Sweat glands, adrenal medulla: ACh | - |
| Overall effect | "Fight or flight" (sympathomimetic) | "Rest and digest" |
12.2 Autonomic Receptors and Effects
| Receptor | Location | Effect | Second Messenger |
|---|---|---|---|
| α1 | Vascular smooth muscle, bladder | Vasoconstriction, bladder contraction | Gq → IP3/DAG |
| α2 | Presynaptic terminals, pancreatic β cells | ↓ NE release, ↓ insulin secretion | Gi → ↓ cAMP |
| β1 | Heart, kidney (JGA) | ↑ HR, ↑ contractility, ↑ renin | Gs → ↑ cAMP |
| β2 | Bronchi, vascular smooth muscle, uterus | Bronchodilation, vasodilation | Gs → ↑ cAMP |
| β3 | Adipose tissue, bladder | Lipolysis, bladder relaxation | Gs → ↑ cAMP |
| Receptor | Location | Effect |
|---|---|---|
| M1 | Brain, gastric glands | ↑ Gastric acid, CNS effects |
| M2 | Heart (SA/AV nodes) | ↓ HR, ↓ conduction velocity |
| M3 | Smooth muscle, glands, eye | Bronchoconstriction, ↑ secretions, miosis, urination |
12.3 Sympathetic "Fight or Flight" Response
- ↑ HR and cardiac output
- Vasoconstriction in skin and gut (blood to muscles)
- Bronchodilation
- Pupil dilation (mydriasis)
- Glycogenolysis + gluconeogenesis → ↑ blood glucose
- ↑ Sweating
- ↓ GI motility and secretions
- Adrenal medulla releases epinephrine (80%) and norepinephrine (20%) → reinforces response
PART 13: HIGHER BRAIN FUNCTIONS
13.1 Limbic System
- Hippocampus - formation of new declarative memories (episodic + semantic). Bilateral lesion → anterograde amnesia (cannot form new memories; old memories intact). Papez circuit.
- Amygdala - emotional processing, especially fear conditioning. Generates emotional responses to stimuli (autonomic + behavioral fear response). Bilateral lesion → Kluver-Bucy syndrome (placidity, hypersexuality, visual agnosia, hyperphagia)
- Hypothalamus - links limbic system to autonomic and endocrine systems; controls temperature, hunger, thirst, circadian rhythms, sexual behavior
13.2 Hypothalamus
| Nucleus/Region | Function |
|---|---|
| Anterior hypothalamus | Heat dissipation (sweating, vasodilation), parasympathetic |
| Posterior hypothalamus | Heat conservation, sympathetic activation |
| Lateral area | Hunger (stimulates feeding); lesion → anorexia |
| Ventromedial nucleus (VMN) | Satiety center; lesion → hyperphagia, obesity |
| Supraoptic nucleus | ADH (vasopressin) synthesis → released from posterior pituitary |
| Paraventricular nucleus | Oxytocin synthesis; CRH release |
| Suprachiasmatic nucleus (SCN) | Circadian rhythm generator (biological clock) |
13.3 Sleep Physiology
| Stage | EEG Waves | Eye Movement | Muscle Tone | Features |
|---|---|---|---|---|
| Awake (alert) | Beta (>13 Hz, low amplitude) | Voluntary | Normal | |
| Awake (relaxed) | Alpha (8-13 Hz) | Voluntary | Normal | Eyes closed |
| NREM Stage 1 | Theta (4-8 Hz) | Slow rolling | Slight ↓ | Hypnic jerks possible |
| NREM Stage 2 | Theta + sleep spindles (12-14 Hz) + K-complexes | Absent | ↓ | |
| NREM Stage 3 | Delta (>50% delta waves, <4 Hz) | Absent | ↓↓ | Slow-wave/deep sleep; growth hormone release; sleepwalking, sleep terrors |
| REM | Beta-like (desynchronized) | Rapid conjugate | Atonia (except diaphragm, EOMs) | Vivid dreams; penile/clitoral erection; variable HR/BP |
- VLPO (ventrolateral preoptic area) - GABAergic; inhibits arousal centers → promotes sleep ("sleep switch")
- Norepinephrine (locus coeruleus), Serotonin (raphe), Histamine (tuberomammillary), Acetylcholine (BF), Orexin/hypocretin (lateral hypothalamus) → promote wakefulness
- Orexin deficiency → narcolepsy (sudden sleep attacks with cataplexy)
- REM sleep controlled by cholinergic activation; REM atonia mediated by glycine/GABA
13.4 Consciousness and Arousal
- Vegetative state - preserved sleep-wake cycle but no awareness
- Minimally conscious state - inconsistent but reproducible signs of awareness
- Brain death - irreversible cessation of all brain function including brainstem
PART 14: BLOOD-BRAIN BARRIER AND CSF
14.1 Blood-Brain Barrier (BBB)
- Brain capillary endothelial cells with tight junctions (occludins, claudins) - no fenestrations
- Basement membrane
- Pericytes - structural support, regulatory
- Astrocyte endfeet (express AQP4) - wrap around capillaries, regulate water/ion transport
- Freely: O2, CO2, small lipid-soluble molecules (ethanol, anesthetics, nicotine)
- Carrier-mediated: Glucose (GLUT1), amino acids, nucleosides
- Does NOT cross: Proteins, large molecules, most drugs, bile salts, ionized compounds
14.2 Cerebrospinal Fluid (CSF)
- Production: ~500 mL/day by choroid plexus of lateral, third, and fourth ventricles
- Volume in circulation: ~150 mL at any given time (70-150 mL normal range)
- Circulation: Lateral ventricles → Third ventricle (via foramina of Monro) → Fourth ventricle (via cerebral aqueduct) → Subarachnoid space (via foramina of Luschka and Magendie) → Absorbed at arachnoid granulations into dural venous sinuses
- Glymphatic system: Paraarteriolar CSF enters brain parenchyma via AQP4, flushes interstitial space, exits via paravenous channels - clears metabolic waste (including amyloid-beta during sleep)
| Parameter | Normal Range |
|---|---|
| Pressure | 70-180 mmH2O |
| Color | Clear, colorless |
| Cells | <5 WBC/mm3 (lymphocytes) |
| Protein | 15-45 mg/dL |
| Glucose | 45-75 mg/dL (60-70% of plasma glucose) |
| Chloride | 120-130 mEq/L |
PART 15: NEUROLOGICAL EXAM CORRELATIONS AND INTEGRATIVE CONCEPTS
15.1 Localization of Neurological Lesions
| Location | Signs |
|---|---|
| Cortex (frontal lobe) | Contralateral spastic hemiplegia, Broca's aphasia (left), behavioral changes |
| Internal capsule | Complete contralateral hemiplegia (face, arm, leg) |
| Brainstem | Ipsilateral cranial nerve + contralateral body signs (crossed signs) |
| Cerebellum | Ipsilateral ataxia, dysmetria, intention tremor |
| Spinal cord (Brown-Séquard) | Ipsilateral UMN signs + proprioception loss; contralateral pain + temperature loss below lesion |
| Peripheral nerve | LMN signs, dermatomal distribution |
15.2 Neuroplasticity
- Synaptic plasticity (LTP/LTD) - milliseconds to minutes
- Axonal sprouting - weeks
- Cortical remapping - months (e.g., motor cortex expansion in musicians)
- Adult neurogenesis - ongoing in hippocampal dentate gyrus (SGZ) and olfactory bulb (SVZ) - roles in learning and memory
Summary Diagram: CNS Integration
Sensory World
     ↓
Peripheral Sensory Receptors (skin, muscle, joints, organs)
     ↓
Spinal Cord / Brainstem  ←──────────────────────────┐
     ↓                                               │
Thalamus (relay + gating)                            │
     ↓                                               │
Cerebral Cortex                                      │
 ├─ S1 (somatosensory processing)                    │
 ├─ M1 (motor command)                               │
 ├─ Prefrontal (executive function, planning)        │
 └─ Association areas (integration, cognition)       │
           ↑↓                                        │
    Basal Ganglia ──→ (select/suppress programs) ────┤
           ↑↓                                        │
    Cerebellum ──→ (error correction, timing) ───────┤
           ↑↓                                        │
    Limbic System ──→ (emotion, memory, motivation)  │
           ↑↓                                        │
    Hypothalamus ──→ (homeostasis, ANS, endocrine)   │
           ↓                                         │
Motor Output → Spinal cord → Muscles ────────────────┘
Key Mnemonics and Clinical Pearls
| Concept | Mnemonic / Pearl |
|---|---|
| Fiber types | "A-B-C": Aα fastest, C slowest; Aδ = fast pain, C = slow pain |
| Resting potential | "K+ rules at rest; Na+ rules during action potential" |
| Decussation levels | Dorsal columns cross in medulla; spinothalamic crosses within 1-2 spinal segments |
| UMN vs LMN | UMN = Stiff (spasticity, hyperreflexia, Babinski+); LMN = Floppy (flaccid, fasciculations, atrophy) |
| Brown-Séquard | Ipsilateral motor + proprioception loss; contralateral pain + temp loss |
| Basal ganglia diseases | "Parkinson's = slow (bradykinesia), Huntington's = fast (chorea)" |
| Aphasia | Broca's = can't speak (motor area); Wernicke's = can't understand (sensory area) |
| Cerebellum | Lesion signs are IPSILATERAL (unlike cortex which is contralateral) |
| Sleep | "First to deep (delta), then to dream (REM)" |
| Hypothalamus | Lateral = hunger, Ventromedial = satiety ("Lean Lateral, Vast VMN") |