
Genesis of rmp
Reading File
RMP (Resting Membrane Potential) arises from the unequal distribution of ions across the cell membrane and the selective permeability of that membrane, primarily to K⁺ at rest. The typical value is around -70 mV in neurons and -90 mV in cardiac muscle.
Searching sources...
Finding Sources
Finding Sources
Reading File
Reading File
Reading File
Reading File
Loading Image
Loading Image
Here is a thorough explanation of the Genesis of Resting Membrane Potential (RMP) based on Guyton & Hall, Costanzo Physiology, and Ganong's.
Genesis of Resting Membrane Potential (RMP)
The RMP is the steady electrical potential difference across the cell membrane when the cell is not generating a signal. In neurons it is about -70 mV; in skeletal and cardiac muscle it is -90 mV (inside negative relative to outside).
Prerequisites for a Membrane Potential
Two conditions must be met for any membrane potential to exist (Ganong's Review of Medical Physiology):
- Unequal ion distribution across the membrane (a concentration gradient)
- Selective membrane permeability - the membrane must have ion channels permeable to those ions
Step 1 - The Na⁺-K⁺ ATPase Pump Creates the Ion Gradients
The Na⁺-K⁺ pump is the foundation. It actively transports:
- 3 Na⁺ OUT of the cell
- 2 K⁺ IN to the cell
This creates and maintains the following concentration gradients:
| Ion | Outside | Inside |
|---|---|---|
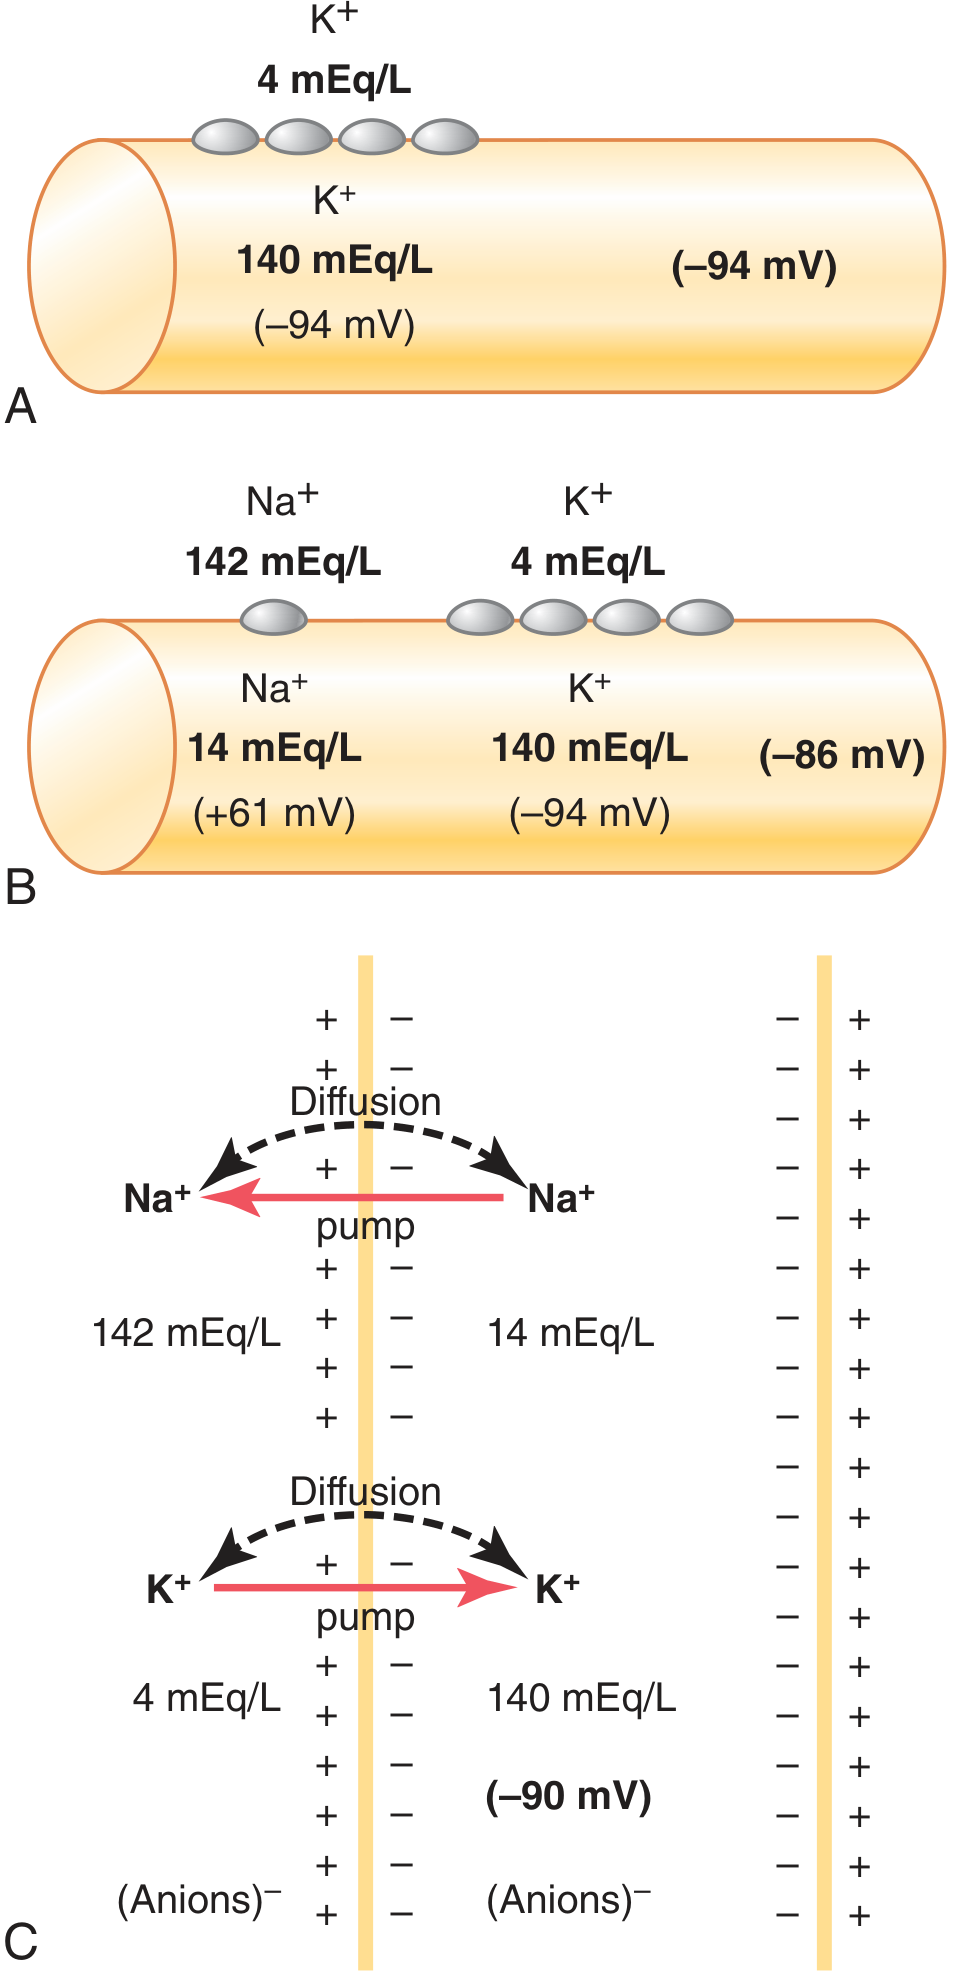
| Na⁺ | 142 mEq/L | 14 mEq/L |
| K⁺ | 4 mEq/L | 140 mEq/L |
The pump is also electrogenic - it pumps out more positive charges than it brings in, directly contributing about -4 mV of negativity to the inside.
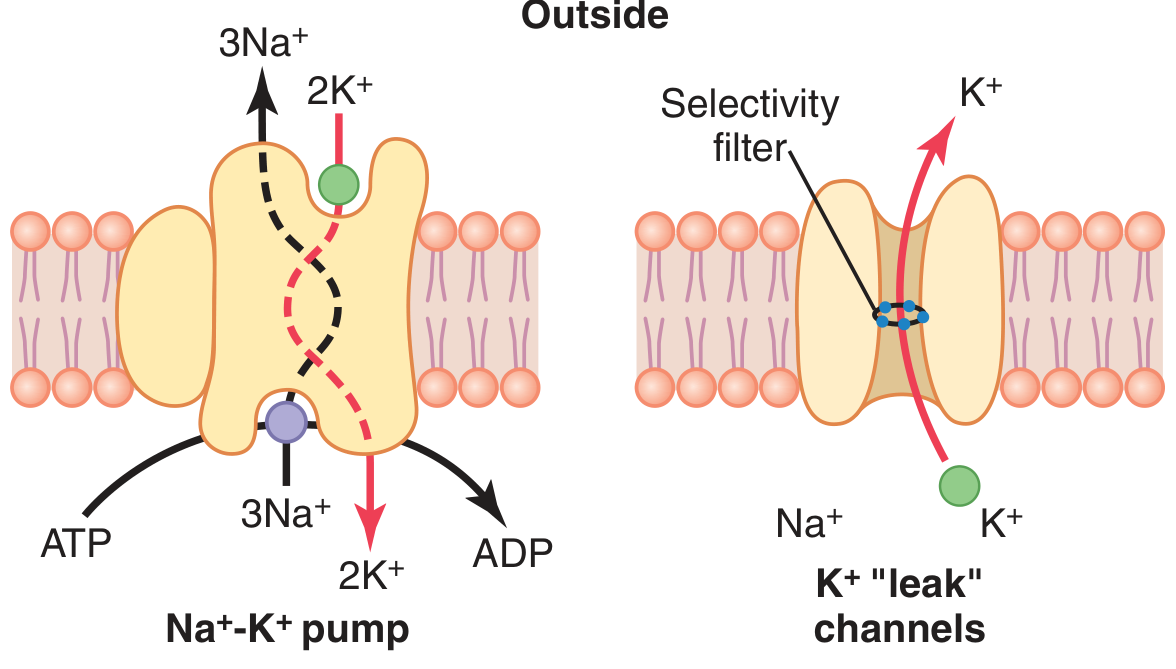
Step 2 - K⁺ Diffusion Dominates (The Major Contribution)
At rest, the membrane has many open K⁺ "leak" channels (tandem-pore domain channels / K2P channels) and very few open Na⁺ channels. The membrane is about 100 times more permeable to K⁺ than to Na⁺.
- K⁺ (inside 140 mEq/L) diffuses outward down its concentration gradient through leak channels.
- This movement of positive charge outward leaves excess negative charges inside.
- The resulting electrical gradient (inside negative) opposes further K⁺ efflux.
- At equilibrium for K⁺ alone, the Nernst potential = -94 mV (using a 35:1 K⁺ inside:outside ratio).
Step 3 - Small Na⁺ Diffusion Partially Offsets K⁺ Effect
A small amount of Na⁺ leaks inward through the same K⁺-Na⁺ leak channels (and a small number of Na⁺ channels). The Nernst potential for Na⁺ alone would be +61 mV. Because Na⁺ permeability is so low, it only partially depolarizes the membrane.
Using the Goldman-Hodgkin-Katz (GHK) equation, which weights each ion by its relative permeability:
Em = -86 mV (from K⁺ and Na⁺ diffusion combined)
Step 4 - Na⁺-K⁺ Pump Adds the Final Electrogenic Contribution
The continuously running pump adds an extra -4 mV due to its 3:2 unequal pumping stoichiometry.
Final RMP ≈ -90 mV (in nerve/muscle)
Summary Table of Contributors
| Factor | Contribution to RMP | Mechanism |
|---|---|---|
| K⁺ diffusion out (through leak channels) | Major (-94 mV if alone) | Concentration gradient; high K⁺ permeability at rest |
| Na⁺ diffusion in (slight) | Partially offsets K⁺; net ~-86 mV | Low permeability; inward Na⁺ leak |
| Na⁺-K⁺ ATPase (electrogenic direct effect) | Small additional ~-4 mV | Pumps 3 Na⁺ out for 2 K⁺ in |
| Na⁺-K⁺ ATPase (indirect - maintaining gradients) | Critical - sustains the above gradients indefinitely | Active transport against electrochemical gradients |
| Cl⁻ & organic anions (impermeant) | Also contribute via equilibrium | Large impermeant anions trapped inside |
Key Equations
Nernst Equation (for a single ion equilibrium potential):
E = -(61/z) × log [ion]inside / [ion]outside
Goldman (GHK) Equation (for multiple ions):
Em = -61 × log [ (PK[K⁺]i + PNa[Na⁺]i + PCl[Cl⁻]o) / (PK[K⁺]o + PNa[Na⁺]o + PCl[Cl⁻]i) ]
Chord Conductance Equation (Costanzo):
Em = (gK / gT)EK + (gNa / gT)ENa + (gCl / gT)ECl
Role of the Na⁺-K⁺ Pump - Two Distinct Contributions
As Costanzo Physiology emphasizes, the pump has two roles:
- Direct electrogenic contribution - small (-4 mV), due to unequal charge transport
- Indirect contribution - far more important; maintains the K⁺ concentration gradient that drives the K⁺ diffusion potential, which is the main determinant of the RMP
Without the pump running continuously, ion gradients would dissipate, and the RMP would eventually collapse.
Sources: Guyton and Hall Textbook of Medical Physiology (pp. 78-79), Costanzo Physiology 7th ed. (pp. 25-26), Ganong's Review of Medical Physiology 26th ed.
Enteric nervous system
The enteric nervous system (ENS) is the "second brain" - an intrinsic neural network embedded in the gut wall that can function independently of the CNS. It contains ~100 million neurons organized into two main plexuses: the myenteric (Auerbach's) plexus controlling motility, and the submucosal (Meissner's) plexus controlling secretion and absorption.
Searching sources...
Finding Sources
Reading File
Reading File
Reading File
Reading File
Finding Sources
Reading File
Reading File
Reading File
Finding Sources
Loading Image
Reading File
Loading Image
Here is a comprehensive overview of the Enteric Nervous System (ENS) drawn from Guyton & Hall, Ganong's, Histology, and Sleisenger & Fordtran's.
Enteric Nervous System (ENS)
Definition and Overview
The ENS is the third division of the autonomic nervous system (alongside sympathetic and parasympathetic), located entirely within the wall of the digestive tract from the esophagus to the anus. It contains more than 100 million neurons - more than the entire spinal cord - earning it the title "the second brain" or "mini-brain" (Ganong's Review, 26th ed.).
The ENS is the largest component of the autonomic nervous system and can orchestrate GI function independently of CNS input, though normal digestive function requires ongoing communication between the two (Yamada's Textbook of Gastroenterology).
Structural Organization - The Two Major Plexuses
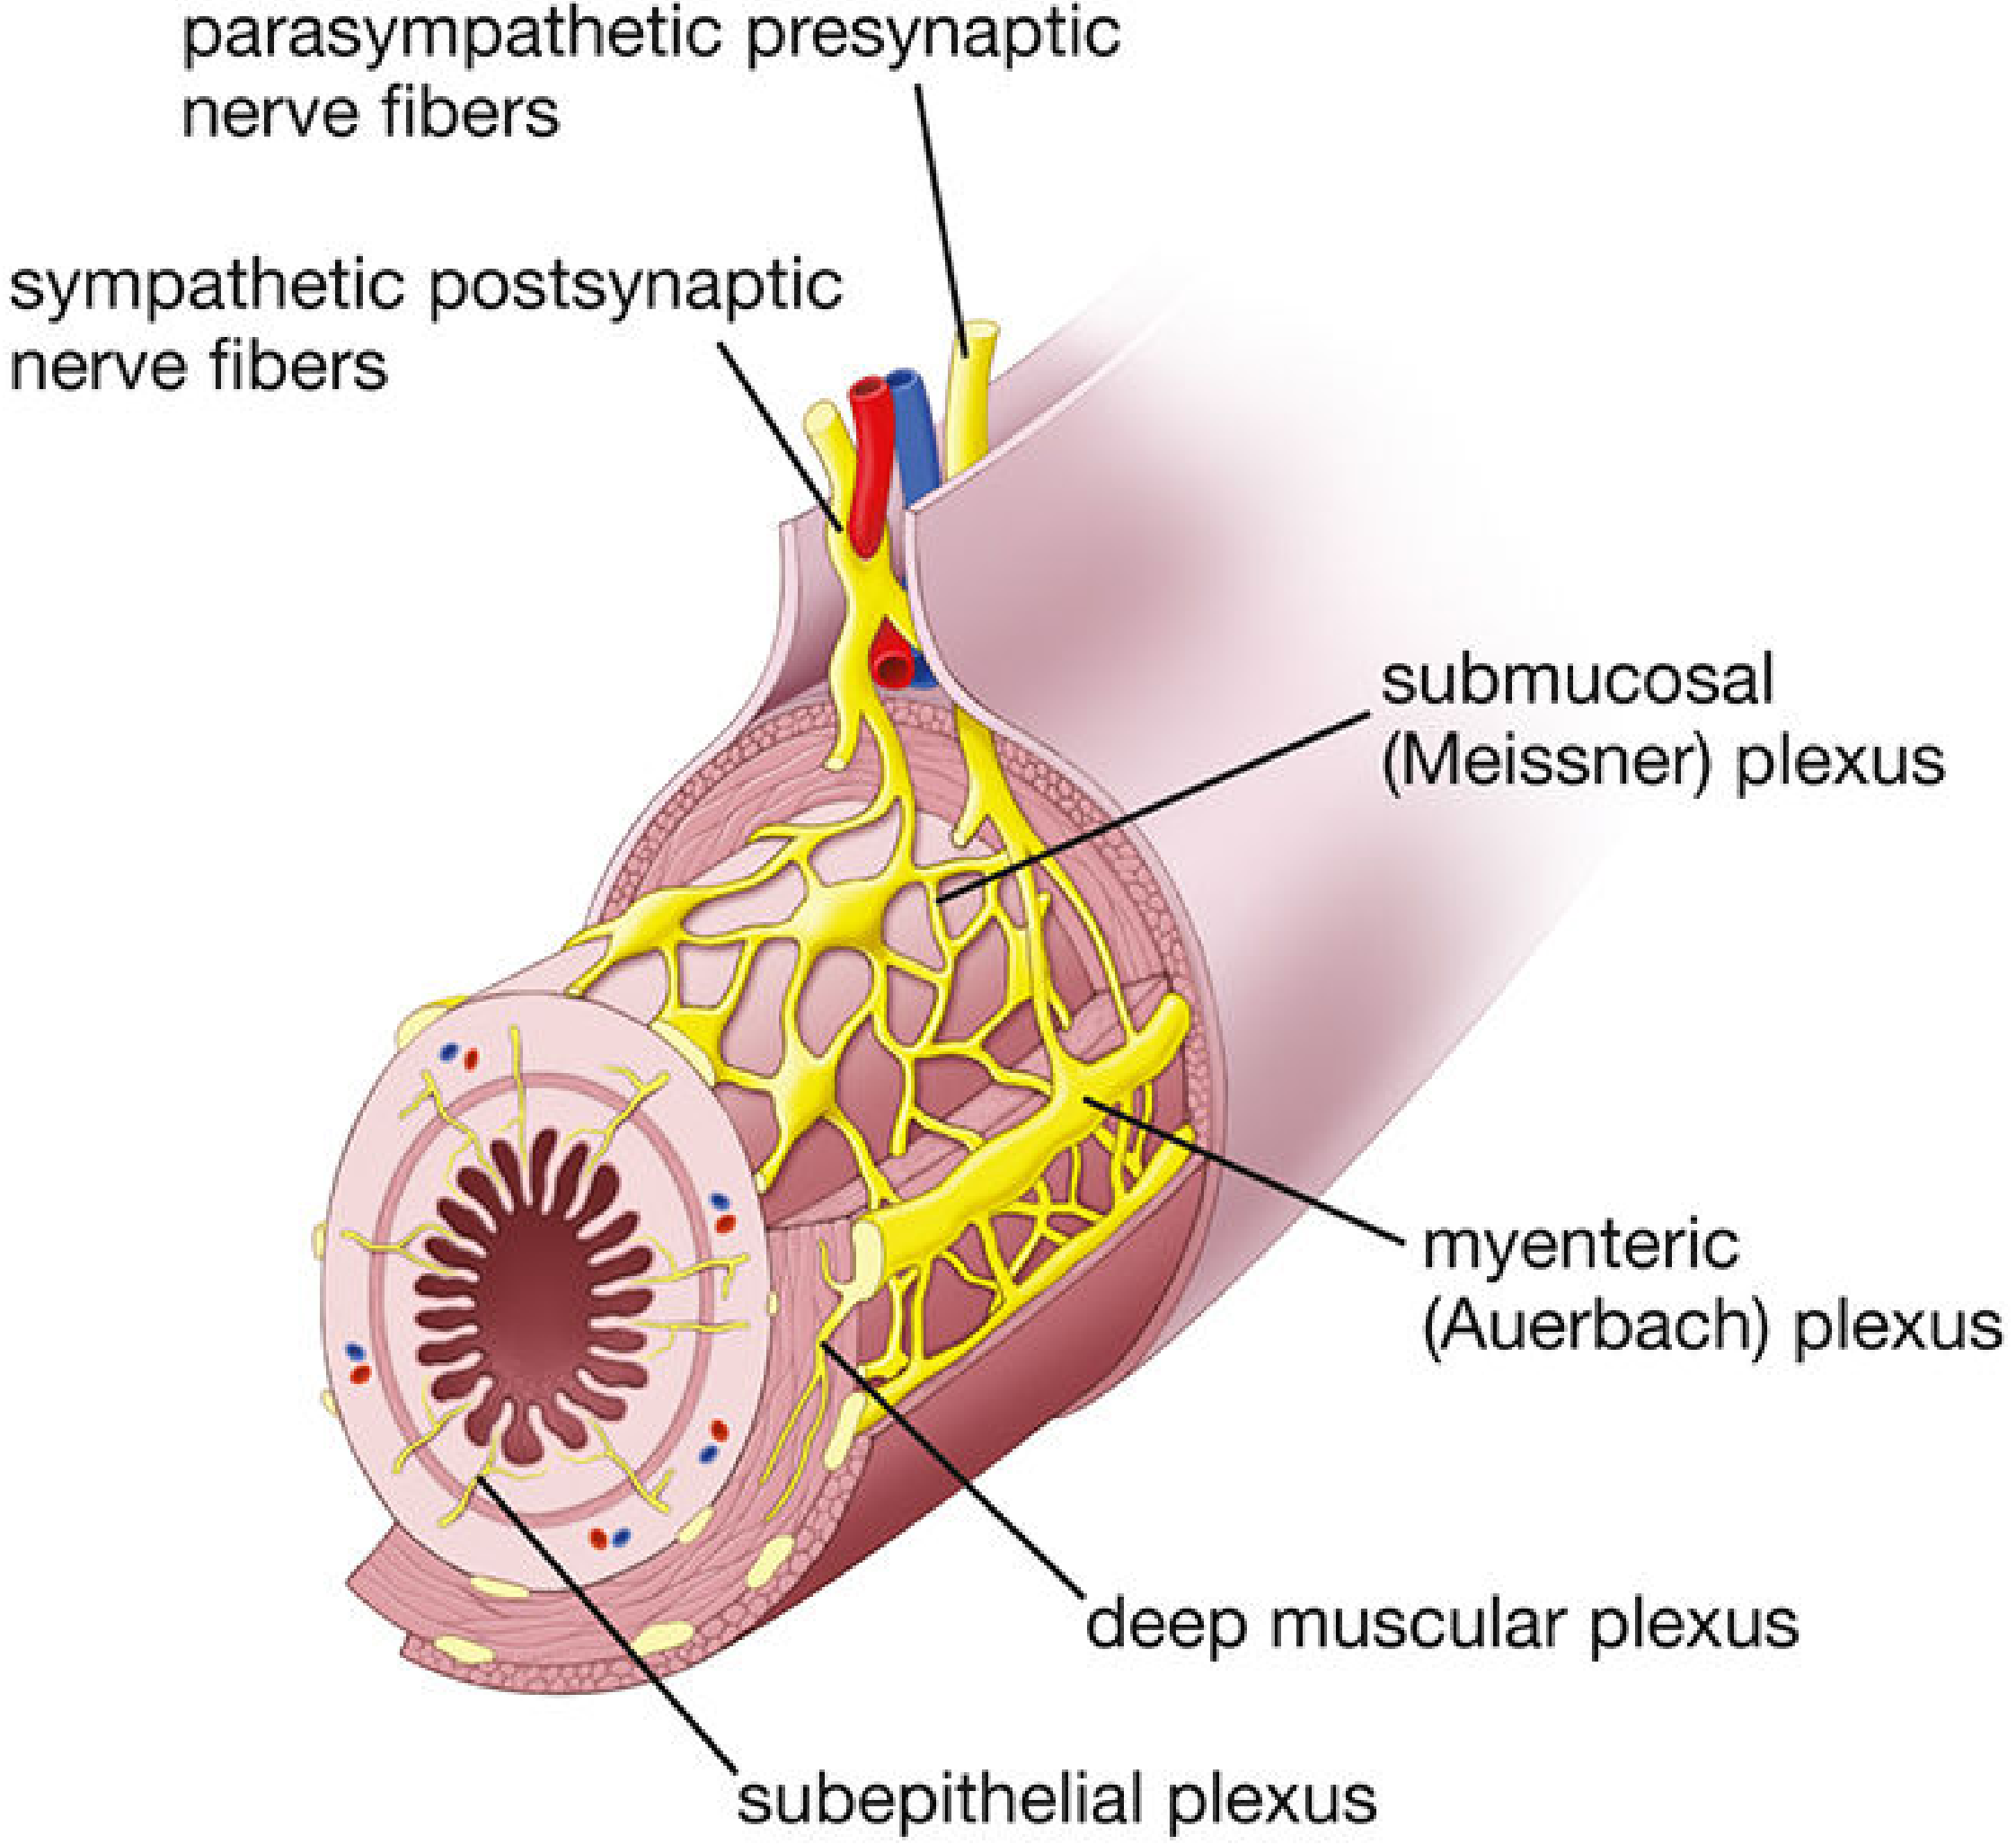
The ENS is organized into two principal intramural plexuses:
| Feature | Myenteric Plexus (Auerbach's) | Submucosal Plexus (Meissner's) |
|---|---|---|
| Location | Between longitudinal and circular muscle layers (muscularis externa) | Between circular muscle layer and luminal mucosa (submucosa) |
| Primary function | Controls GI motility | Controls secretion, absorption, local blood flow |
| Structure | Linear chain of interconnecting neurons running the entire length of the gut | Senses luminal environment; regulates epithelial cell function |
| Extent | Entire GI tract (esophagus to anus) | Entire GI tract |
A third, less prominent plexus exists: the subserosal plexus, which contains thin nerve fibers without ganglia and connects extrinsic nerves with the intrinsic plexuses. Additional plexuses noted in histology include a deep muscular plexus and a subepithelial plexus.
Neural Components
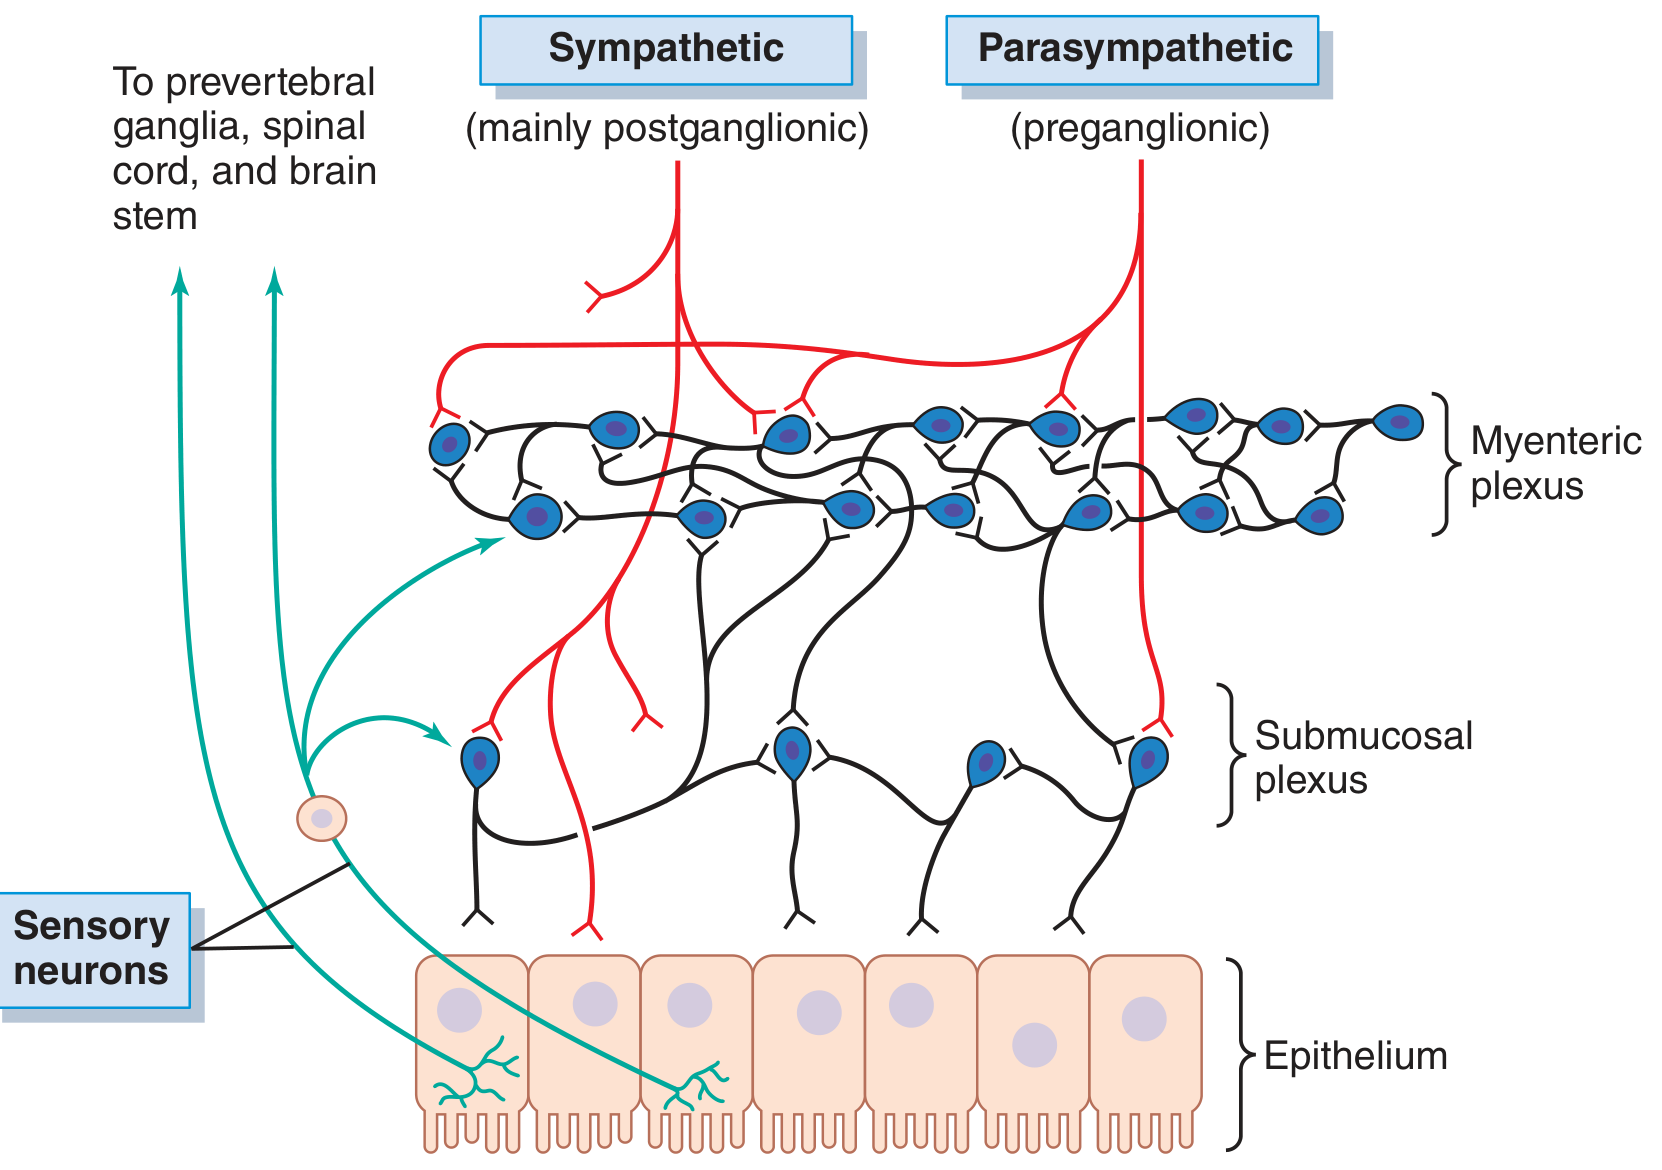
The ENS contains all elements of a complete nervous system:
- Sensory (afferent) neurons - innervate receptors in the mucosa responding to mechanical, thermal, osmotic, and chemical stimuli
- Interneurons - integrate sensory information and relay it to motor neurons
- Motor (efferent) neurons - control smooth muscle (motility) and secretory cells
Enteric neurons are supported by enteric neuroglial cells (resembling CNS astrocytes), not Schwann or satellite cells (Histology: A Text and Atlas, 9th ed.).
Myenteric Plexus - Functions in Detail
When stimulated, it produces:
- Increased tonic contraction of the gut wall
- Increased intensity of rhythmic contractions
- Increased rate of contraction
- Increased velocity of conduction of excitatory waves along the gut
Some myenteric neurons are inhibitory, releasing VIP (vasoactive intestinal polypeptide), nitric oxide (NO), and ATP. These inhibitory signals relax sphincters (e.g., the pyloric sphincter, ileocecal valve sphincter) to allow food passage.
Submucosal Plexus - Functions in Detail
- Integrates sensory signals from the GI epithelium
- Controls local intestinal secretion and absorption
- Regulates local contraction of submucosal muscle causing mucosal infolding
- Regulates gastrointestinal blood flow
Neurotransmitters of the ENS
Over 25 neurotransmitters have been identified in enteric neurons, including:
| Transmitter | Effect |
|---|---|
| Acetylcholine | Excitatory (most common - drives motility) |
| Norepinephrine | Inhibitory |
| Serotonin (5-HT) | Motility, secretion (95% of body's serotonin is in the gut) |
| Dopamine | Mixed |
| VIP (Vasoactive intestinal polypeptide) | Inhibitory (smooth muscle relaxation) |
| Nitric oxide (NO) | Inhibitory (sphincter relaxation) |
| ATP | Inhibitory |
| Substance P | Excitatory (peristaltic reflex) |
| Somatostatin | Inhibitory (secretion) |
| Cholecystokinin | Mixed |
| Enkephalins (leu-, met-) | Inhibitory |
| Neuropeptide Y | Inhibitory |
| Bombesin | Excitatory |
Extrinsic Autonomic Control of the ENS
Parasympathetic (enhances ENS activity)
- Cranial division - vagus nerve (CN X); innervates esophagus, stomach, pancreas, intestines to the proximal half of the large intestine
- Sacral division - S2-S4 via pelvic nerves; innervates the distal half of the large intestine, sigmoid, rectum, and anus (important for defecation reflexes)
- Postganglionic neurons located within the myenteric and submucosal plexuses
- Net effect: increases activity of the entire ENS; enhances motility and secretion
Sympathetic (inhibits ENS activity)
- Preganglionic fibers from spinal cord segments T5-L2
- Synapse in prevertebral ganglia (celiac, superior/inferior mesenteric ganglia)
- Postganglionic fibers release norepinephrine
- Inhibits ENS in two ways: (1) direct inhibition of intestinal smooth muscle; (2) inhibitory effect on neurons of the ENS
- Strong sympathetic stimulation can block food movement through the GI tract entirely
Gastrointestinal Reflexes Mediated by the ENS
Three categories:
- Entirely intramural (gut wall only) - peristalsis, mixing contractions, local secretion, local inhibitory effects
- Gut → prevertebral ganglia → gut - long-distance reflexes e.g.:
- Gastrocolic reflex (stomach → colon evacuation)
- Enterogastric reflex (small intestine/colon → inhibit gastric motility)
- Colonoileal reflex (colon → inhibit ileal emptying)
- Gut → spinal cord/brain stem → gut - e.g., gastric motor/secretory control via vagus; pain reflexes; defecation reflexes
Afferent Signals from the ENS
Notably, 80% of vagal nerve fibers are afferent (not efferent) - they transmit sensory signals from the gut to the medullary brainstem, which then initiates vagal reflex signals back to the GI tract.
Embryological Origin
The ENS originates from neural crest cells - primarily vagal and truncal neural crest:
- Vagal + truncal neural crest: enter the foregut mesenchyme and colonize the intestine in a cephalocaudal direction, complete by ~13 weeks of embryonic development
- Sacral neural crest: forms extraintestinal pelvic ganglia that colonize the hindgut
Clinical relevance - Hirschsprung's Disease (HD):
- Congenital absence of ganglion cells in both the submucosal (Meissner) and myenteric (Auerbach) plexuses
- Aganglionosis extends proximally from the internal sphincter
- Most common form: rectosigmoid involvement (80%)
- Incidence: 1 in 5000 live births; male predominance (4:1 in short segment)
- Associated genes: RET (most common, 10q11.2), GDNF, EDNRB, SOX10
- 10% of Down syndrome babies have HD
Clinical Correlates of ENS Dysfunction
- Hirschsprung's disease - absent ganglion cells → functional obstruction
- Achalasia - loss of inhibitory neurons (VIP/NO) in the esophageal myenteric plexus → failure of LES relaxation
- IBS (Irritable Bowel Syndrome) - dysregulation of ENS-mast cell signaling; altered serotonin pathways
- Parkinson's disease - Lewy bodies found in ENS neurons of the large intestinal wall (may enable early gut biopsy diagnosis)
- Alzheimer's disease - amyloid plaques and neurofibrillary tangles found in gut wall neurons
Sources: Guyton and Hall Textbook of Medical Physiology (pp. 778-779), Ganong's Review of Medical Physiology 26th ed. (p. 274), Histology: A Text and Atlas 9th ed. (pp. 991-992), Sleisenger and Fordtran's Gastrointestinal and Liver Disease
Mechanism of HCl secretion in flowchart
Finding Sources
Finding Sources
Finding Sources
Reading File
Reading File
Finding Sources
Reading File
Finding Sources
Finding Sources
Loading Image
Finding Sources
Reading File
Reading File
Loading Image
Here is the complete mechanism of HCl secretion in the parietal cell, with a detailed flowchart and the classic diagram from Guyton & Hall.
Mechanism of HCl Secretion by Parietal Cells
Cell Structure (Resting vs. Active)
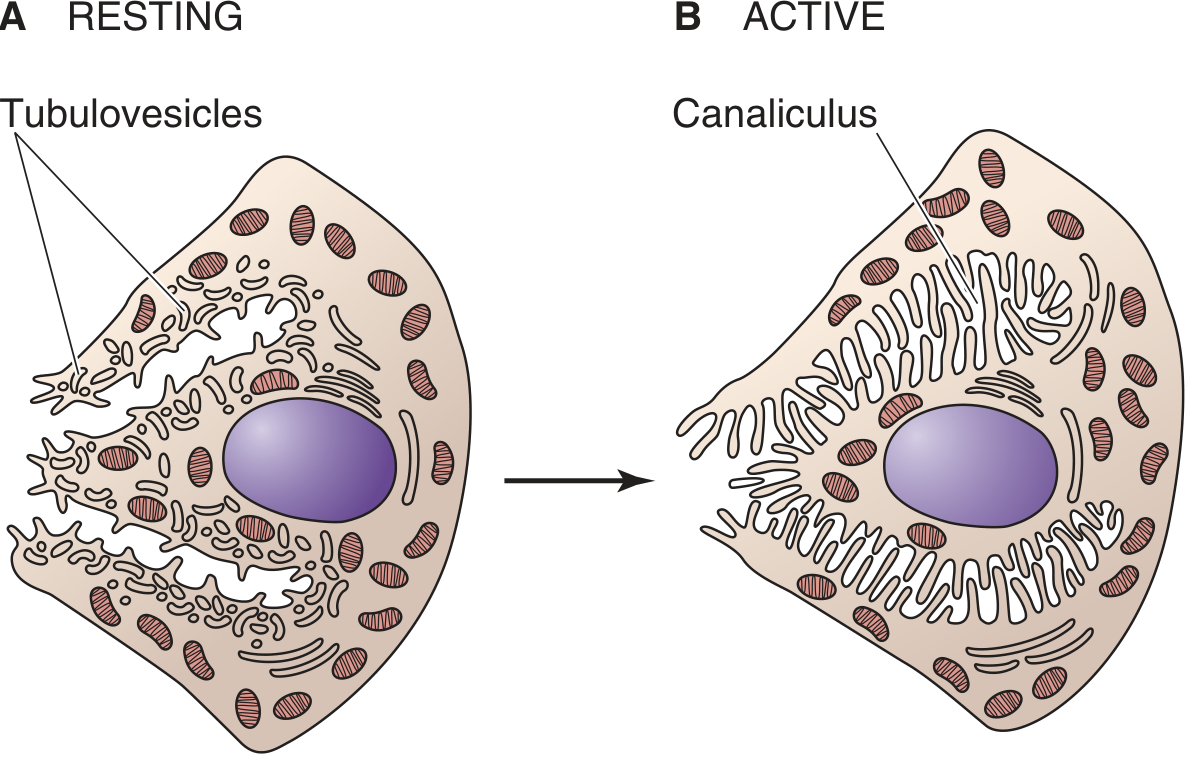
- Resting: H⁺/K⁺-ATPase stored in intracellular tubulovesicles (inactive; impermeable to K⁺)
- Activated: Tubulovesicles fuse with the apical membrane → form an extensive secretory canaliculus with long microvilli → pumps become active
- Mitochondria occupy 30-40% of cell volume to provide ATP energy
The Flowchart
STIMULUS (Acetylcholine / Gastrin / Histamine)
              │
              ▼
     PARIETAL CELL ACTIVATED
              │
    ┌─────────┴──────────────────────────────┐
    │                                        │
    ▼  (CYTOPLASM)                           ▼  (BASOLATERAL MEMBRANE)

CO₂ + H₂O ──[Carbonic Anhydrase]──▶ H₂CO₃       Na⁺-K⁺-ATPase pump
              │                                    pumps Na⁺ OUT / K⁺ IN
              ▼                                    │
     H₂CO₃ ──▶ H⁺ + HCO₃⁻                        ▼
              │              │              K⁺ accumulates inside cell
              │              │              K⁺ leaks into canaliculus
              │              ▼
              │    HCO₃⁻ exits via          Cl⁻ enters cell from
              │    HCO₃⁻/Cl⁻ exchanger ◀── interstitial fluid
              │    (basolateral)             ("alkaline tide" in blood)
              │
              ▼  (APICAL MEMBRANE - canaliculus)
         H⁺/K⁺-ATPase (Proton Pump)
              │
    H⁺ pumped INTO canaliculus lumen
    K⁺ pumped back INTO cell (recycled)
              │
    Cl⁻ exits through Cl⁻ channels
    (apical uniporters) INTO canaliculus
              │
              ▼
    H⁺ + Cl⁻ ──▶ HCl in canaliculus lumen
              │
    H₂O follows by OSMOSIS
              │
              ▼
    Final secretion into gastric lumen:
    HCl ~150-160 mEq/L
    KCl ~15 mEq/L
    NaCl (small amount)
Classic Diagram (Guyton & Hall)
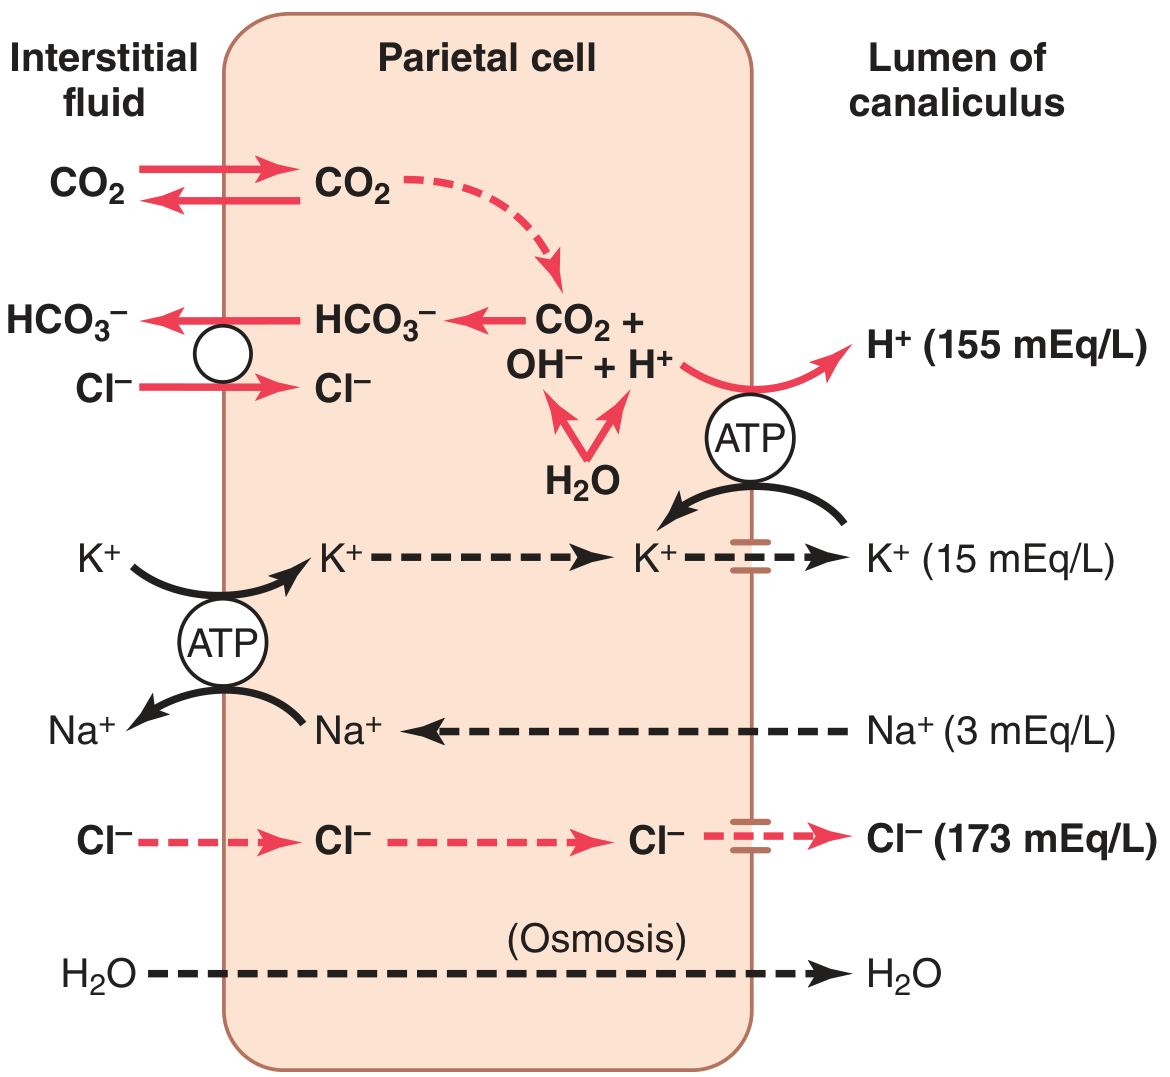
Step-by-Step Mechanism
Step 1 - H⁺ Generation (Carbonic Anhydrase Reaction)
CO₂ + H₂O → H₂CO₃ → H⁺ + HCO₃⁻
- CO₂ diffuses from blood capillaries into the parietal cell
- Carbonic anhydrase (located in cytoplasm AND apical membrane) catalyzes this reaction
- Dissociation produces H⁺ (used for secretion) and HCO₃⁻ (disposed basally)
Step 2 - H⁺ Secretion at the Apical Membrane (H⁺/K⁺-ATPase)
- The H⁺/K⁺-ATPase (proton pump) on the apical secretory canaliculus uses ATP to:
- Pump H⁺ OUT into the canaliculus lumen
- Bring K⁺ IN from the canaliculus (K⁺ recycled)
- This is an active, electrogenic, antiport mechanism
- Creates a concentration gradient of 1 million-fold for H⁺ (intracellular pH ~7 vs. luminal pH ~1)
Step 3 - HCO₃⁻ Disposal and Cl⁻ Entry (Basolateral Exchanger)
- The HCO₃⁻ generated in step 1 exits the cell across the basolateral membrane via a Cl⁻/HCO₃⁻ exchanger (Band 3 type)
- In exchange, Cl⁻ enters the parietal cell from the interstitial fluid
- The HCO₃⁻ released into blood creates the post-prandial "alkaline tide" (transient rise in blood/urine pH after a meal)
Step 4 - Cl⁻ Secretion into Canaliculus
- Cl⁻ that entered via the basolateral exchanger travels through the cytoplasm
- Exits through apical Cl⁻ channels (uniporters) into the canaliculus lumen
- Cl⁻ must be present for the H⁺/K⁺-ATPase to function efficiently (K⁺ cycling requires a KCl efflux pathway)
Step 5 - K⁺ Recycling (Na⁺-K⁺-ATPase + K⁺ Leak)
- Basolateral Na⁺-K⁺-ATPase pumps K⁺ into the cell and Na⁺ out → maintains intracellular K⁺
- K⁺ leaks from cytoplasm into the canaliculus through apical K⁺ channels
- This luminal K⁺ is then recycled back into the cell by H⁺/K⁺-ATPase (exchanged for H⁺)
- Na⁺ in the canaliculus lumen is reabsorbed back into the cell (creating very low luminal Na⁺ ~3 mEq/L)
Step 6 - Water Entry (Osmosis)
- The accumulation of H⁺, Cl⁻ in the canaliculus raises osmolarity
- H₂O follows by osmosis from the cell into the canaliculus
Final Composition of Gastric HCl Secretion
| Component | Concentration |
|---|---|
| HCl | ~150-160 mEq/L |
| KCl | ~15 mEq/L |
| NaCl | Small amount |
| H₂O | Bulk |
Secretion rate: 3 × 10⁴ H⁺ ions per second per parietal cell
Stimulants and Inhibitors
| Stimulants | Receptor on Parietal Cell | Effect |
|---|---|---|
| Acetylcholine (vagus) | M₃ muscarinic | ↑ H⁺ secretion |
| Gastrin | CCK-B/gastrin receptor | ↑ H⁺ secretion |
| Histamine (from ECL cells) | H₂ receptor → ↑ cAMP | ↑ H⁺ secretion (most potent) |
| Inhibitors | Mechanism |
|---|---|
| Somatostatin (D cells) | Inhibits ECL cells and directly inhibits parietal cells |
| Proton Pump Inhibitors (omeprazole) | Covalently bind cysteines on extracytoplasmic surface of H⁺/K⁺-ATPase |
| H₂ blockers (ranitidine) | Block H₂ receptor → ↓ cAMP → ↓ pump activity |
| Prostaglandins, GLP-1, somatostatin | Direct parietal cell inhibition |
Sources: Guyton and Hall Textbook of Medical Physiology (p. 802), Histology: A Text and Atlas 9th ed. (p. 1546-1547), Harrison's Principles of Internal Medicine 22nd ed., Medical Physiology (Boron & Boulpaep)
Pulmonary circulation
The pulmonary circulation is a low-pressure, low-resistance circuit that carries deoxygenated blood from the right heart to the lungs for gas exchange and returns oxygenated blood to the left heart. Normal pulmonary artery pressure is ~25/8 mmHg (mean ~15 mmHg), far lower than the systemic circulation.
Searching sources...
Finding Sources
Reading File
Reading File
Finding Sources
Reading File
Reading File
Finding Sources
Finding Sources
Finding Sources
Finding Sources
Finding Sources
Reading File
Finding Sources
Reading File
Loading Image
Reading File
Loading Image
Loading Image
Here is a comprehensive overview of the Pulmonary Circulation sourced from Guyton & Hall, Costanzo Physiology, Braunwald's Heart Disease, and Murray & Nadel's Respiratory Medicine.
Pulmonary Circulation
Overview
The pulmonary circulation is a low-pressure, low-resistance, high-compliance circuit that runs in series with the systemic circulation, receiving the entire cardiac output from the right ventricle. Its primary purpose is gas exchange at the alveolar-capillary interface.
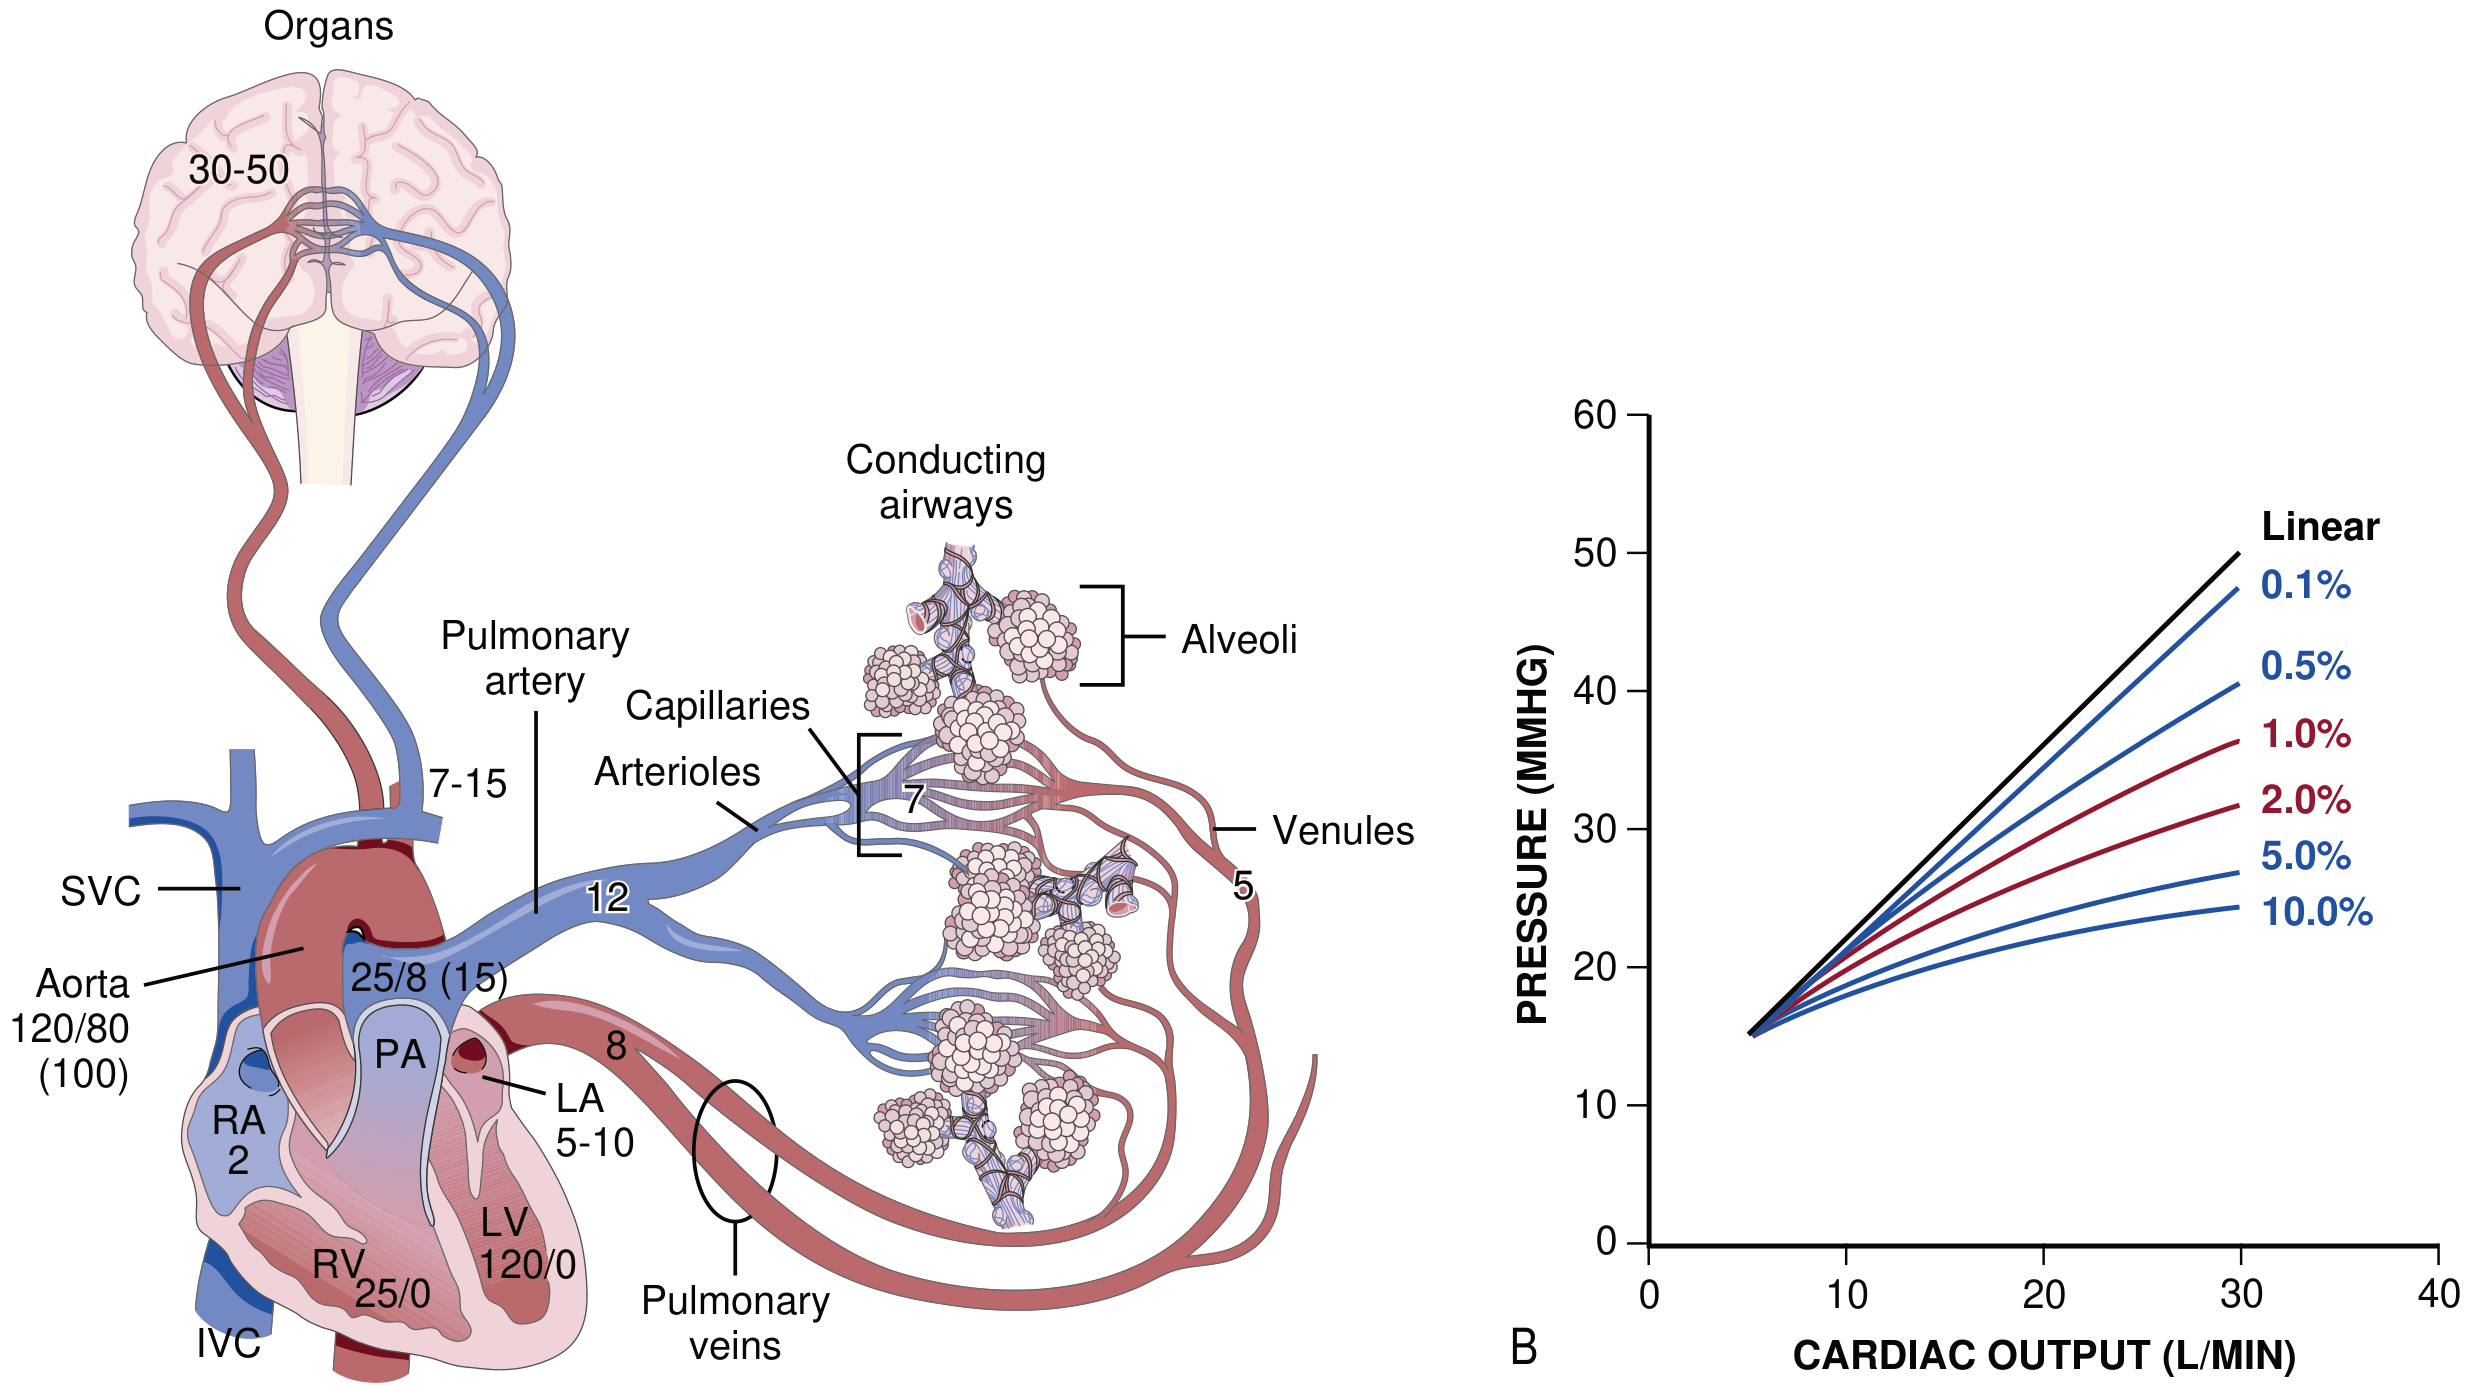
1. Anatomy of Pulmonary Vessels
The pulmonary artery enters each lung at the hilum and travels adjacent to each airway generation down to the respiratory bronchiole level. This anatomical pairing ensures ventilation-perfusion matching.
| Vessel Class | Volume (mL) | Surface Area (m²) |
|---|---|---|
| Arteries (>500 µm) | 68 | 0.4 |
| Arterioles (13-500 µm) | 18 | 1.0 |
| Capillaries (~10 µm) | 60-200 | 50-70 |
| Venules (13-500 µm) | 13 | 1.2 |
| Veins (>500 µm) | 58 | ~0.5 |
Key structural features:
- Pulmonary arteries travel with airways (peribronchovascular sheaths)
- Pulmonary veins follow Miller's dictum: as far from airways as possible; drain the periphery and interlobular septa
- Capillaries form a dense sheet around alveoli - 50-70 m² of gas exchange surface
- Pulmonary arterial walls are thin with little smooth muscle compared to systemic arteries
2. Hemodynamic Characteristics (Normal Values)
| Parameter | Pulmonary Circulation | Systemic Circulation |
|---|---|---|
| Systolic / Diastolic pressure | 25 / 8 mmHg | 120 / 80 mmHg |
| Mean pressure | ~15 mmHg | ~100 mmHg |
| Capillary pressure | ~7 mmHg | ~17 mmHg |
| Left atrial (filling) pressure | 5-10 mmHg | - |
| Vascular resistance (PVR) | ~1.5 Wood units | ~15-20 Wood units |
| Blood flow | = Cardiac output (~5 L/min) | = Cardiac output (~5 L/min) |
The pulmonary circulation has the same blood flow as the systemic circulation but achieves this with proportionately lower pressures and resistances (Costanzo Physiology 7th ed.).
Resting pulmonary blood flow = 3.5 L/min/m², with ~300 mL/m² blood in the pulmonary circuit at any moment (~25% in capillaries) (Braunwald's Heart Disease).
3. Pulmonary Blood Flow Equation
Q = ΔP / RFlow = (PA pressure - Left atrial pressure) / Pulmonary vascular resistance≈ (15 - 8) / PVR ≈ 7 / PVR
4. Regulation of Pulmonary Blood Flow
Unlike systemic vessels, pulmonary arterioles constrict in response to hypoxia - this is the opposite of systemic behaviour.
Hypoxic Pulmonary Vasoconstriction (HPV) - The Major Regulator
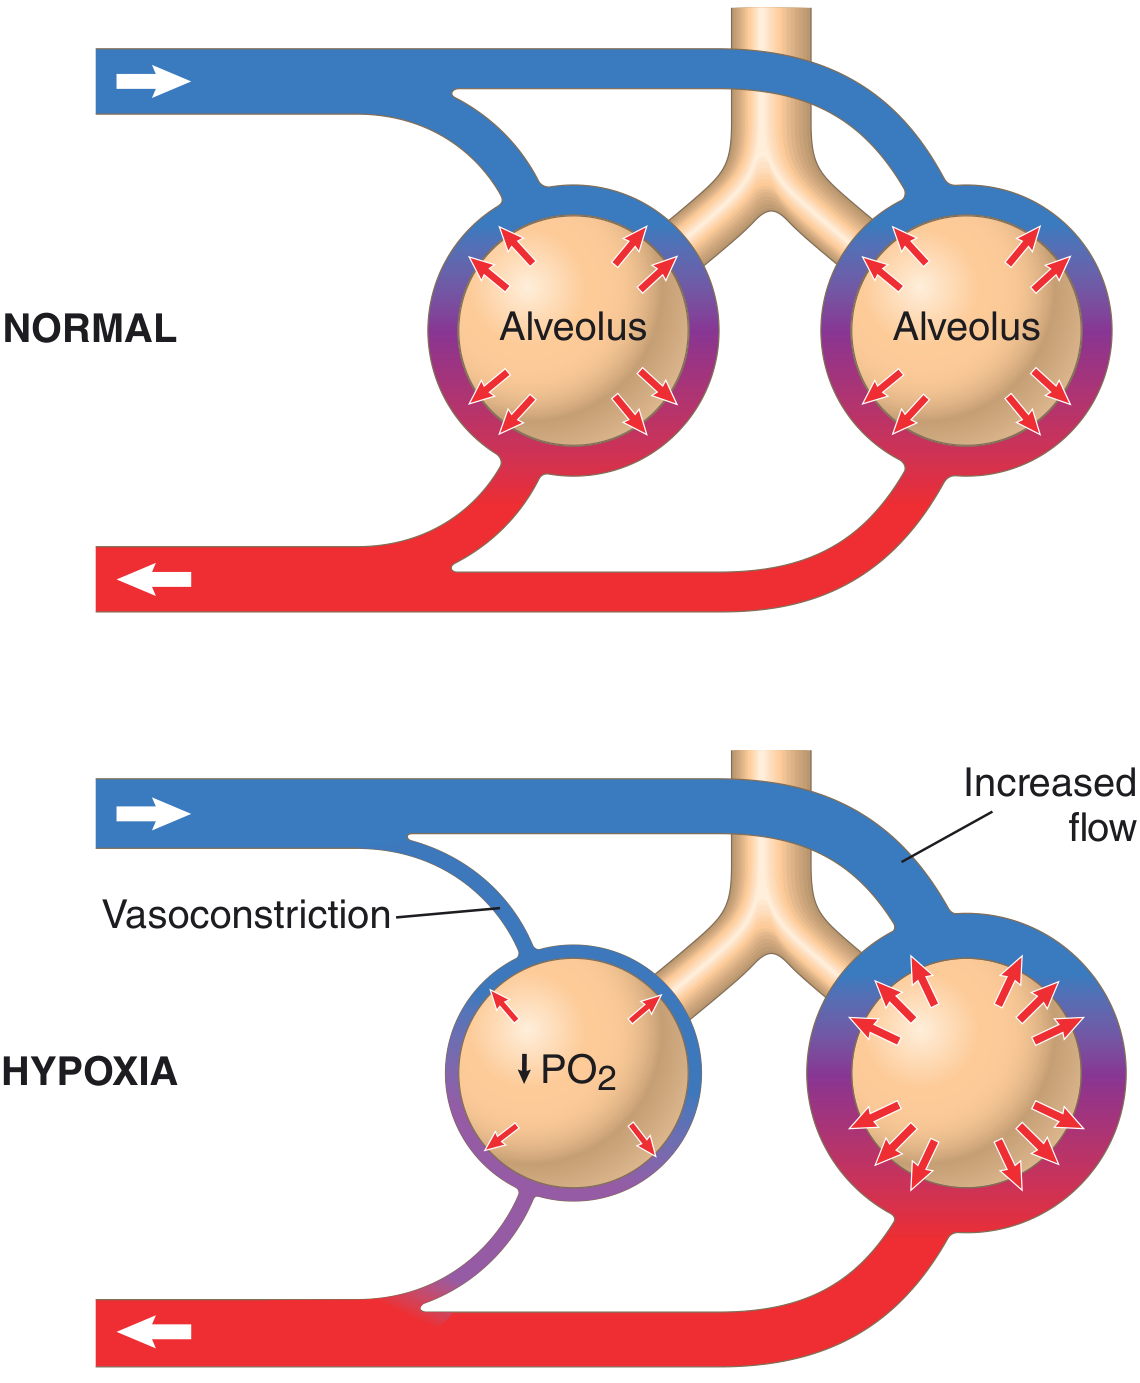
- Trigger: PAO₂ falls below 70 mmHg → pulmonary arteriolar vasoconstriction
- PAO₂ between 70-100 mmHg: minimal effect on tone
- Mechanism:
- Hypoxia inhibits O₂-sensitive K⁺ channels in vascular smooth muscle → membrane depolarization
- Depolarization opens voltage-gated Ca²⁺ channels → Ca²⁺ influx → contraction
- Also: ↑ endothelin, ↑ reactive oxygen species, ↓ nitric oxide release
- Function: diverts blood from poorly ventilated alveoli to well-ventilated alveoli, optimizing V/Q matching
- Clinical problem: In widespread lung disease (e.g., multilobar pneumonia), hypoxia is diffuse → generalized HPV → pulmonary hypertension
Other Vasoactive Factors
| Vasoconstrictors | Vasodilators |
|---|---|
| Hypoxia (↓ PAO₂) | Nitric oxide (NO) |
| Hypercapnia / acidosis | Prostacyclin (PGI₂) |
| Endothelin-1 | Acetylcholine |
| Thromboxane A₂ | Histamine (in some vessels) |
| Serotonin | Atrial natriuretic peptide (ANP) |
| Norepinephrine | VIP, CGRP |
5. Regional Distribution of Blood Flow - West's Zones
Due to the low pulmonary arterial pressure and the hydrostatic effects of gravity, blood flow is not uniform throughout the upright lung. In the upright adult, the lung extends ~30 cm vertically (15 cm above and 8 cm below the heart), creating a pressure difference of ~23 mmHg from apex to base.
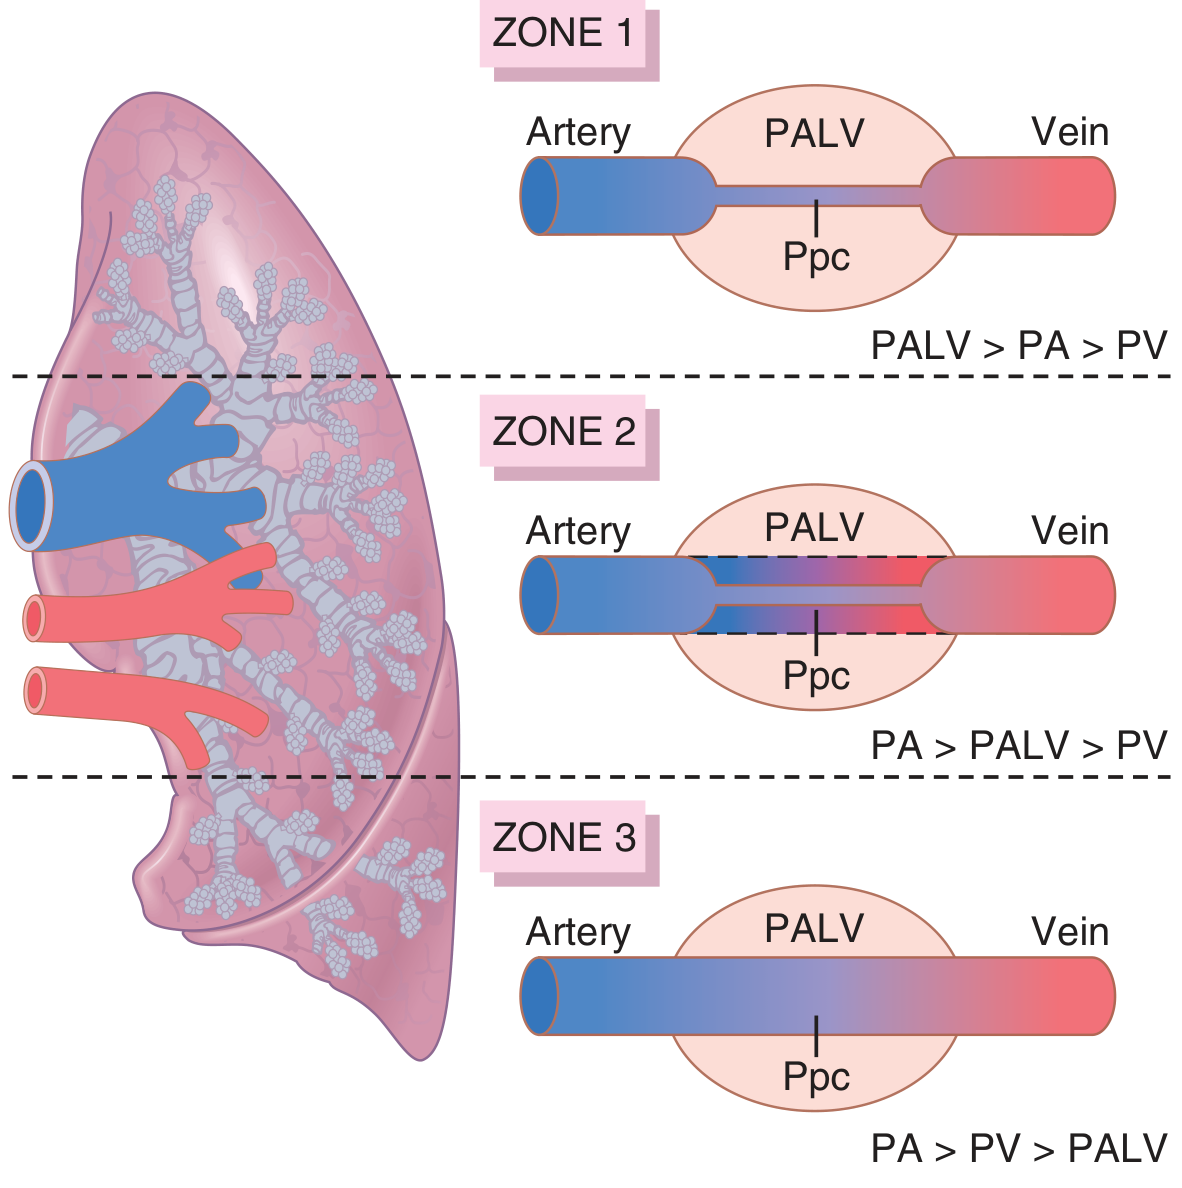
| Zone | Location | Pressure Relationship | Blood Flow | Clinical Notes |
|---|---|---|---|---|
| Zone 1 | Apex | P_ALV > P_A > P_V | None (vessels collapsed) | Does NOT normally exist; occurs in IPPV or hypovolemic shock |
| Zone 2 | Middle (~10 cm above heart) | P_A > P_ALV > P_V | Intermittent (systolic only) | Flow proportional to P_A - P_ALV |
| Zone 3 | Base (~10 cm below heart) | P_A > P_V > P_ALV | Continuous | Flow proportional to P_A - P_V; normal flow pattern |
In normal upright adults: blood flow at the base is ~5 times greater than at the apex at rest. During exercise, pulmonary pressure rises and all zones become Zone 3 - flow becomes more uniform.
6. Pulmonary Circulation During Exercise
- CO increases 5-fold during maximal exercise
- The pulmonary circuit accommodates this via:
- Recruitment - previously closed capillaries open (especially in upper zones)
- Distension - existing vessels dilate
- This keeps mPAP from rising proportionally - the mPAP-CO relationship is curvilinear (not linear), preserving low RV afterload
- Normal α (distensibility coefficient) = 1-2% per mmHg; pathological stiffening (↓ α) causes mPAP to rise steeply with exercise
7. Pulmonary Venous System
- 3-4 bronchial veins converge per lung → 2 main pulmonary veins per lung → 4 total draining into the posterior left atrium
- Pulmonary veins are 60% thinner than arteries; less smooth muscle; more extracellular matrix
- Large pulmonary veins lack an internal elastic lamina
- Venous sclerosis and muscularization contribute to pulmonary hypertension in left heart failure
8. Pulmonary Lymphatics
Two principal plexuses:
- Deep plexus: peribronchovascular connective tissue; follows airways to respiratory bronchioles; also follows pulmonary artery/vein branches
- Superficial plexus: visceral pleura
- Lymph drains centripetally toward the hilum, propelled by respiratory movements and cardiac pulsations → extrapulmonary nodes around primary bronchi and trachea
- No lymphatics in alveolar walls
9. Effect of Aging
Beyond age 35:
- Gradual ↓ in conduit artery extensibility
- ↑ muscularization of medium/small vessels (collagen deposition, elastin deterioration)
- Mild intimal fibrotic remodeling → slight rise in mPAP and PVR by the 7th decade
- Main pulmonary artery dilates slightly with age
10. Pulmonary Hypertension (Definition)
- Defined as mean PAP ≥ 25 mmHg at rest
- Pulmonary arterial hypertension (PAH): elevated PVR + normal PCWP (<15 mmHg)
- Common causes: idiopathic PAH, left heart disease, chronic lung disease (HPV-driven), pulmonary emboli, connective tissue disease
Sources: Guyton and Hall Textbook of Medical Physiology (pp. 489-492), Costanzo Physiology 7th ed. (pp. 231-232), Braunwald's Heart Disease (p. 988), Murray & Nadel's Textbook of Respiratory Medicine
Transport of oxygen
Oxygen is transported in blood in two forms: bound to hemoglobin (~98.5%) and dissolved in plasma (~1.5%). The oxyhemoglobin dissociation curve describes the relationship between PO₂ and hemoglobin saturation, and its sigmoidal shape has major physiological significance.
Searching sources...
Finding Sources
Finding Sources
Finding Sources
Reading File
Reading File
Reading File
Finding Sources
Finding Sources
Reading File
Reading File
Loading Image
Reading File
Finding Sources
Reading File
Loading Image
Reading File
Loading Image
Loading Image
Here is a comprehensive account of Transport of Oxygen in the blood, drawn from Costanzo Physiology and Guyton & Hall.
Transport of Oxygen in Blood
Overview
Oxygen is transported in blood in two forms:
| Form | Amount | Mechanism |
|---|---|---|
| Bound to hemoglobin (oxyhemoglobin) | ~98% | Reversible binding to heme groups |
| Dissolved in plasma | ~2% | Henry's law; solubility of 0.003 mL O₂/100 mL blood/mmHg |
Only dissolved O₂ creates a partial pressure (PO₂) that drives diffusion. O₂ bound to hemoglobin does not contribute to PO₂.
1. Dissolved O₂
- Calculated using Henry's Law: Dissolved O₂ = 0.003 × PO₂
- At normal PaO₂ of 100 mmHg: dissolved O₂ = 0.3 mL O₂/100 mL blood
- This is grossly insufficient - if dissolved O₂ alone delivered O₂ at a cardiac output of 5 L/min:
- O₂ delivery = 5 L/min × 0.3 mL/100 mL = 15 mL O₂/min
- O₂ demand at rest = 250 mL O₂/min ← grossly inadequate
- Hence hemoglobin is essential
2. Hemoglobin - Structure
- Globular protein with 4 subunits
- Each subunit has a heme moiety (iron-binding porphyrin) + polypeptide chain (α or β)
- Adult hemoglobin A = α₂β₂
- Each subunit binds one O₂ molecule → maximum 4 O₂ per hemoglobin
- Iron must be in ferrous (Fe²⁺) state to bind O₂
3. O₂-Binding Capacity and O₂ Content
O₂-binding capacity = maximum O₂ bound at 100% saturation:
1 g Hb binds 1.34 mL O₂ Normal Hb = 15 g/100 mL → O₂ binding capacity = 20.1 mL O₂/100 mL
O₂ content = actual O₂ in blood:
O₂ content = (O₂-binding capacity × % saturation) + dissolved O₂
Normal arterial O₂ content:
= (20.1 × 0.98) + 0.3 = 19.7 + 0.3 = ~20 mL O₂/100 mL blood
O₂ delivery to tissues:
DO₂ = Cardiac output × O₂ content = 5 L/min × 20 mL/100 mL = 1000 mL O₂/min (at rest)
4. The O₂-Hemoglobin Dissociation Curve
The relationship between PO₂ and hemoglobin saturation is sigmoidal (S-shaped):
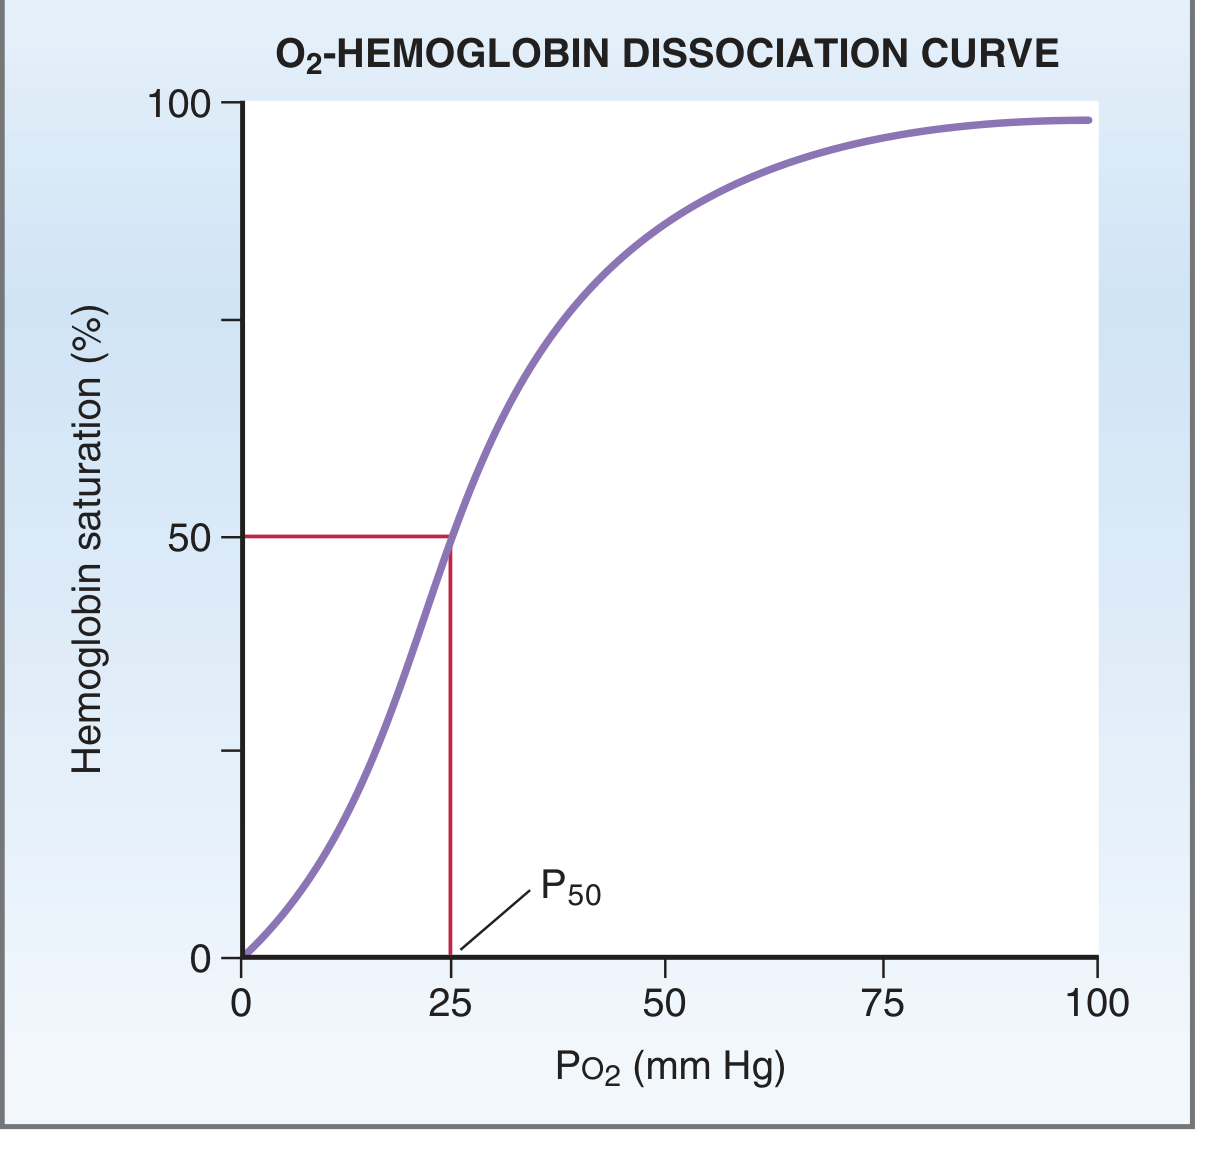
Key values (from Table 5.2, Costanzo):
| PO₂ (mmHg) | Saturation (%) | Clinical location |
|---|---|---|
| 100 | 98 | Arterial blood / alveoli |
| 60 | 90 | Threshold - SpO₂ starts dropping fast below this |
| 40 | 75 | Mixed venous blood (at rest) |
| 25 | 50 | P₅₀ (normal) |
| 20 | 35 | Venous blood in exercising muscle |
Why the sigmoidal shape - Positive Cooperativity:
- First O₂ binding to Hb increases affinity for the second → second increases for third → affinity for the fourth is highest
- Flat upper part (60-100 mmHg): loading zone - O₂ stays tightly bound; tolerates altitude well
- Steep middle part (20-60 mmHg): unloading zone - small ↓ PO₂ releases large amounts of O₂
5. Loading and Unloading of O₂
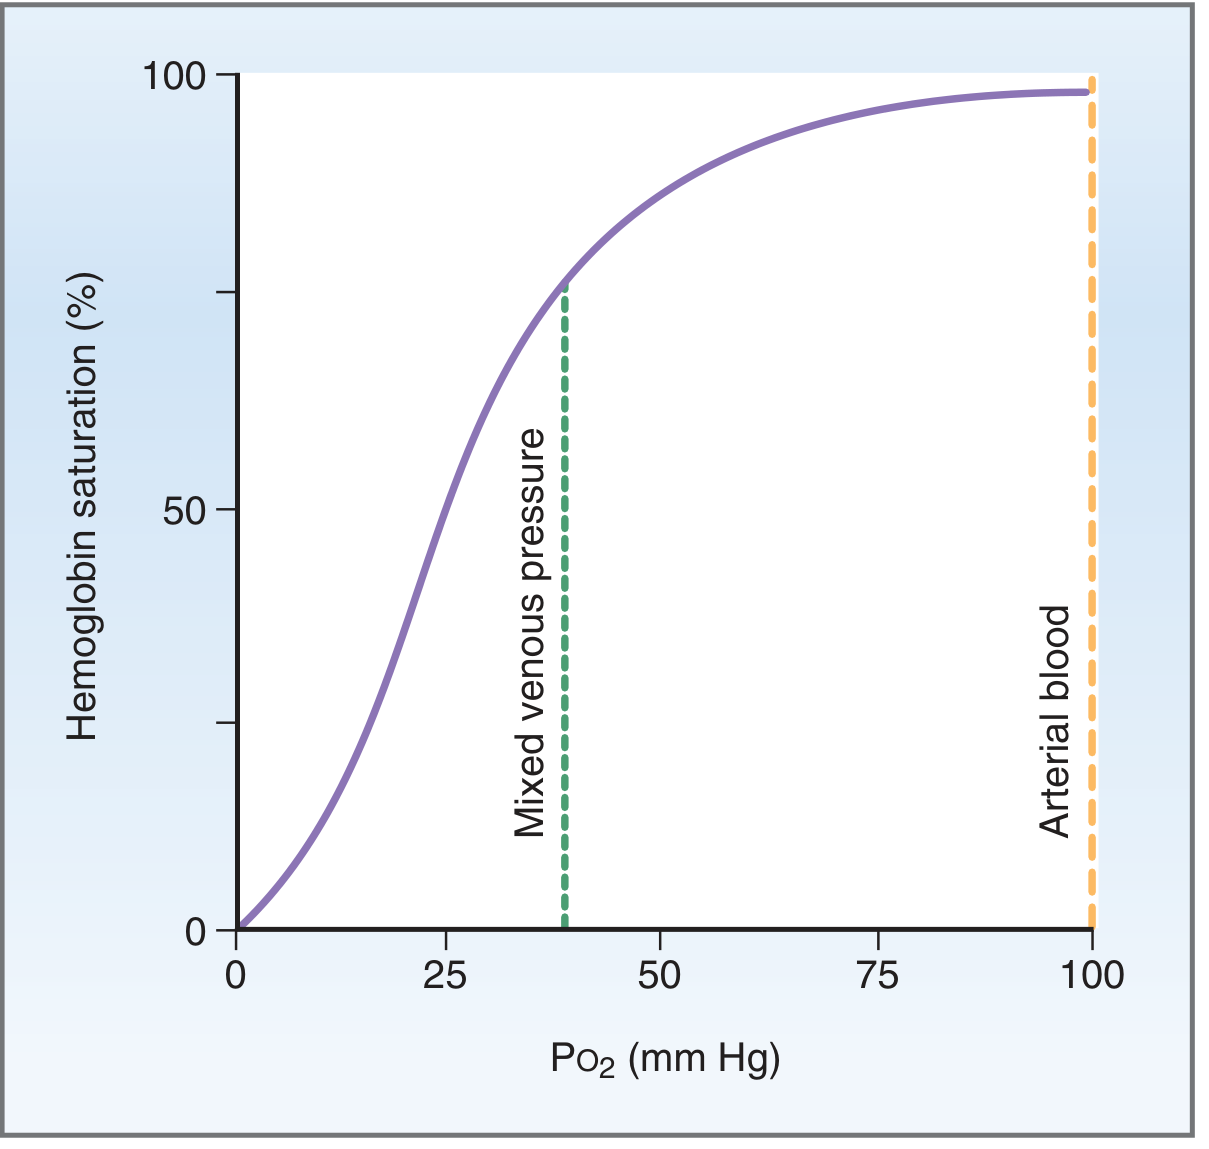
- Lungs (loading): PaO₂ = 100 mmHg → saturation ~98% → O₂ tightly bound (high affinity, flat portion of curve)
- Tissues (unloading): PVO₂ = 40 mmHg → saturation ~75% → affinity decreases, O₂ released
- O₂ extracted at rest = 98% - 75% = ~23% per pass through tissues
- During exercise: tissue PO₂ falls to ~20 mmHg → saturation drops to ~35% → ~63% extracted per pass
6. Shifts of the Dissociation Curve (P₅₀ Changes)
P₅₀ = PO₂ at which Hb is 50% saturated = normal 25-26 mmHg. It is the key indicator of Hb-O₂ affinity.
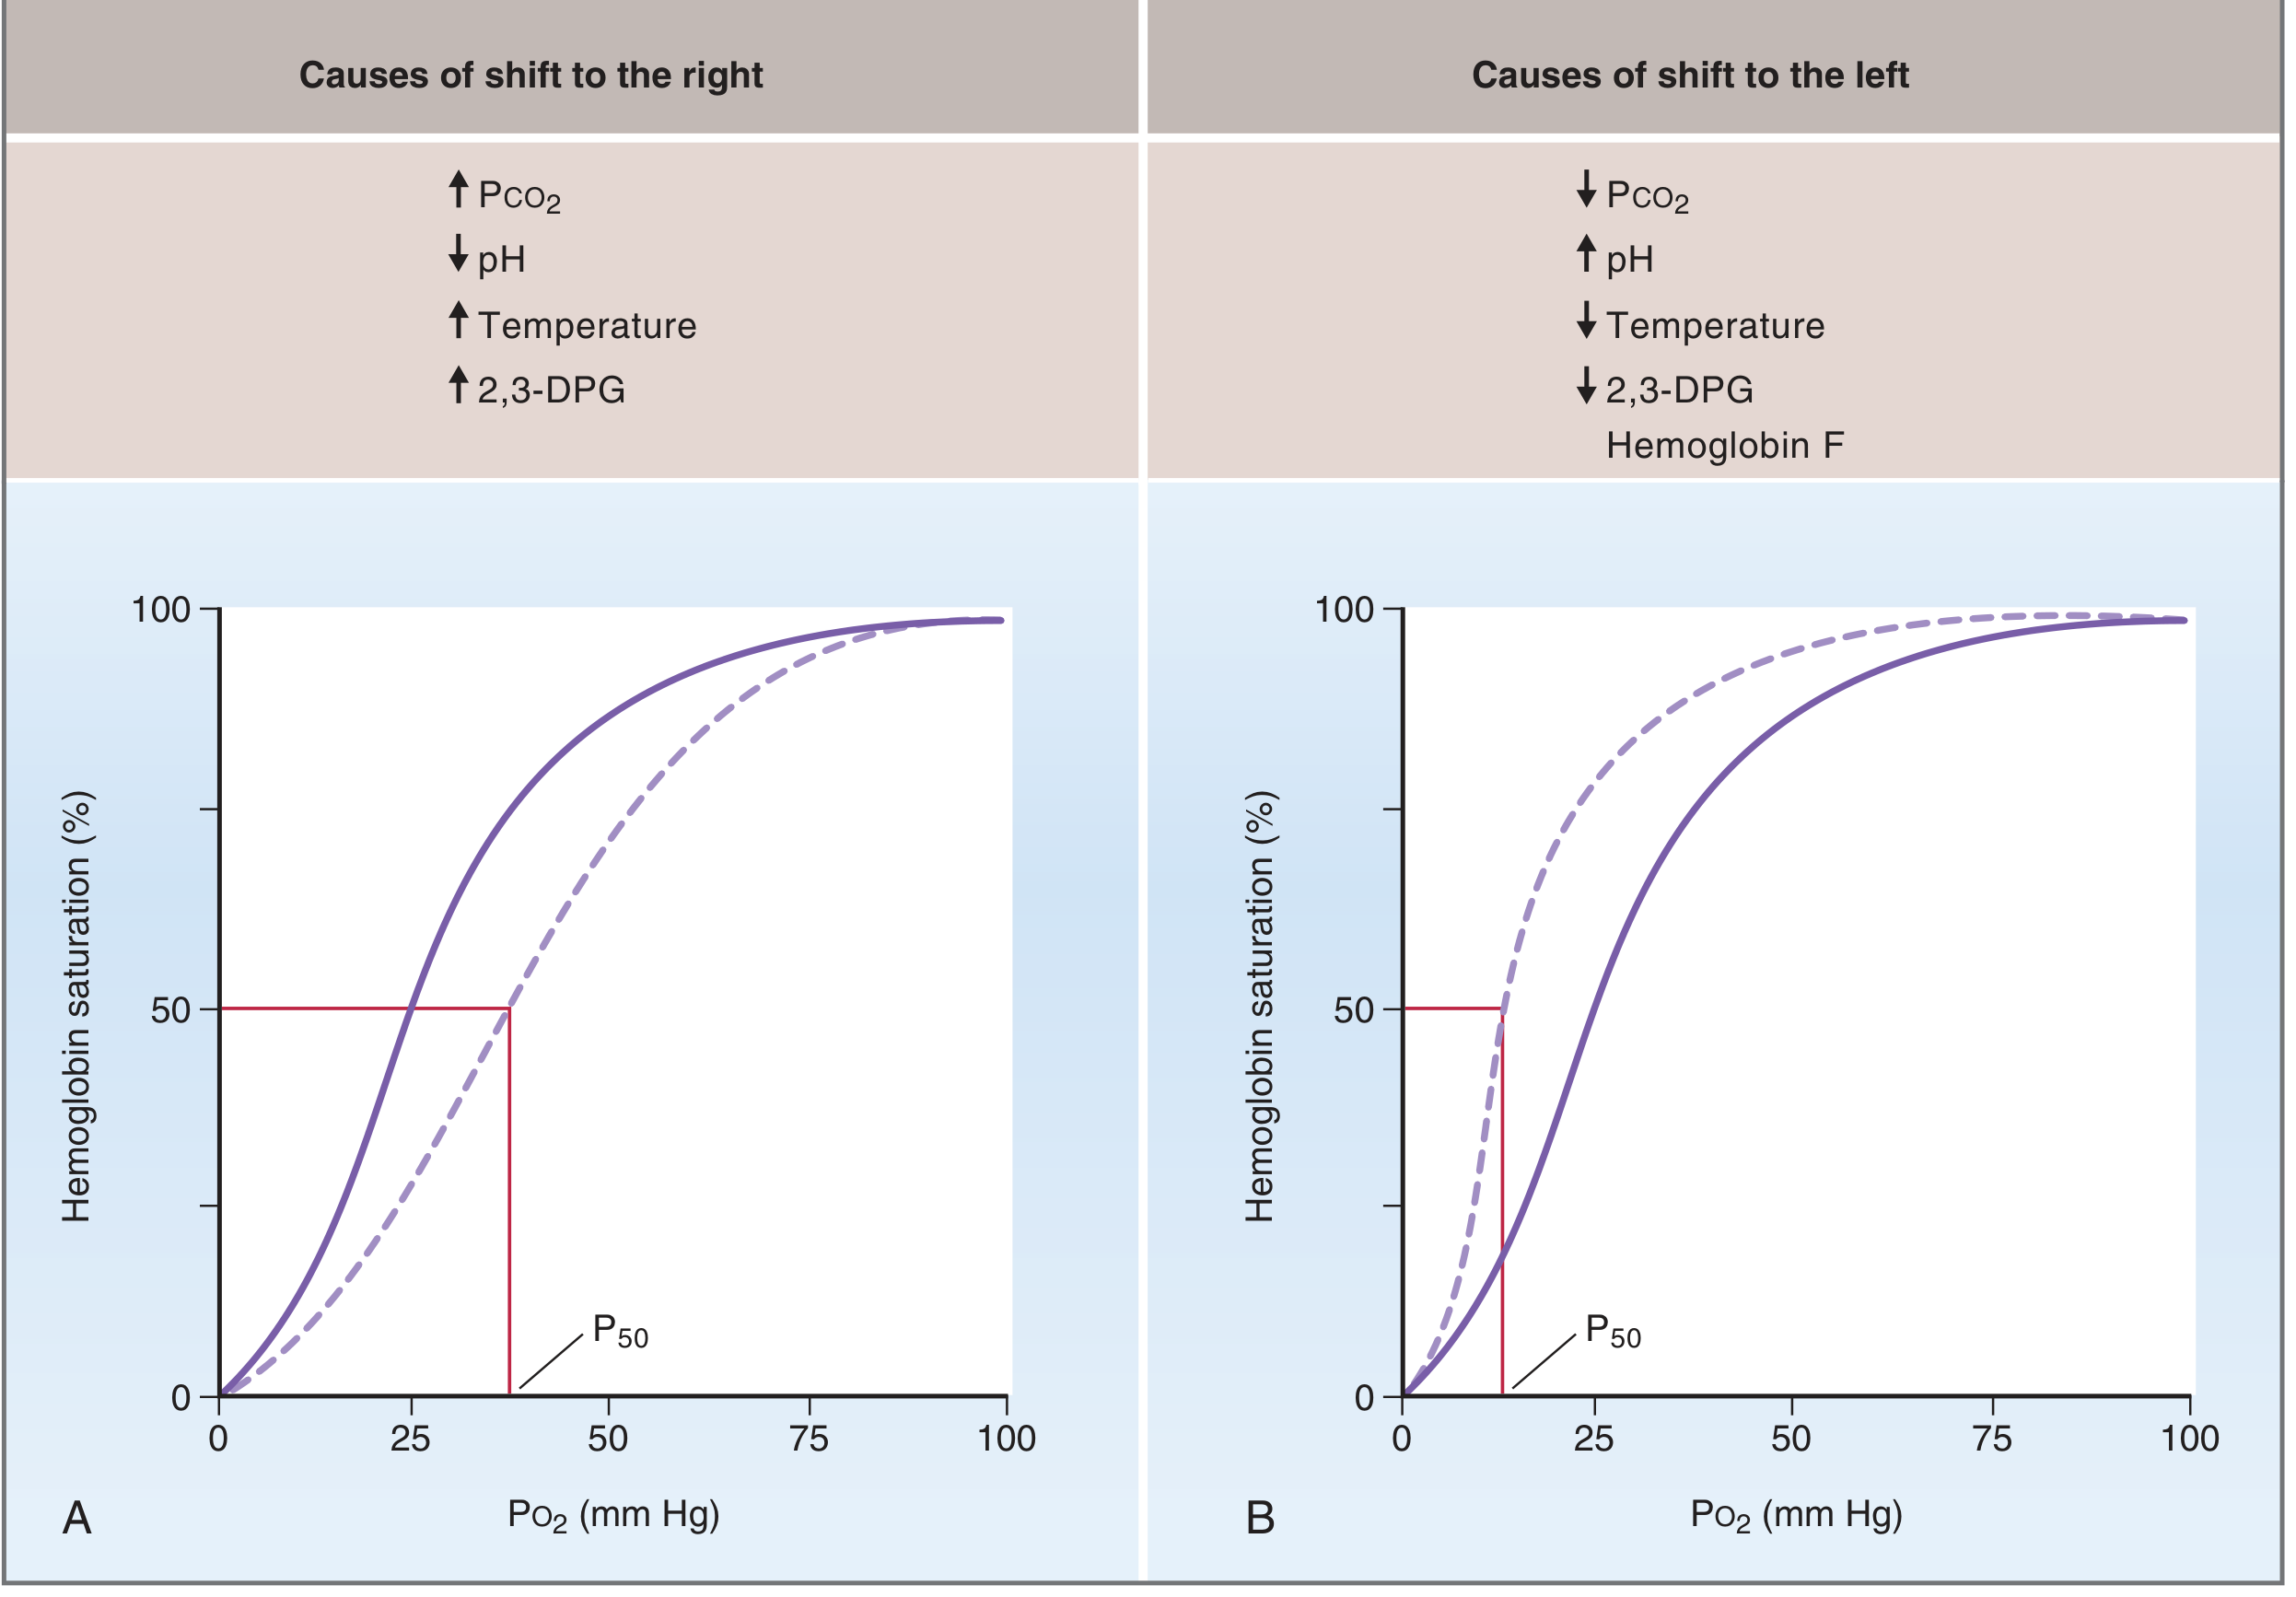
Rightward Shift (↓ Hb-O₂ affinity, ↑ P₅₀) - facilitates O₂ unloading
| Factor | Mechanism | Clinical example |
|---|---|---|
| ↑ PCO₂ | CO₂ binds Hb (carbamino) + lowers pH | Exercising muscle, tissues |
| ↓ pH (↑ H⁺) | Bohr effect: H⁺ binds to β-chains, alters conformation | Lactic acidosis, metabolic acidosis |
| ↑ Temperature | Weakens Hb-O₂ bond | Fever, exercising muscle |
| ↑ 2,3-DPG | Binds β-chains of deoxyHb, stabilises deoxygenated form | High altitude, chronic hypoxia, anaemia |
The Bohr Effect: ↑ PCO₂ / ↓ pH → right shift → more O₂ unloaded to active tissues. This is the dominant physiological mechanism matching O₂ delivery to metabolic demand.
Leftward Shift (↑ Hb-O₂ affinity, ↓ P₅₀) - facilitates O₂ loading (but impairs unloading)
| Factor | Mechanism | Clinical example |
|---|---|---|
| ↓ PCO₂, ↑ pH | Reverse Bohr effect | Hyperventilation, alkalosis |
| ↓ Temperature | Strengthens Hb-O₂ bond | Hypothermia, cold blood transfusion |
| ↓ 2,3-DPG | Reduced competition with O₂ for β-chain binding | Stored bank blood (depleted 2,3-DPG) |
| Fetal Hb (HbF) | γ-chains bind 2,3-DPG less avidly → ↑ affinity | Fetus (PaO₂ ~40 mmHg) - must extract O₂ from maternal blood |
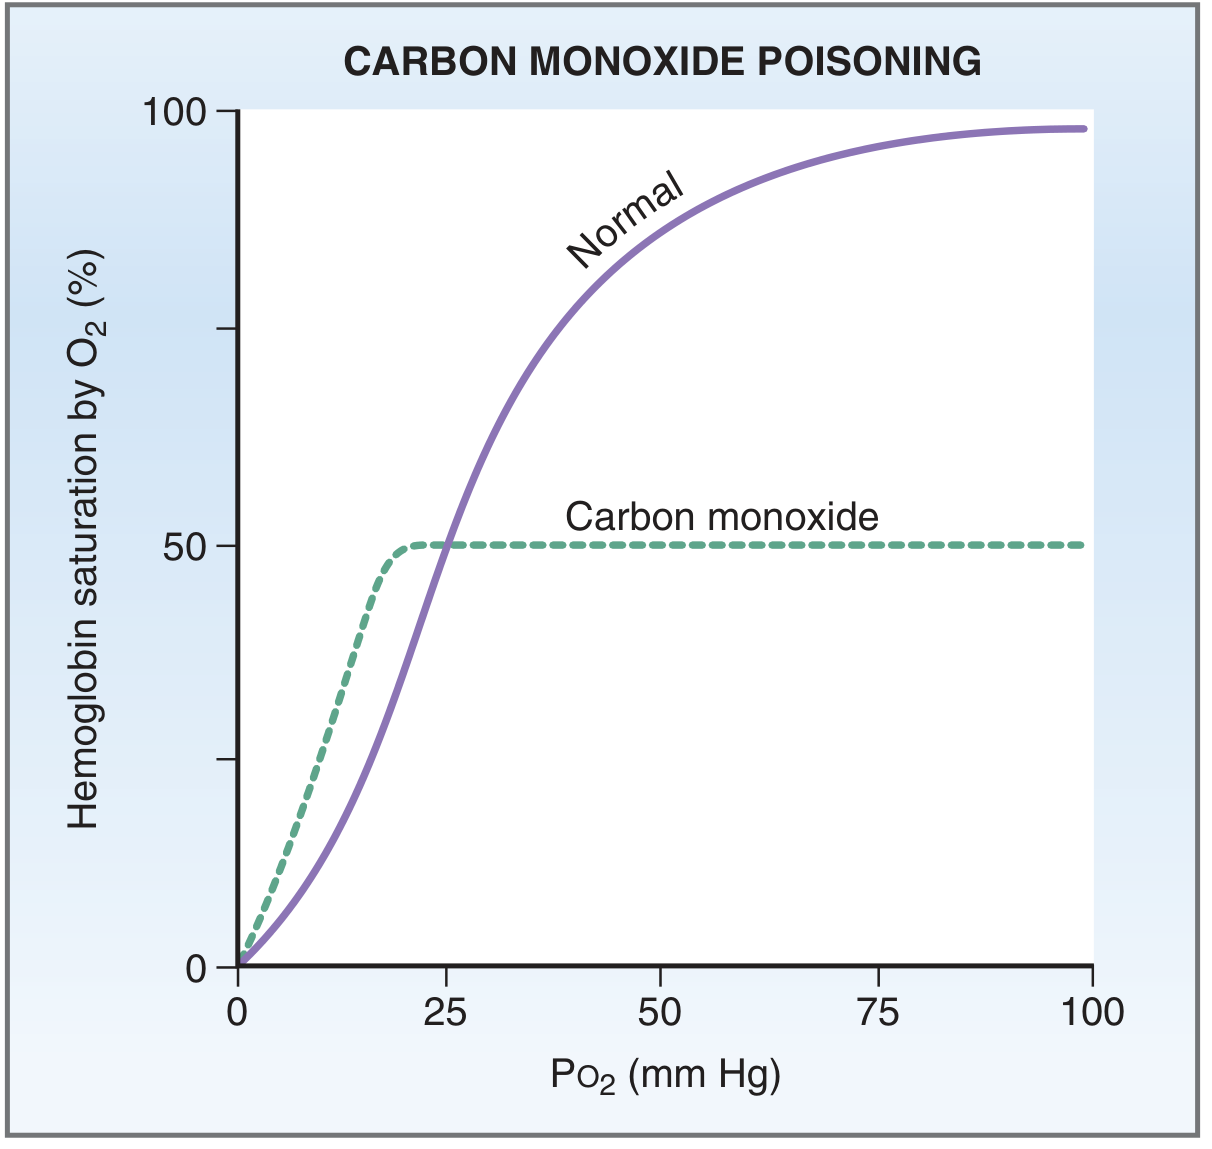
| CO (carboxyhemoglobin) | Blocks O₂ sites AND left shifts remaining Hb | CO poisoning |
7. Effect of Carbon Monoxide
CO has 250× greater affinity for Hb than O₂:
- Occupies heme sites → reduces O₂-binding capacity
- Causes left shift of remaining curve → O₂ binds more tightly to remaining sites → impaired tissue unloading
- Combined effect: catastrophic O₂ delivery failure
8. Hemoglobin Variants Affecting O₂ Transport
| Variant | Abnormality | Effect |
|---|---|---|
| Methemoglobin | Fe²⁺ oxidised to Fe³⁺ (by nitrites, sulfonamides) | Cannot bind O₂ → functional anaemia |
| Hemoglobin S (sickle cell) | β-chain mutation (α₂β_S²) | ↓ O₂ affinity; deoxyHbS polymerises → sickling → vascular occlusion |
| HbF (fetal) | γ-chains replace β-chains; ↓ 2,3-DPG binding | ↑ O₂ affinity (left shift) → favours O₂ transfer from maternal to fetal blood |
9. PO₂ Values Along the O₂ Transport Pathway
Atmosphere       → 159 mmHg
Alveolar air     → 104 mmHg   (diluted by water vapor + CO₂)
Pulmonary capillary (arterial end) → 40 mmHg
Pulmonary capillary (venous end)   → 104 mmHg (equilibration in 0.25 sec)
Systemic artery  → 95 mmHg    (venous admixture/shunt lowers from 104)
Interstitial fluid → 40 mmHg
Intracellular     → 23 mmHg   (mitochondria ~1-5 mmHg)
Mixed venous blood → 40 mmHg
10. Pulse Oximetry
Measures % saturation (SpO₂) using dual-wavelength spectrophotometry:
- Oxyhemoglobin and deoxyhemoglobin have different light absorbances at 660 nm and 940 nm
- Measures arterial pulsatile signal (subtracts venous/capillary background)
- Does not directly measure PaO₂ - but P₅₀ allows estimation from the curve
- Limitation: Cannot distinguish oxyhemoglobin from carboxyhemoglobin (both read as "saturated") → CO poisoning will falsely read SpO₂ ~100%
Sources: Costanzo Physiology 7th ed. (pp. 222-229), Guyton and Hall Textbook of Medical Physiology (pp. 521-523)
This is a shared conversation. Sign in to Orris to start your own chat.