
Ecg
Asking for Preferences
What would you like to know about ECG?
ECG interpretation follows a systematic approach: check rate, rhythm, axis, P waves, PR interval, QRS complex, ST segment, and T waves. Here is a quick overview while I pull from the medical library.
Searching sources...
Reading File
Finding Sources
Finding Sources
Reading File
Reading File
Finding Sources
Finding Sources
Reading File
Finding Sources
Reading File
Reading File
Loading Image
Loading Image
Here is a complete, systematic guide to ECG interpretation, drawn from Harrison's Principles of Internal Medicine, Medical Physiology, and Goldman-Cecil Medicine.
How to Read an ECG - A Systematic Approach
The ECG Paper
ECG paper has a grid of 1-mm small boxes and 5-mm large boxes:
- Horizontal axis (time): 0.04 s per small box, 0.2 s per large box
- Vertical axis (voltage): 0.1 mV per mm
- 5 large boxes = 1.0 second
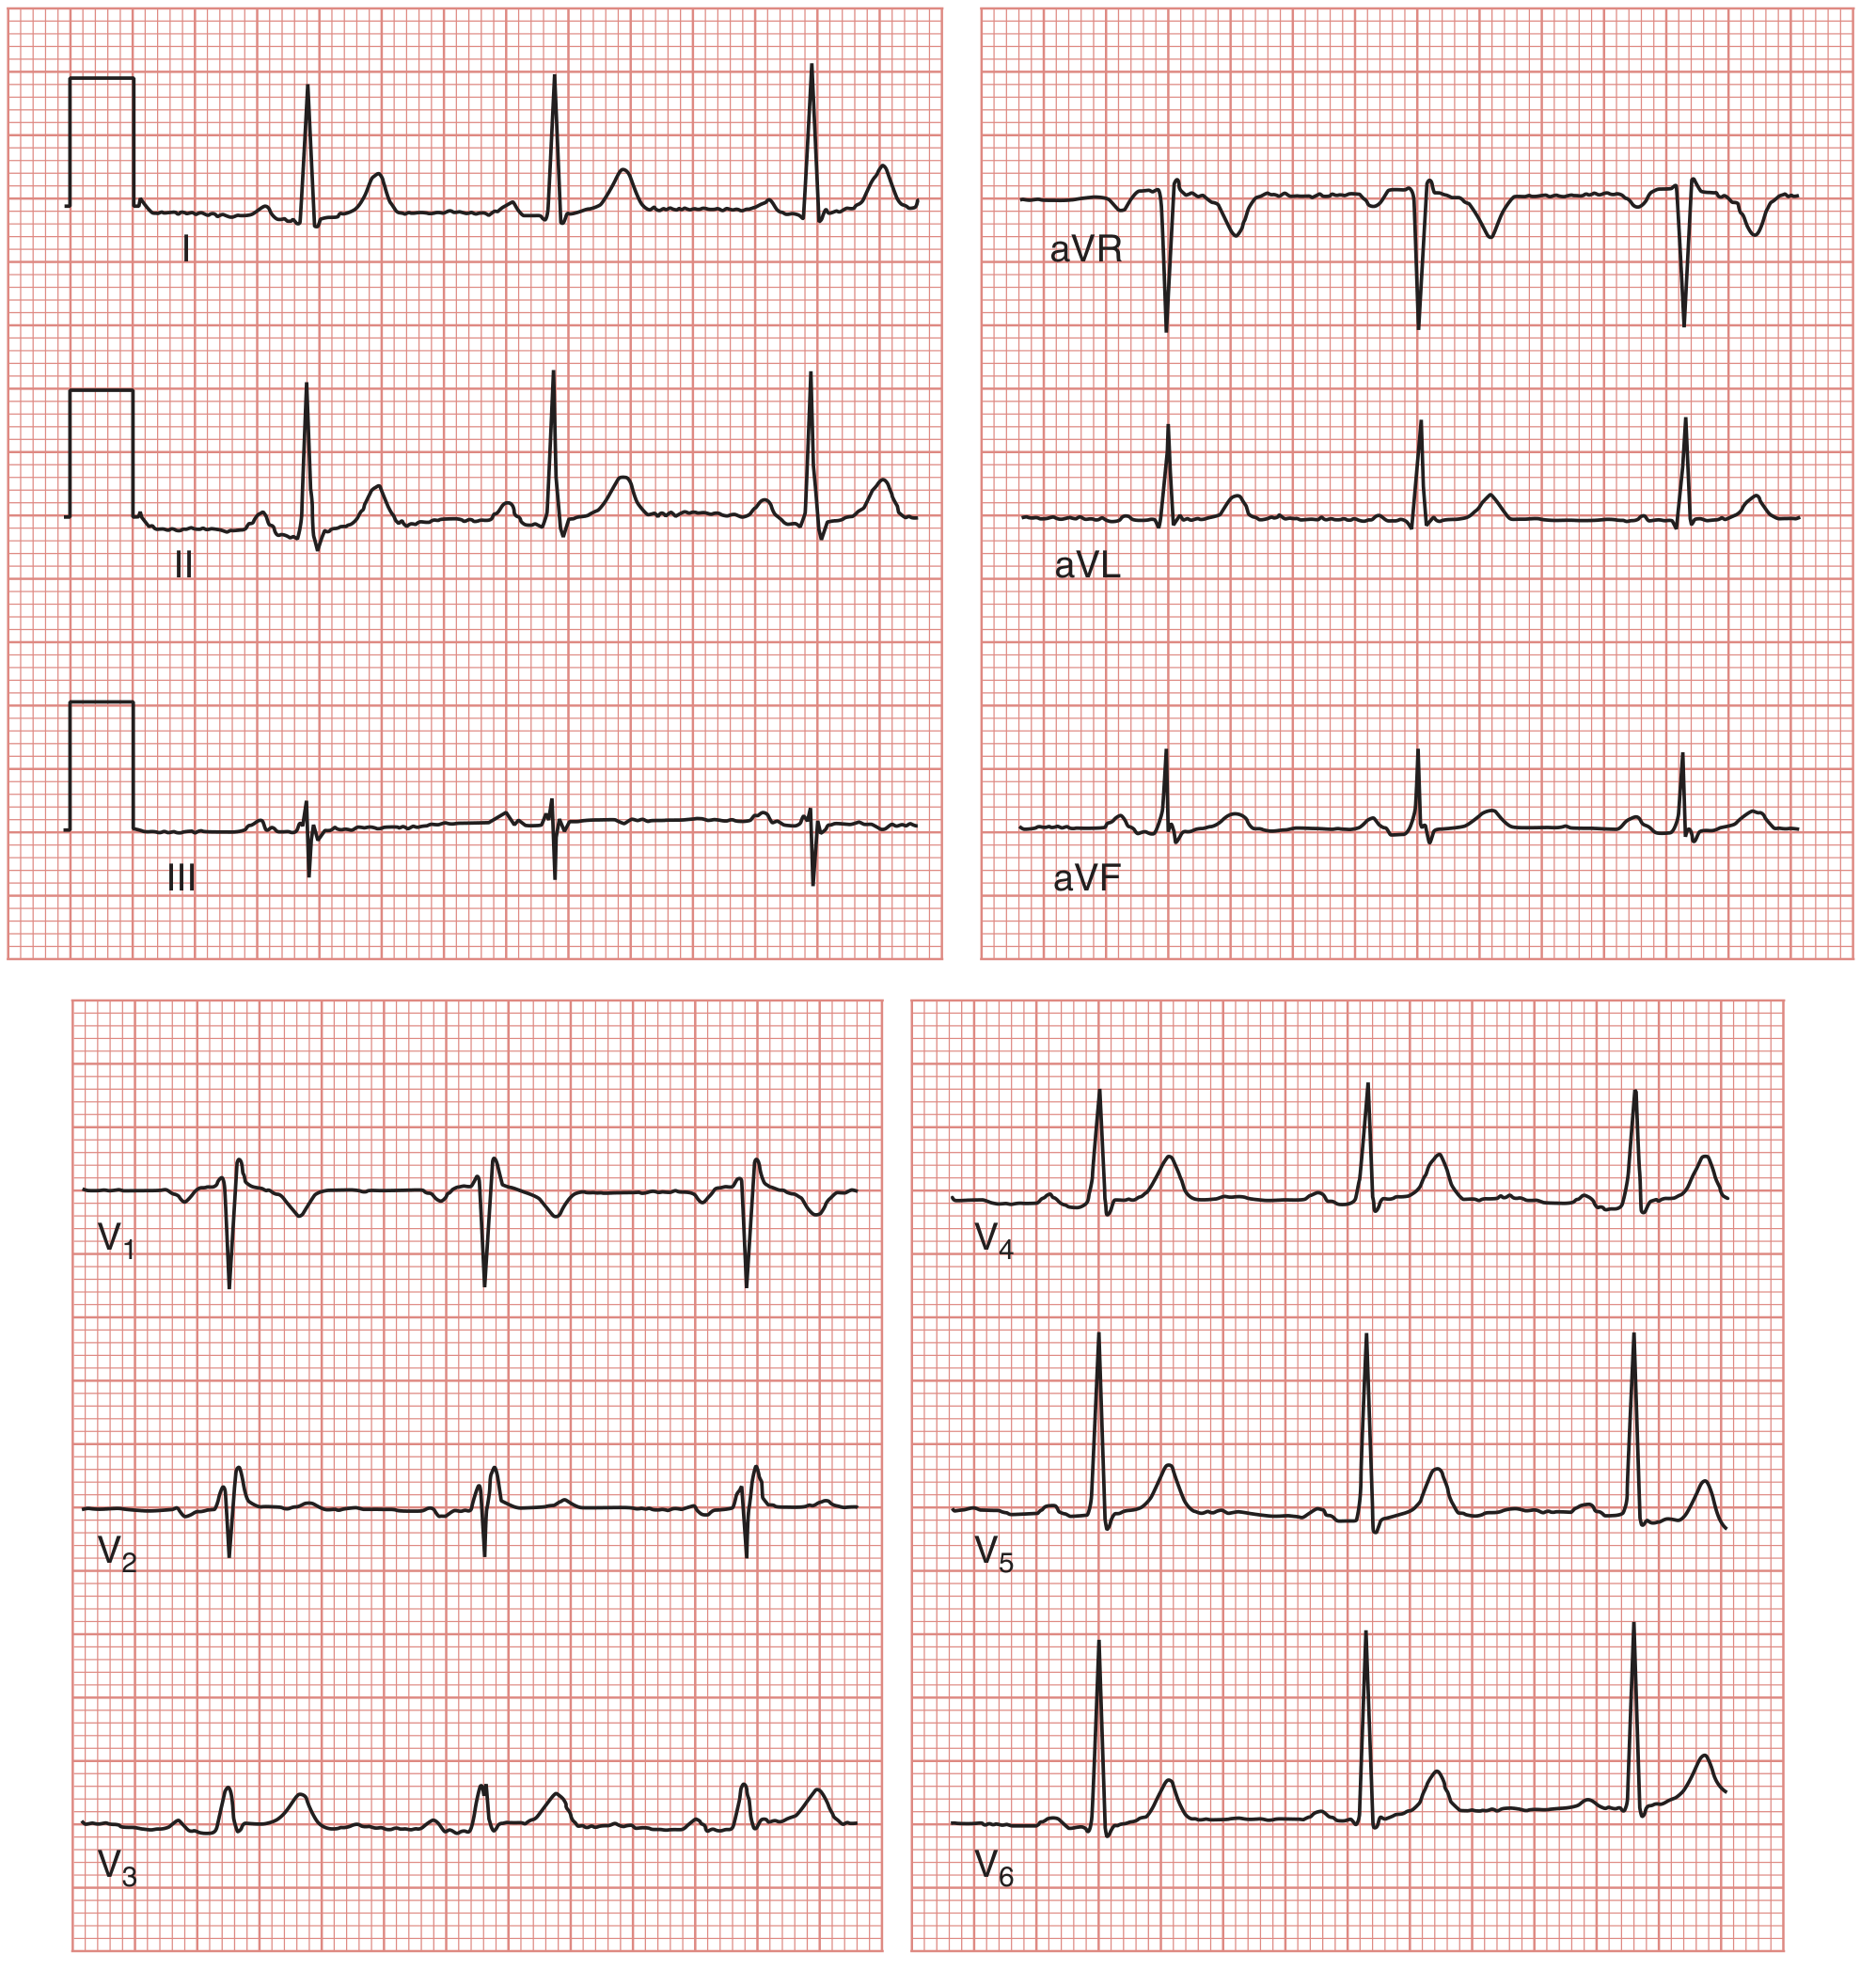
Normal 12-lead ECG from Medical Physiology (all 12 leads shown):
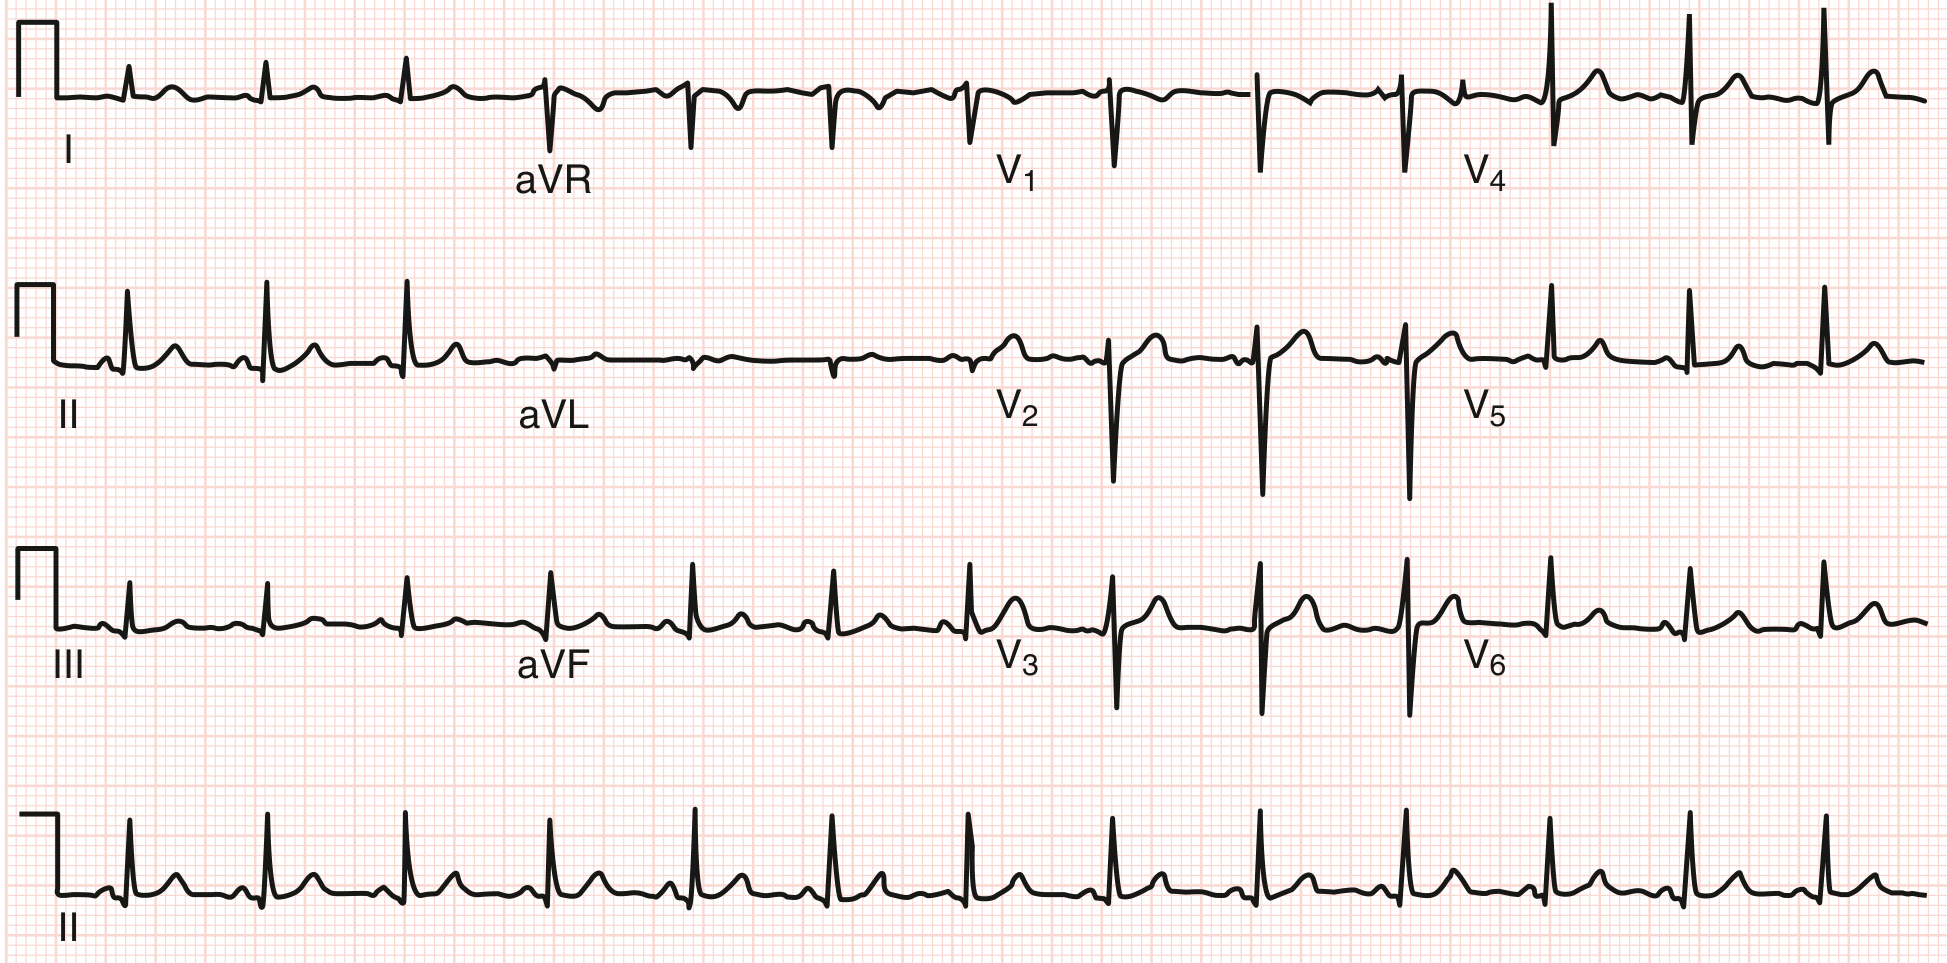
Normal 12-lead ECG from Goldman-Cecil Medicine:
The Systematic Approach (Harrison's 14-Point Checklist)
Always use the same order every time - most errors in ECG reading are errors of omission.
| Step | Parameter | What to assess |
|---|---|---|
| 1 | Standardization / Technical | 1 mV calibration pulse, paper speed, lead placement, artifacts |
| 2 | Rhythm | Regular vs. irregular; sinus vs. non-sinus |
| 3 | Heart rate | Quick method below |
| 4 | PR interval / AV conduction | 0.12-0.20 s (3-5 small boxes) |
| 5 | QRS interval | < 0.12 s (< 3 small boxes) |
| 6 | QT / QTc interval | Varies with rate; corrected QTc < 440-460 ms |
| 7 | Mean QRS axis | Normal: -30° to +90° |
| 8 | P waves | Morphology, duration, axis |
| 9 | QRS voltages | Amplitude in limb and precordial leads |
| 10 | Precordial R-wave progression | R wave grows from V1 to V5/V6 |
| 11 | Abnormal Q waves | >0.04 s wide or >25% of R wave height |
| 12 | ST segments | Elevation or depression from J point |
| 13 | T waves | Inversion, peaking, flattening |
| 14 | U waves | Small deflection after T wave |
Step-by-Step Breakdown
1. Heart Rate
Quick method (most common): Count the number of large boxes between two consecutive R waves, then use:
Rate = 300 ÷ (number of large boxes in R-R interval)
| Large boxes | Rate (bpm) |
|---|---|
| 1 | 300 |
| 2 | 150 |
| 3 | 100 |
| 4 | 75 |
| 5 | 60 |
| 6 | 50 |
- Normal: 60-100 bpm
- Bradycardia: < 60 bpm
- Tachycardia: > 100 bpm
2. Rhythm
Ask three questions (Medical Physiology):
- Where is the pacemaker? - Should be the SA node (normal sinus rhythm = upright P before every QRS in lead II)
- What is the conduction path? - SA node → AV node → His-Purkinje → ventricles
- Is it regular? - Compare R-R intervals; they should be equal
Normal sinus rhythm = regular rate 60-100, P wave before every QRS, upright P in I and II, inverted in aVR.
3. P Wave
- Represents atrial depolarization
- Normal: upright in leads I, II, aVF, V4-V6; inverted in aVR
- Duration < 0.12 s; amplitude < 2.5 mm
- Biphasic in V1 is normal
4. PR Interval
- Measured from start of P to start of QRS
- Normal: 0.12-0.20 s (3-5 small boxes)
- Short PR (< 0.12 s): pre-excitation (WPW), junctional rhythm
- Long PR (> 0.20 s): 1st degree AV block
5. QRS Complex
- Represents ventricular depolarization
- Normal duration: < 0.12 s (< 3 small boxes)
- Narrow QRS (< 0.10 s): supraventricular origin
- Wide QRS (≥ 0.12 s): bundle branch block, ventricular rhythm, hyperkalemia, pacing
- Capital letters (Q, R, S) = large amplitude; lowercase (q, r, s) = small amplitude
6. QT / QTc Interval
- Measured from start of QRS to end of T wave
- Represents total ventricular action potential duration
- Shortens at higher heart rates - always correct for rate (Bazett's formula: QTc = QT ÷ √RR)
- Normal QTc: < 440 ms (men), < 460 ms (women)
- Prolonged QTc: risk of torsades de pointes
7. QRS Axis
- Normal axis: -30° to +90° in the frontal plane
- Quick method: check leads I and aVF
- Both positive → normal axis (~0° to +90°)
- I positive, aVF negative → possible left axis deviation
- I negative, aVF positive → right axis deviation
- Both negative → extreme axis deviation ("northwest")
| Axis | Degrees | Cause |
|---|---|---|
| Normal | -30° to +90° | - |
| Left axis deviation | -30° to -90° | LBBB, left anterior fascicular block, inferior MI |
| Right axis deviation | +90° to +180° | RBBB, RVH, left posterior fascicular block, lateral MI |
8. ST Segment
- From end of QRS (J point) to start of T wave
- Normally isoelectric (at baseline)
- ST elevation: transmural ischemia/injury, pericarditis, early repolarization
- ST depression: subendocardial ischemia, reciprocal changes, digoxin effect
- In subendocardial ischemia, the ST vector points inward → ST depression in overlying leads
- In epicardial/transmural injury, the ST vector points outward → ST elevation in overlying leads
9. T Wave
- Represents ventricular repolarization
- Normally upright in I, II, V3-V6; inverted in aVR
- T-wave inversion: ischemia, hypertrophy, bundle branch block, PE
- Peaked T waves: hyperkalemia, early ischemia (hyperacute T waves)
10. U Wave
- Small deflection after the T wave, same polarity as T
- Most prominent in V2-V3
- Prominent U waves: hypokalemia, bradycardia
- Inverted U waves: ischemia, hypertension
Lead Groups to Assess Together
Examine ST segments and T waves in regional groupings (Goldman-Cecil):
| Region | Leads | Coronary artery |
|---|---|---|
| Inferior | II, III, aVF | RCA |
| Anterior | V1-V4 | LAD |
| Lateral | I, aVL, V5, V6 | LCx |
| Posterior | V7-V9 (or reciprocal V1-V2) | RCA or LCx |
| Septal | V1-V2 | LAD (septal branch) |
Key Normal Values Summary
| Parameter | Normal value |
|---|---|
| Heart rate | 60-100 bpm |
| PR interval | 0.12-0.20 s |
| QRS duration | < 0.12 s |
| QTc | < 440 ms (men), < 460 ms (women) |
| QRS axis | -30° to +90° |
| P wave amplitude | < 2.5 mm |
| P wave duration | < 0.12 s |
Sources: Harrison's Principles of Internal Medicine 22E, p. 1592; Medical Physiology (Boron & Boulpaep), pp. 708-817; Goldman-Cecil Medicine, pp. 701-736.
Would you like to go deeper into any specific area - arrhythmias, bundle branch blocks, MI patterns, axis deviation, or something else?
This is a shared conversation. Sign in to Orris to start your own chat.