
Explain in detail about about urine formation starting from blood enters into kidney and expels out as urine.....it's importance, hormone involvement.
urine formation nephron glomerular filtration reabsorption secretion diagram
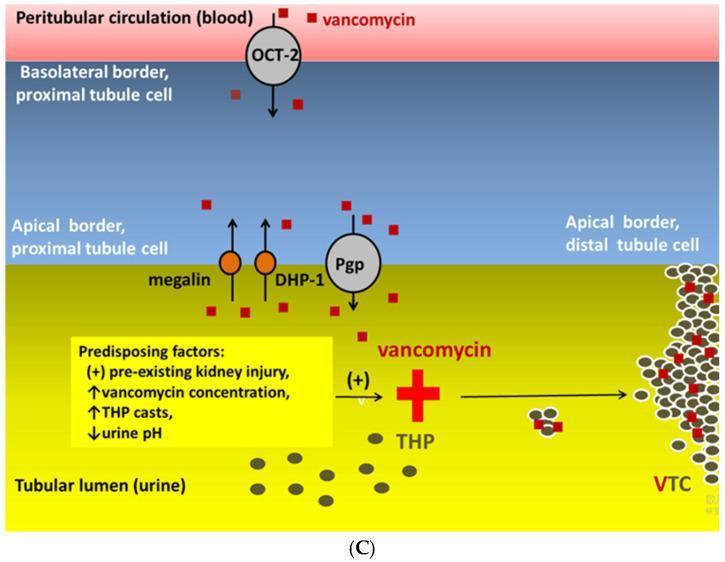
A medical pathophysiology diagram illustrating the formation of vancomycin-associated tubular casts (VTC) within the nephron. The schematic depicts four horizontal compartments: the peritubular circulation (blood), the proximal tubule cell (basolateral and apical borders), and the tubular lumen (urine). Vancomycin molecules, represented as red squares, are shown entering the proximal tubule cell from the blood via the OCT-2 (organic cation transporter 2) at the basolateral border. At the apical border, reabsorption is mediated by megalin and dehydropeptidase-1 (DHP-1), while P-glycoprotein (Pgp) facilitates transport between the lumen and distal tubule cells. In the tubular lumen, vancomycin interacts with Tamm-Horsfall glycoprotein (THP), leading to the formation of large VTC aggregates (indicated by a red plus sign). A yellow text box highlights predisposing factors for VTC formation, including pre-existing kidney injury, elevated vancomycin concentration, increased THP casts, and decreased urine pH. This diagram serves as an educational tool for understanding the localized necrotic and obstructive mechanisms of vancomycin-induced acute kidney injury (VA-AKI).
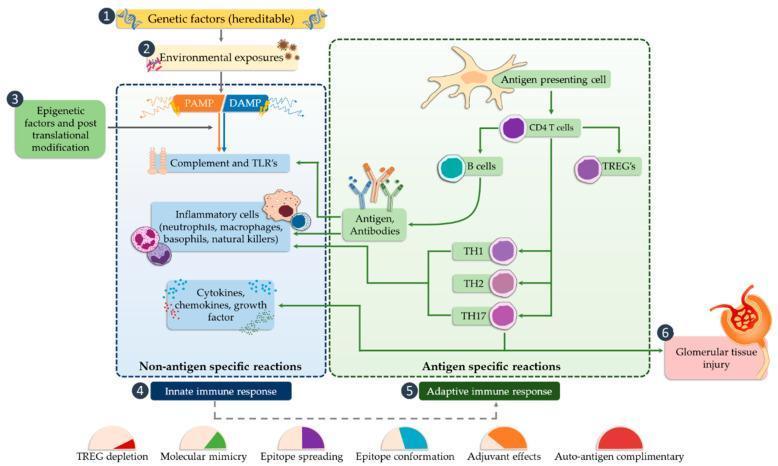
This pathophysiology flow diagram illustrates the multi-step immune signaling pathway leading to glomerular tissue injury in the nephron. The process is initiated by three primary drivers: genetic factors (heritable), environmental exposures, and epigenetic factors coupled with post-translational modifications. These drivers trigger the 'Innate Immune Response' (Non-antigen specific reactions), characterized by the activation of Pathogen-Associated Molecular Patterns (PAMPs) and Damage-Associated Molecular Patterns (DAMPs). This activates the complement system, Toll-Like Receptors (TLRs), and inflammatory cells (neutrophils, macrophages, basophils, NK cells), leading to the release of cytokines, chemokines, and growth factors. The pathway then transitions to the 'Adaptive Immune Response' (Antigen-specific reactions), where antigen-presenting cells activate CD4+ T cells, B cells, and TREGs. Further differentiation into TH1, TH2, and TH17 cells, along with antigen-antibody complex formation, culminates in glomerular tissue injury. The diagram also identifies key mechanisms of immune dysregulation below the main flow, including TREG depletion, molecular mimicry, epitope spreading, epitope conformation, adjuvant effects, and auto-antigen complementarity.
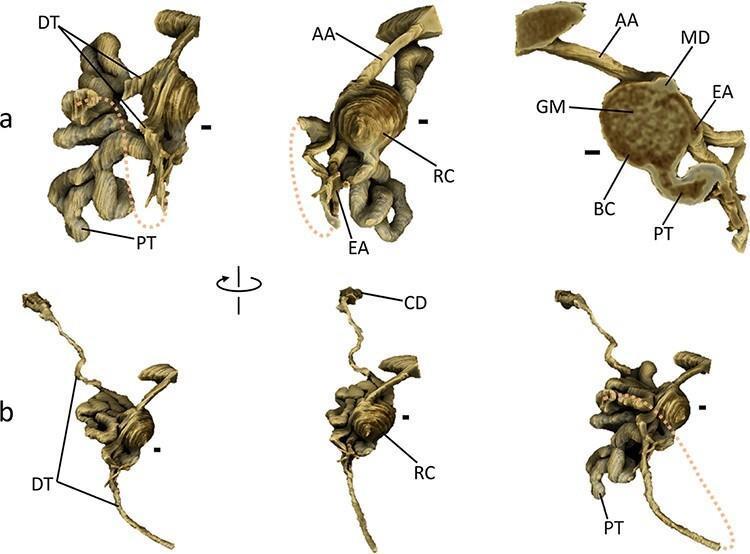
Anatomical diagram featuring high-resolution 3D renderings of a single mouse nephron, highlighting renal microstructure and spatial arrangement. Panel (a) provides detailed views of the renal corpuscle (RC), demonstrating the spherical Bowman's capsule (BC) and internal glomerulus (GM). It clearly illustrates the vascular pole with the afferent arteriole (AA), efferent arteriole (EA), and the macula densa (MD) of the distal tubule (DT) forming a v-shaped contact point. The tubular pole shows the exit of the highly convoluted proximal tubule (PT). Panel (b) illustrates the longitudinal progression from the renal corpuscle through the PT and DT to the collecting duct (CD). The rendering distinguishes between the intensely convoluted segments near the corpuscle and the straighter distal segments of the tubules. Key educational concepts include the juxtaglomerular apparatus anatomy, the morphology of glomerular filtration components, and the physical relationship between various segments of the nephron and their associated vasculature, essential for understanding renal physiology and pathology.
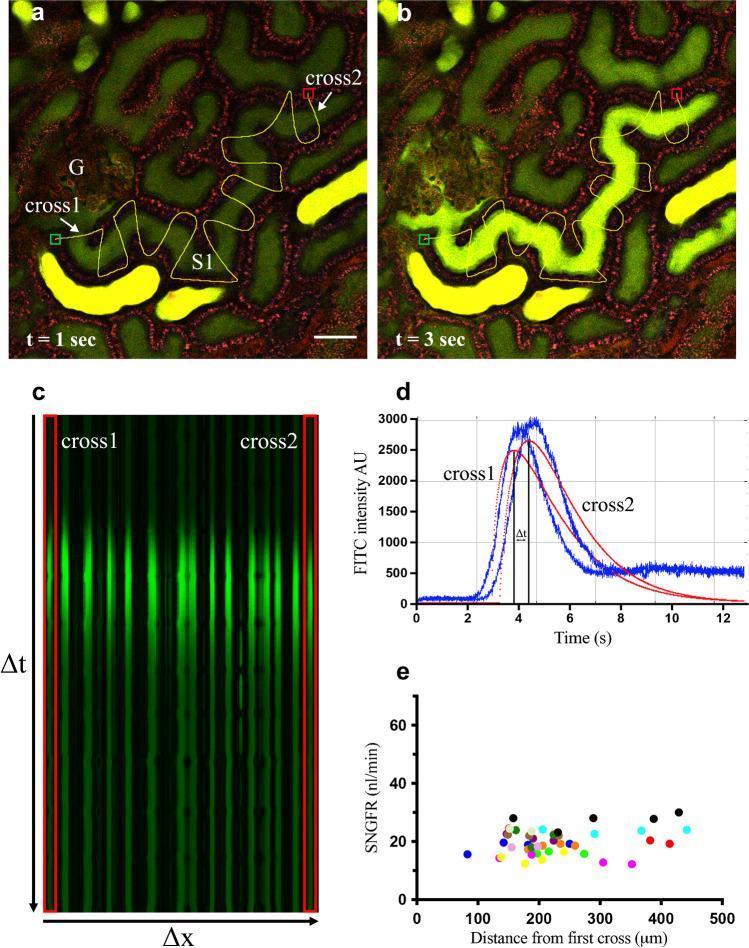
This composite educational image illustrates the 'linescan method' for in vivo measurement of single-nephron glomerular filtration rate (SNGFR). Panels (a) and (b) are multiphoton microscopy (MPM) frames showing the filtration of a green fluorescent dye (FITC-dextran, 3–5 kDa) from a glomerulus (G) into the early proximal tubule (S1) at t=1 second and t=3 seconds. The image demonstrates the temporal progression of the fluorescent bolus along the tubular lumen. Panel (c) displays the resulting x–t (space-time) linescan plot, where vertical green lines represent the dye crossing hand-drawn perpendicular paths (cross1 and cross2). The downward shift of peak fluorescence intensity along the y-axis (time) indicates the velocity of fluid movement. Panel (d) shows quantitative fluorescence intensity curves over time for two selected crossings, used to calculate the time delay (ΔT) between peak bolus concentrations. Panel (e) is a scatter plot validating the consistency of SNGFR measurements (nl/min) across varying distances from the glomerulus, demonstrating the method's precision in assessing renal physiology and filtration dynamics.
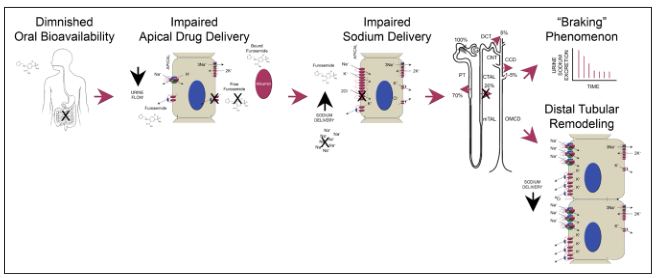
Summary : This figure illustrates the sequential mechanisms underlying diuretic resistance, specifically focusing on furosemide, from diminished oral bioavailability to distal tubular remodeling and the "braking" phenomenon in the nephron. flowchart: # Nodes : • Diminished Oral Bioavailability (text, human outline with stomach marked, furosemide molecule, downward arrow for urine flow) • Impaired Apical Drug Delivery (rectangular cell diagram, furosemide molecules, albumin, Na+ and K+ channels, blocked delivery indicated) • Impaired Sodium Delivery (rectangular cell diagram, furosemide, Na+ and K+ channels, blocked sodium delivery) • "Braking" Phenomenon (nephron schematic, percentage sodium reabsorption at different segments: PT 70%, TAL 20%, DCT 7%, CCD 5%; small line graph showing decrease in sodium excretion over time) • Distal Tubular Remodeling (rectangular cell diagrams, increased sodium delivery, altered channel expression) # Connectors : • Arrows connect each node in left-to-right sequence, indicating progression of mechanisms. • Each arrow is solid and points to the next step in the process. # Layout : • Linear, left-to-right arrangement. • Each node is visually separated and contains both text and schematic/chemical illustrations. • The nephron schematic is centrally placed, with percentages and segment labels (PT, TAL, CTAL, DCT, CCD, OMCD, CN). # Analysis : • The flowchart demonstrates a stepwise progression: initial reduction in oral bioavailability leads to impaired drug delivery at the apical membrane, which then causes impaired sodium delivery in the nephron. This results in the "braking" phenomenon, where sodium excretion decreases over time, and ultimately leads to distal tubular remodeling with altered sodium channel expression. The figure visually links each mechanism, highlighting how resistance to diuretics develops through multiple renal and pharmacokinetic adaptations.
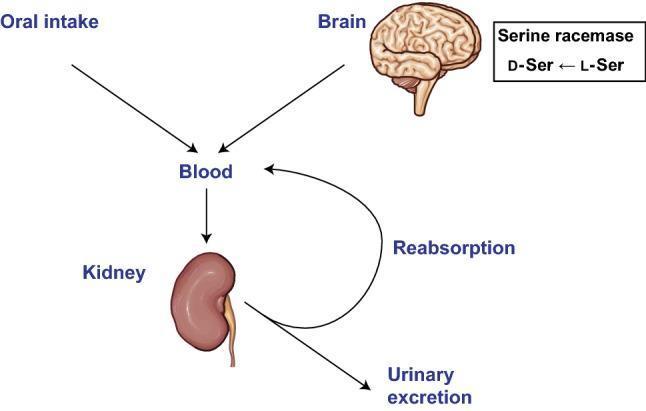
This pathophysiology diagram illustrates the intra-body dynamics and renal regulation of D-amino acids (specifically D-serine). The flowchart identifies two primary entry points into the systemic circulation: oral intake and endogenous production in the brain. In the brain, the enzyme serine racemase is depicted converting L-serine (L-Ser) to D-serine (D-Ser). Arrows show the transport of these D-amino acids via the blood to the kidney. The renal processing involves two outcomes following glomerular filtration: urinary excretion and reabsorption back into the bloodstream. The diagram serves as an educational summary of how D-amino acid levels are maintained through a balance of dietary intake, neural synthesis, and renal clearance. It highlights the kidney's critical role in systemic homeostasis, which is clinically relevant for utilizing D-amino acids as biomarkers for kidney disease and monitoring glomerular filtration rates (GFR).
kidney nephron anatomy renal blood supply afferent efferent arteriole glomerulus
Anatomical diagram featuring high-resolution 3D renderings of a single mouse nephron, highlighting renal microstructure and spatial arrangement. Panel (a) provides detailed views of the renal corpuscle (RC), demonstrating the spherical Bowman's capsule (BC) and internal glomerulus (GM). It clearly illustrates the vascular pole with the afferent arteriole (AA), efferent arteriole (EA), and the macula densa (MD) of the distal tubule (DT) forming a v-shaped contact point. The tubular pole shows the exit of the highly convoluted proximal tubule (PT). Panel (b) illustrates the longitudinal progression from the renal corpuscle through the PT and DT to the collecting duct (CD). The rendering distinguishes between the intensely convoluted segments near the corpuscle and the straighter distal segments of the tubules. Key educational concepts include the juxtaglomerular apparatus anatomy, the morphology of glomerular filtration components, and the physical relationship between various segments of the nephron and their associated vasculature, essential for understanding renal physiology and pathology.
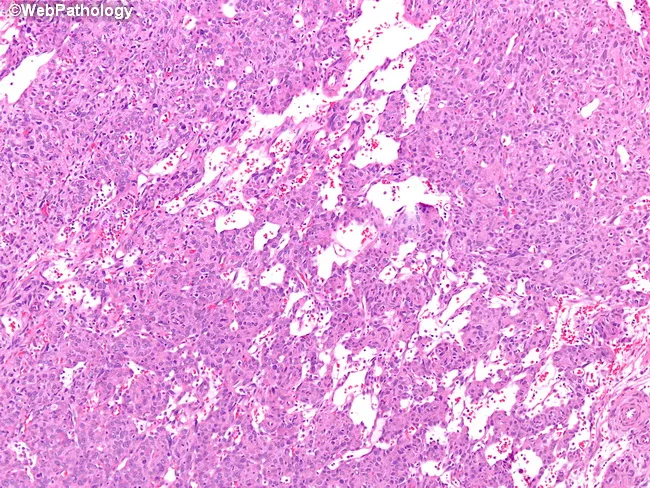
This is a high-vascular renal tumor histology image captured from a hematoxylin and eosin-stained section of Juxtaglomerular cell tumor (JGCT) of the kidney. The slice demonstrates densely packed, monomorphic tumor cells with uniform round to oval nuclei and eosinophilic cytoplasm arranged in sheets and cords. Interspersed small venules and muscular arterioles create a conspicuous vascular network; branching, stag-horn–type vessels resembling hemangiopericytoma are a salient feature. The tumor arises from juxtaglomerular cells of the afferent arteriole in the juxtaglomerular apparatus, a specialized smooth muscle lineage that normally regulates blood pressure via renin release. The neoplasm is typically well circumscribed and highly vascular, with scant cytoplasm and minimal pleomorphism, which helps distinguish it from renal cell carcinoma and other hypervascular renal lesions. Clinically, JGCT often presents with secondary hypertension due to renin secretion and is considered benign or indolent; surgical excision or nephron-sparing approaches are curative in many cases. Immunohistochemical or molecular testing may show renin expression in tumor cells, supporting diagnosis. For education and research, this image demonstrates characteristic vascular patterns, including stag-horn vasculature and perivascular monotony, enabling recognition of renin-producing renal neoplasms on histology slides. This image is educational for pathologists, clinicians, and trainees, and aids differential diagnosis and management.
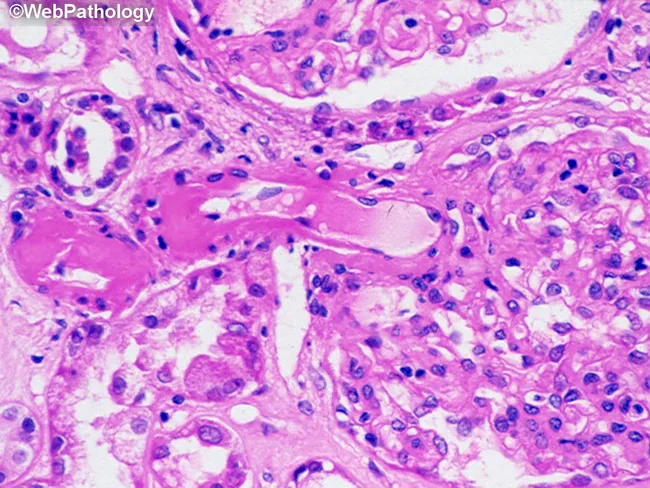
Light microscopic histology image of renal parenchyma showing hyaline arteriolosclerosis in both afferent and efferent arterioles, a vascular lesion characteristic of diabetic nephropathy. The tissue is a kidney biopsy specimen stained with Hematoxylin and Eosin (H&E). The arteriolar walls appear thickened with homogeneous eosinophilic hyaline material that narrows lumens, consistent with progressive hyalinosis. The glomeruli may display mesangial expansion and subtle sclerosis in larger examples, while surrounding tubules and interstitium show variable chronic change. This vascular involvement reduces renal perfusion, contributing to ischemic injury and progressive proteinuria typical of diabetes mellitus–related kidney disease. The image highlights a relatively rare finding of arteriolar hyalinosis in both afferent and efferent arterioles, which can help distinguish diabetic nephropathy from non-diabetic hypertensive arteriolosclerosis where efferent arteriolar involvement is less common. Accurate recognition of these hyaline deposits is essential for differential diagnosis, prognosis, and guiding therapy aimed at glycemic control and blood pressure management. Clinically, the presence of arteriolar hyalinosis correlates with decreased renal filtration rate and can precede overt nephrotic syndrome. In educational and research contexts, this image is valuable for teaching diabetic microvascular complications, renal histopathology, and correlating histology with clinical labs such as microalbuminuria and serum creatinine elevations.
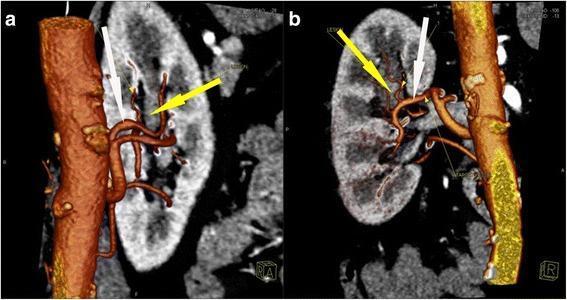
This diagnostic image set consists of three-dimensional Computed Tomography Angiography (CTA) reconstructions showcasing the vascular anatomy of the left kidney in a patient with renal pelvis carcinoma. Panel (a) provides an anterior view, and panel (b) shows a right-lateral/oblique view. The abdominal aorta is rendered in a textured brown hue, from which the renal artery originates and bifurcates into segmental branches. The kidney parenchyma is visualized in a grayscale volumetric rendering. A yellow arrow points to the tumor region located within the upper calyx of the kidney. A white arrow highlights the specific segmental arterial branch that provides the primary blood supply to this neoplastic lesion. The visualization demonstrates the precise anatomical relationship between the arterial supply and the soft tissue density in the renal pelvis, a key diagnostic feature for preoperative planning in nephron-sparing surgery. This imaging modality is essential for identifying vascular variations and ensuring targeted segmental clamping during surgical intervention for renal tumors.
Urine Formation: From Blood Entry to Excretion
Overview
Urinary Excretion Rate = Filtration Rate - Reabsorption Rate + Secretion Rate
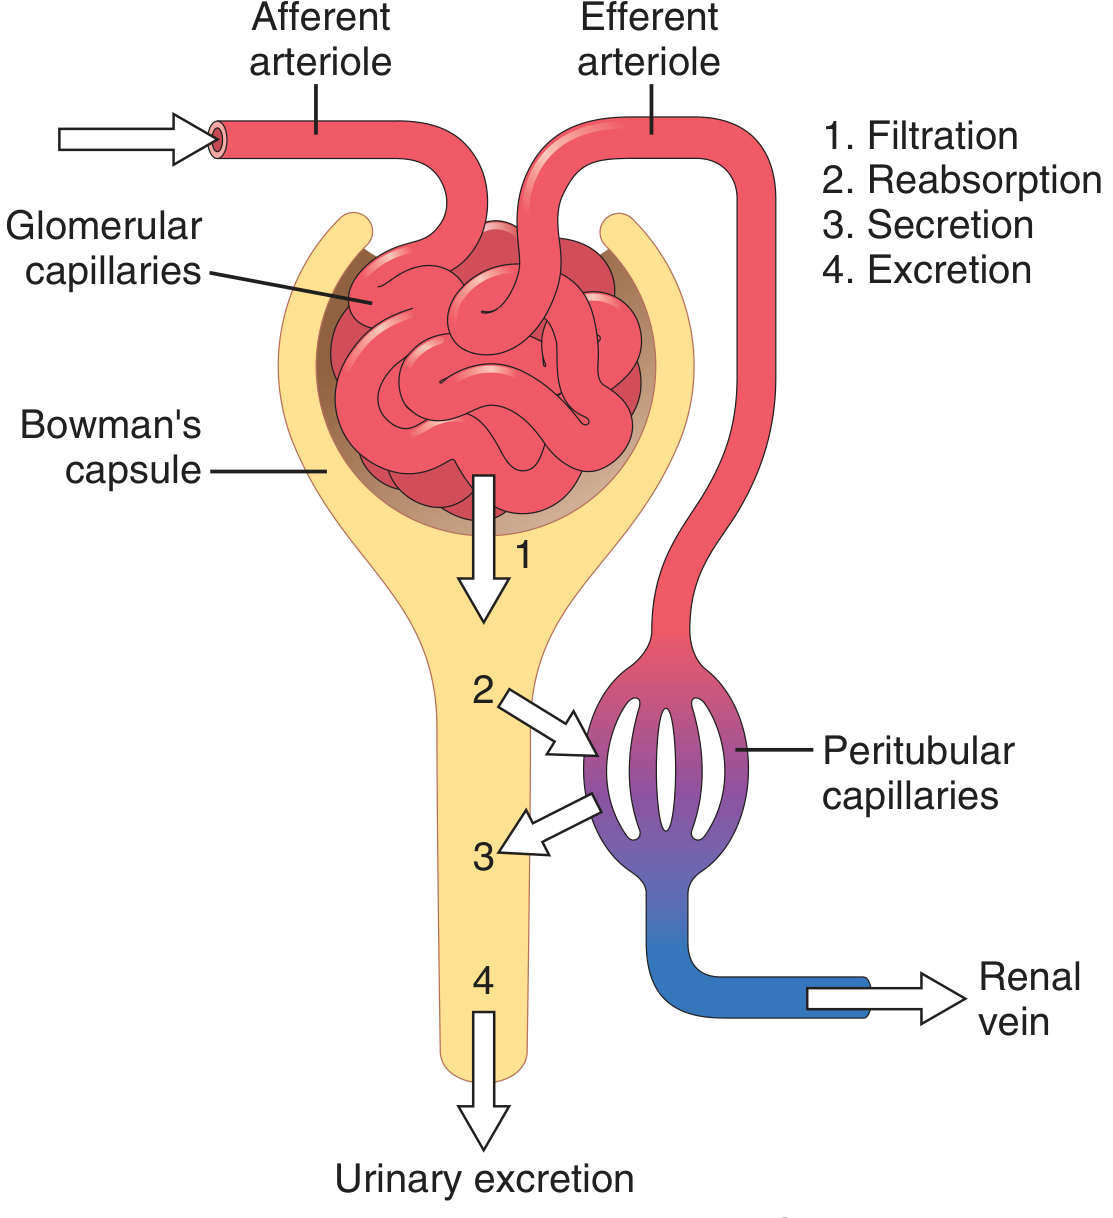
Step 1: Blood Enters the Kidney - Renal Vasculature
- Renal artery → Interlobar arteries → Arcuate arteries → Interlobular arteries → Afferent arterioles
- Peritubular capillaries (cortical nephrons) - wrap around the tubular segments
- Vasa recta (juxtamedullary nephrons) - long hairpin capillaries that descend deep into the medulla, essential for producing concentrated urine
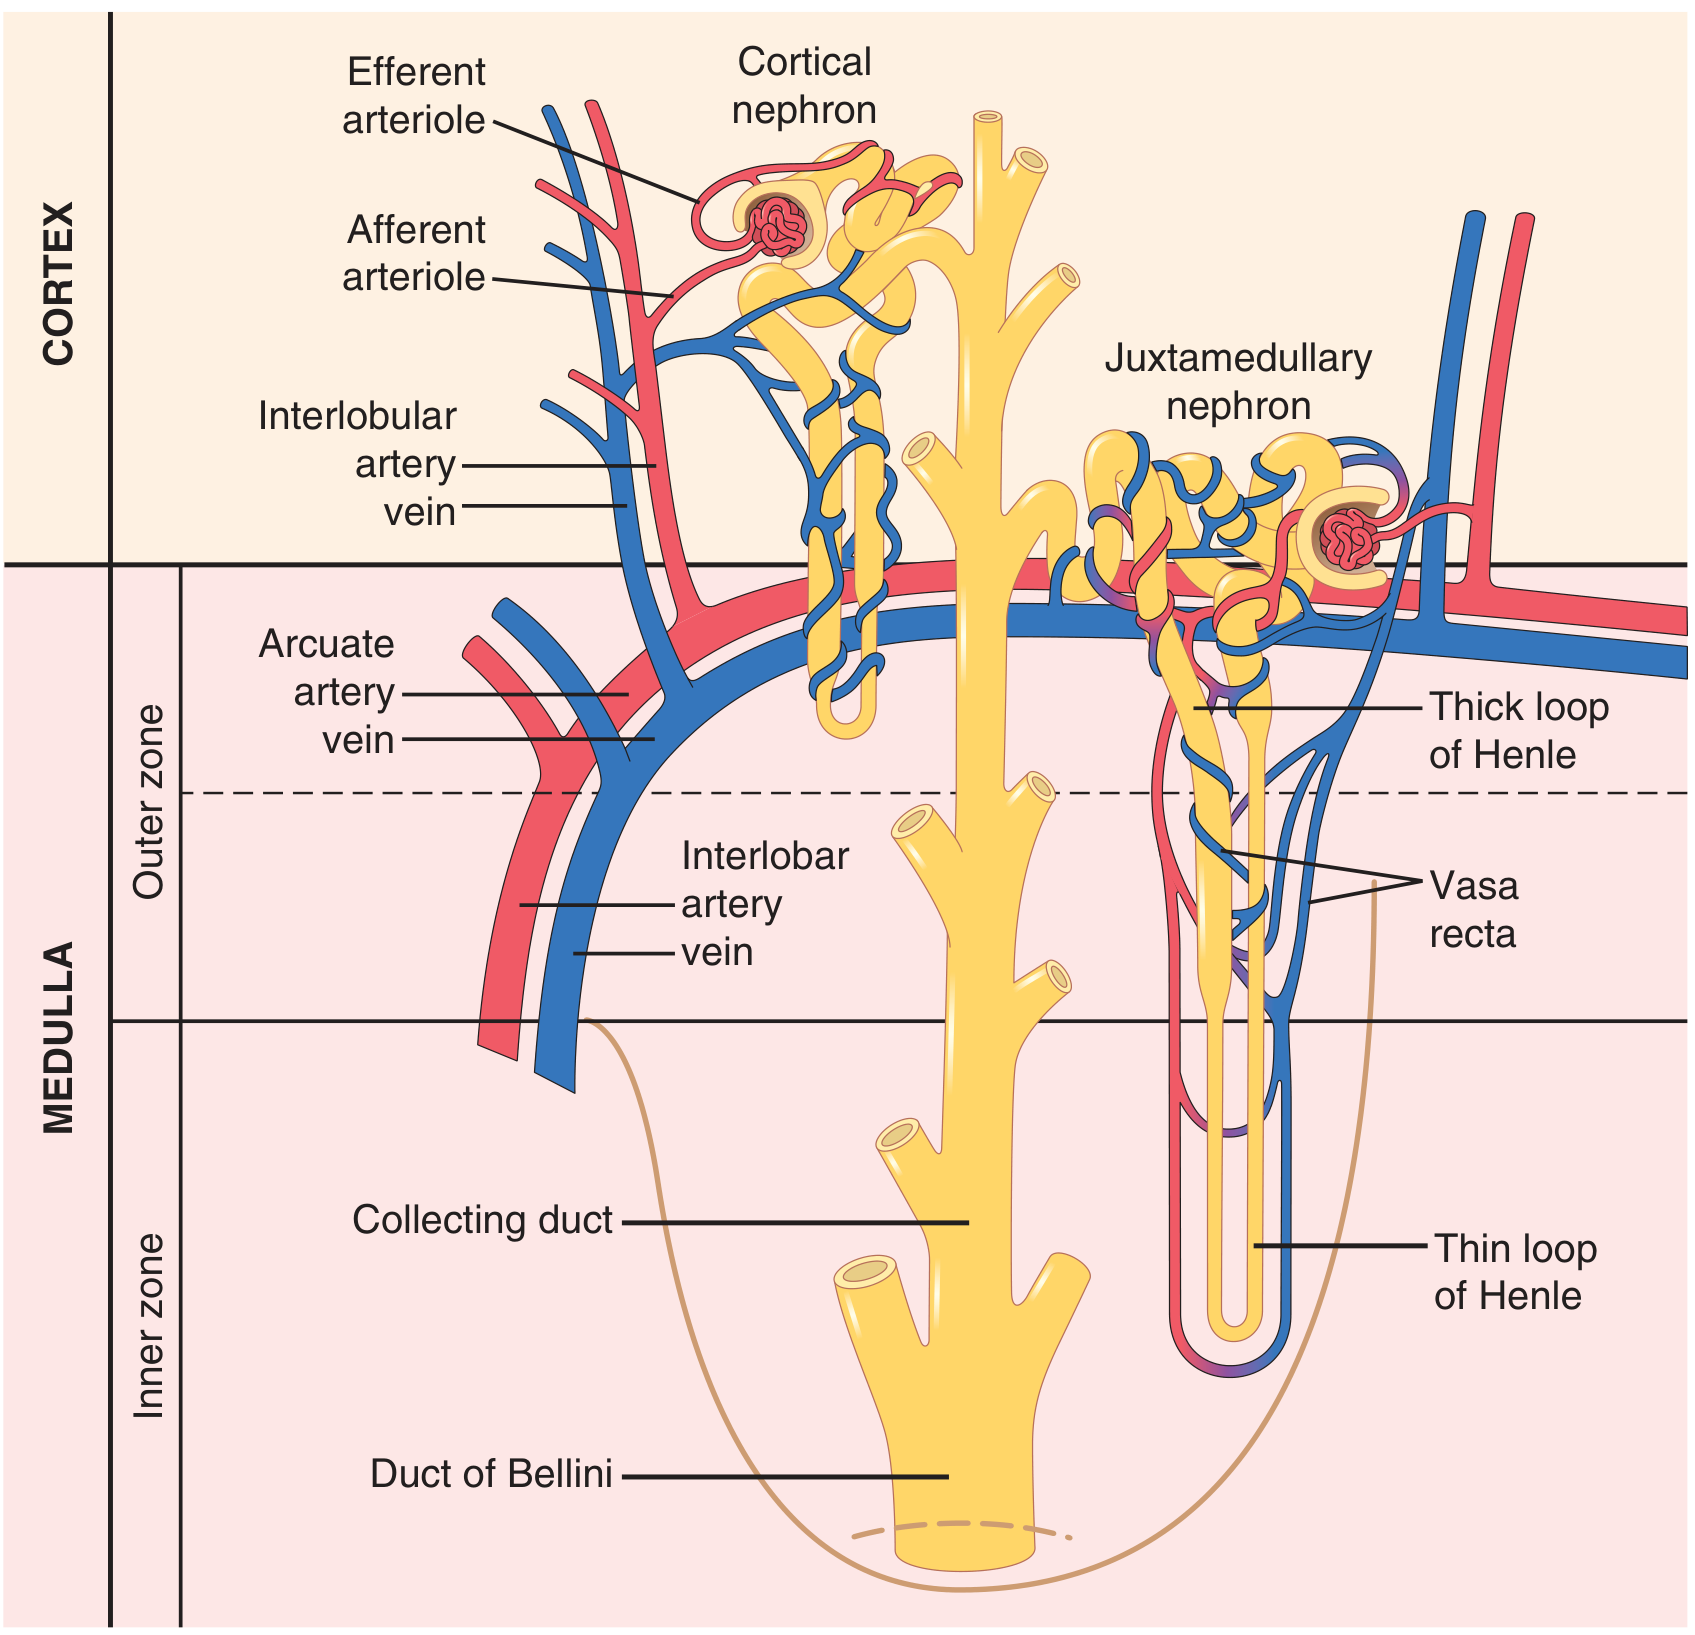
- Cortical nephrons (70-80%): glomeruli in outer cortex, short loops of Henle
- Juxtamedullary nephrons (20-30%): glomeruli near the medulla, long loops of Henle + vasa recta - these are critical for concentrating urine
Step 2: Glomerular Filtration
Mechanism
- Capillary endothelium - fenestrated, prevents blood cells
- Glomerular basement membrane (GBM) - charge and size barrier, blocks proteins
- Podocyte foot processes (slit diaphragm) - final molecular filter
What Gets Filtered
Glomerular Filtration Rate (GFR)
- Normal GFR ≈ 125 mL/min or 180 L/day
- This is regulated by the balance of Starling forces (hydrostatic vs. oncotic pressure) across the glomerular capillaries
- Net filtration pressure ≈ 10 mmHg
Forces Governing GFR
| Force | Value | Effect |
|---|---|---|
| Glomerular capillary pressure | ~60 mmHg | Promotes filtration |
| Bowman's capsule pressure | ~18 mmHg | Opposes filtration |
| Glomerular oncotic pressure | ~32 mmHg | Opposes filtration |
| Net filtration pressure | ~10 mmHg | Filtration |
Step 3: Tubular Reabsorption (Segment by Segment)
A. Proximal Convoluted Tubule (PCT) - Bulk Reabsorption
- Na+: Enters cells via Na+/H+ exchanger and Na+-glucose cotransporter; exits via Na+/K+-ATPase on the basolateral side
- Glucose: 100% reabsorbed via SGLT2 (sodium-glucose co-transporter); none normally appears in urine
- Amino acids: 100% reabsorbed
- HCO3-: ~85% reabsorbed (linked to H+ secretion by carbonic anhydrase)
- Water: Follows osmotically via aquaporin-1
- Cl-, K+, Ca2+: Substantial reabsorption occurs here
- Urea: ~50% passively reabsorbed
B. Loop of Henle - Countercurrent Multiplication
- Freely permeable to water, less so to solutes
- Water leaves → filtrate becomes hyperosmotic as it descends
- Actively pumps Na+, K+, 2Cl- out via NKCC2 (the target of loop diuretics like furosemide)
- Impermeable to water - tubular fluid becomes dilute (~100 mOsm) as it ascends
- This segment builds the interstitial osmotic gradient (up to 1200 mOsm in the inner medulla)
C. Distal Convoluted Tubule (DCT)
- Reabsorbs ~5-10% of filtered Na+ via Na+/Cl- cotransporter (NCC) - the target of thiazide diuretics
- Regulated by parathyroid hormone (PTH) for Ca2+ reabsorption
- Fine-tunes electrolyte balance
D. Collecting Duct - Hormonal Fine-Tuning
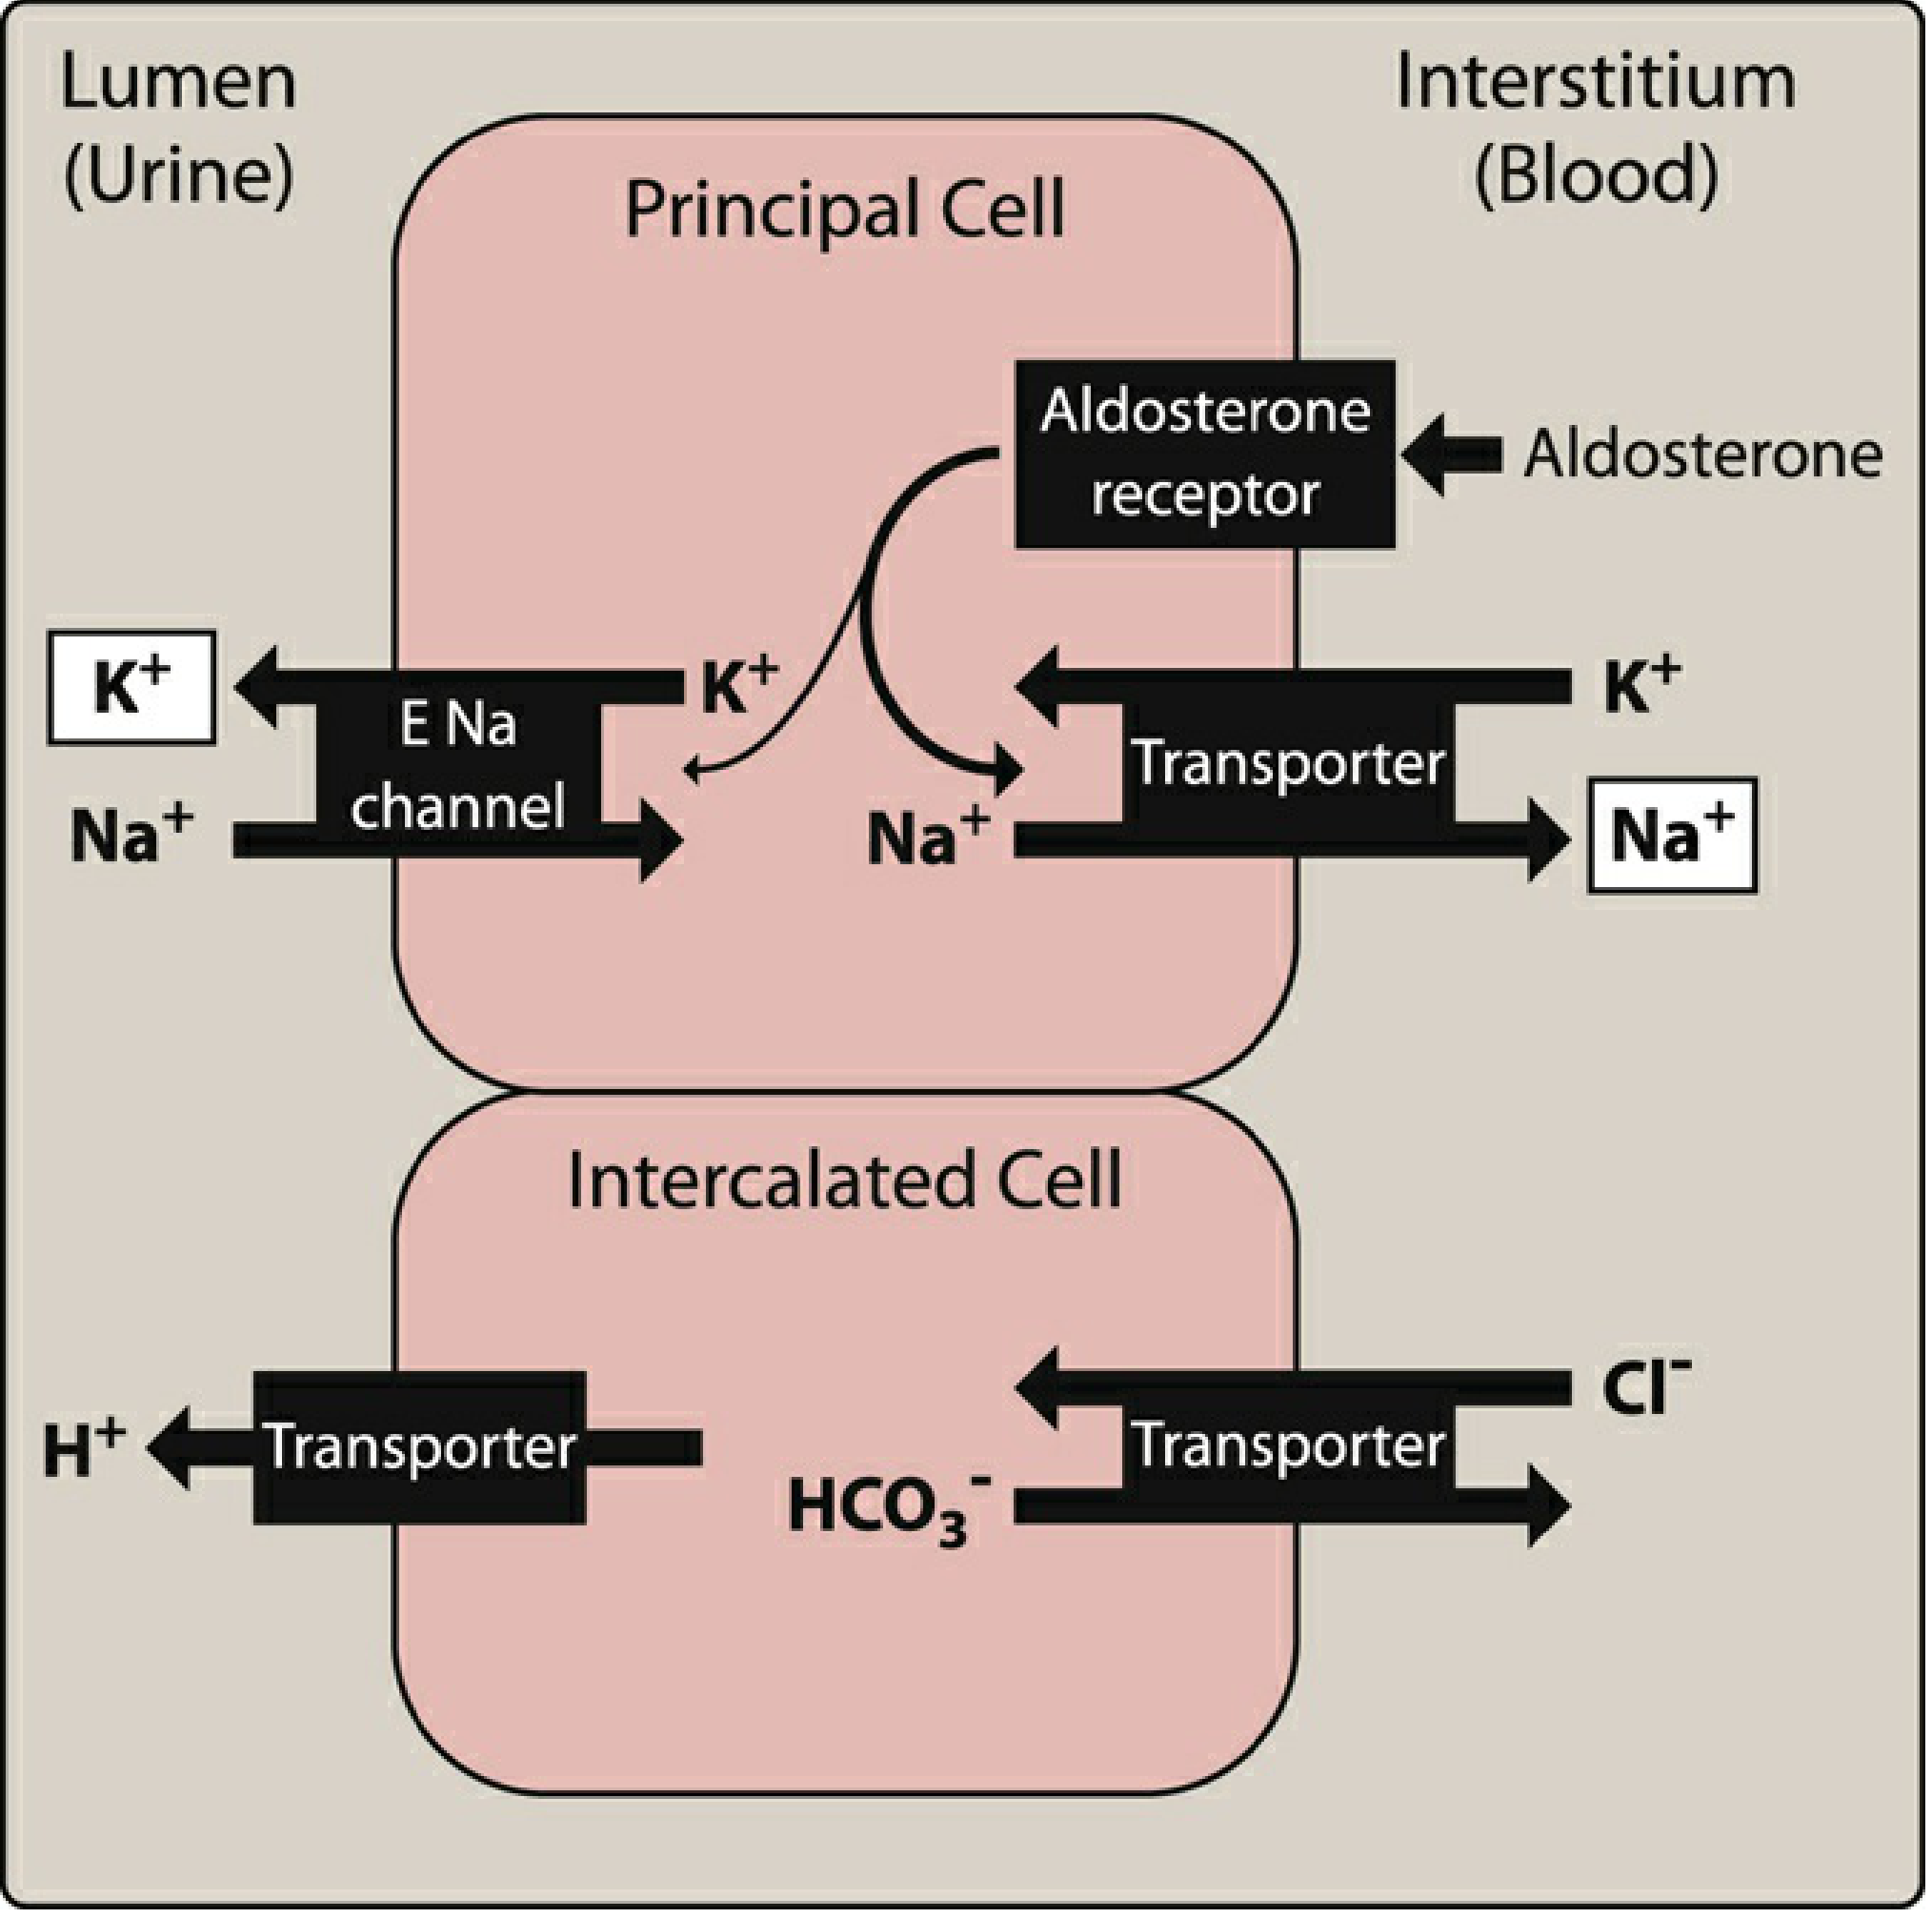
- Na+ reabsorption: via epithelial sodium channels (ENaC) - regulated by aldosterone
- K+ secretion: into the lumen
- Water reabsorption: via aquaporin-2 channels - regulated by ADH/vasopressin
- H+ secretion (type A) - regulates acid-base balance
- HCO3- secretion (type B) - in alkalosis
Step 4: Tubular Secretion
| Substance | Site of Secretion |
|---|---|
| H+ ions | PCT, collecting duct |
| K+ ions | Collecting duct (principal cells) |
| NH4+ (ammonium) | PCT and loop of Henle |
| Creatinine | Slight PCT secretion |
| Organic acids (urate, penicillin, PAH) | PCT |
| Drugs (metformin, methotrexate) | PCT |
Step 5: Urine Concentration - The Countercurrent System
-
Medullary osmotic gradient: Built by the thick ascending limb pumping NaCl into the interstitium (without water), creating a gradient from ~300 mOsm in the cortex to ~1200 mOsm deep in the medulla
-
Urea recycling: Urea diffuses out of the inner medullary collecting duct into the interstitium, further contributing to the osmotic gradient (up to 40% of medullary osmolarity)
-
Vasa recta: These hairpin capillaries use countercurrent exchange to remove reabsorbed water and solutes WITHOUT washing out the osmotic gradient
-
ADH action: When ADH is present, it inserts aquaporin-2 channels into collecting duct cells, allowing water to follow the osmotic gradient out into the hypertonic medullary interstitium - producing concentrated (small volume) urine
Step 6: Micturition (Bladder Emptying)
- Micturition reflex: Spinal cord reflex via pelvic nerves contracts the detrusor muscle (smooth muscle)
- Internal sphincter (smooth, involuntary) relaxes
- External sphincter (skeletal, voluntary) can be consciously held until voiding is appropriate
- Voiding occurs via coordinated detrusor contraction + sphincter relaxation
Hormonal Regulation of Urine Formation
1. Antidiuretic Hormone (ADH / Vasopressin)
- Source: Synthesized in hypothalamus (supraoptic/paraventricular nuclei), stored and released from posterior pituitary
- Stimulus: Increased plasma osmolarity (primary trigger, via hypothalamic osmoreceptors), decreased blood volume/pressure (via baroreceptors), angiotensin II, pain, nausea
- Inhibited by: Alcohol, ANP, alpha-adrenergic agonists
- Action: Binds V2 receptors on principal cells of late distal tubule and collecting duct → activates adenylyl cyclase → PKA phosphorylates aquaporin-2 vesicles → inserts aquaporin-2 into apical membrane → massive water reabsorption
- Effect: Concentrated, low-volume urine; restoration of osmolarity and blood volume
2. Aldosterone
- Source: Adrenal cortex (zona glomerulosa)
- Stimulus: Angiotensin II (the major stimulus), hyperkalemia, ACTH
- Action: Binds intracellular mineralocorticoid receptors in principal cells of collecting duct → increases synthesis of ENaC channels and Na+/K+-ATPase pumps → increased Na+ reabsorption + K+ secretion
- Effect: Retains Na+ (and water follows), excretes K+ and H+; raises blood pressure
3. Renin-Angiotensin-Aldosterone System (RAAS)
- Renin is released by juxtaglomerular (JG) cells of the afferent arteriole when:
- Renal artery pressure falls
- Macula densa senses decreased NaCl delivery to DCT
- Sympathetic stimulation (beta-1 receptors)
- Renin cleaves angiotensinogen (liver) → Angiotensin I → converted by ACE (lung) → Angiotensin II
- Angiotensin II:
- Constricts efferent arteriole (increases GFR filtration fraction)
- Directly stimulates proximal tubule Na+ reabsorption
- Stimulates aldosterone release
- Stimulates ADH release
- Causes thirst
4. Atrial Natriuretic Peptide (ANP) / BNP
- Source: Atrial myocytes (ANP), ventricular myocytes (BNP) - released when atria are stretched (volume overload)
- Action: Opposite of RAAS - inhibits renin, aldosterone, and ADH; dilates afferent arteriole; directly inhibits Na+ reabsorption in collecting duct
- Effect: Increases sodium and water excretion (natriuresis + diuresis), lowers blood pressure
5. Parathyroid Hormone (PTH)
- Source: Parathyroid glands (in hypocalcemia)
- Action: Increases Ca2+ reabsorption in the distal convoluted tubule; inhibits phosphate reabsorption in PCT
- Effect: Raises plasma Ca2+, lowers plasma phosphate
6. Prostaglandins (PGE2, PGI2)
- Produced locally by the kidney
- Vasodilate the afferent arteriole, counterbalancing angiotensin II - protect GFR during volume depletion
- NSAIDs block prostaglandin synthesis, which is why they can precipitate acute kidney injury in volume-depleted patients and also increase sensitivity to ADH
7. Parathyroid Hormone-related Protein and Calcitriol (Vitamin D3)
- The kidney converts 25-hydroxyvitamin D → 1,25-dihydroxyvitamin D3 (calcitriol) via 1-alpha-hydroxylase
- Regulated by PTH, phosphate, and calcium
- Calcitriol increases intestinal Ca2+ and phosphate absorption
Summary: Substances Handled by the Kidney
| Substance | Filtered | Reabsorbed | Secreted | Notes |
|---|---|---|---|---|
| Glucose | Yes | 100% (PCT) | No | Appears in urine only if plasma glucose >180 mg/dL (renal threshold) |
| Amino acids | Yes | 100% (PCT) | No | Via cotransporters |
| Na+ | Yes | ~99% | No | Regulated by aldosterone, ANP |
| Water | Yes | ~99% | No | ADH in collecting duct |
| Urea | Yes | ~50% | No | Contributes to medullary gradient |
| Creatinine | Yes | Minimal | Slight | Used to estimate GFR |
| K+ | Yes | ~90% | Yes (CD) | Regulated by aldosterone |
| H+ | Yes | - | Yes | pH regulation; bicarbonate recovery |
| Drugs/toxins | Yes | Minimal | Yes (PCT) | Rapid clearance |
Why Kidneys Filter 180 L/Day Only to Reabsorb 99%?
Clinical Importance
- Glucose in urine (glucosuria): Plasma glucose exceeds the tubular reabsorption maximum (~180 mg/dL) - as in diabetes mellitus
- Proteinuria: Damage to the glomerular filtration barrier (GBM or podocytes) allows proteins to enter the filtrate - sign of glomerular disease
- Oliguria/polyuria: Failure of ADH action (diabetes insipidus) or excess ADH (SIADH) disrupts urine concentration
- Hypertension treatment: ACE inhibitors block angiotensin II formation; ARBs block AT1 receptors; aldosterone antagonists (spironolactone) block sodium retention
- Diuretics: Furosemide blocks NKCC2 in loop of Henle; thiazides block NCC in DCT; amiloride blocks ENaC in collecting duct
- Acute kidney injury: Damage at any point - glomerular, tubular, or vascular - reduces filtration or blocks reabsorption, causing dangerous electrolyte and fluid imbalances