I now have all the images and content I need. Let me compile the comprehensive ECG guide.Here is a complete, structured guide to ECG reading from basics to advanced interpretation.
The Complete ECG Guide: From Zero to Confident Reading
PART 1 - What is an ECG?
An ECG (electrocardiogram) records the tiny electrical voltages generated as the heart depolarizes and repolarizes. Electrodes placed on the skin pick up these signals; the machine then displays them as waves on paper. The key insight: the heart's electricity does not activate all at once - atria go first, then ventricles - and this sequential spread creates a predictable pattern of waves.
PART 2 - The ECG Waveform: What Each Part Means
Every single heartbeat on an ECG produces the following sequence of waves. This is the most fundamental thing to understand:
Fig. 4.17 from Costanzo Physiology - The ECG measured from Lead II
| Wave/Interval | What it represents |
|---|
| P wave | Atrial depolarization (SA node fires, atria contract) |
| PR interval | Time from atrial to ventricular depolarization - includes AV node delay |
| QRS complex | Ventricular depolarization (ventricles contract) |
| ST segment | Flat line between depolarization and repolarization - plateau phase |
| T wave | Ventricular repolarization (ventricles reset) |
| QT interval | Total ventricular electrical event (depolarization + repolarization) |
| U wave | Seen occasionally - likely afterdepolarizations in ventricles |
Normal values (at 25 mm/s paper speed):
- P wave: <0.12 sec (3 small boxes wide)
- PR interval: 0.12-0.20 sec (3-5 small boxes)
- QRS duration: 0.06-0.10 sec (1.5-2.5 small boxes)
- QT interval: 0.36-0.44 sec (approximately 9-11 small boxes)
PART 3 - ECG Paper: The Grid, Speed, and Boxes
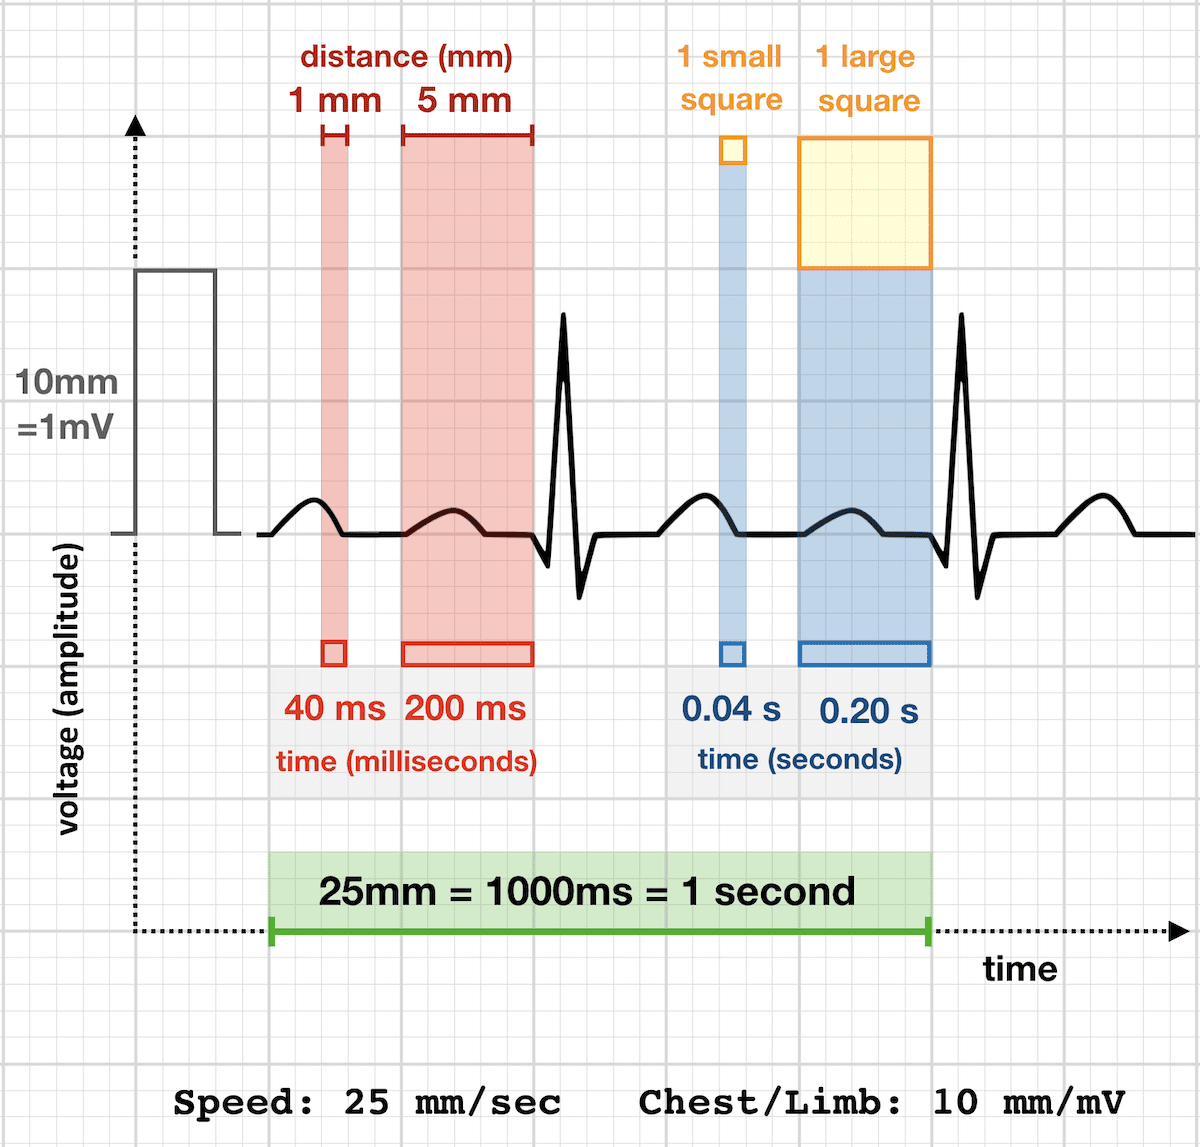
This is often confusing for beginners. Here is the complete breakdown:
The Grid Explained
Horizontal axis = TIME. Vertical axis = VOLTAGE (amplitude).
| Box | Width | Time | Height | Voltage |
|---|
| 1 small box | 1 mm | 0.04 sec (40 ms) | 1 mm | 0.1 mV |
| 1 large box (5 small) | 5 mm | 0.20 sec (200 ms) | 5 mm | 0.5 mV |
| 5 large boxes | 25 mm | 1.0 sec (1000 ms) | 10 mm | 1.0 mV |
Standard calibration: At the very beginning of the ECG strip, you should see a square calibration pulse that is exactly 10 mm tall and 5 mm wide. This tells you the machine is running at standard settings. If it looks different, all your measurements will be off.
Why Does Paper Speed Matter?
Standard speed is 25 mm/second. At this speed:
- Each large box = 0.20 seconds
- 5 large boxes = 1 second
- The whole 12-lead printout gives you 10 seconds of rhythm strip
Some countries and EP labs use 50 mm/second. At 50 mm/s, everything looks wider and more spread out - the same complex that was 2 boxes wide at 25 mm/s will look 4 boxes wide at 50 mm/s. If you try to read a 50 mm/s strip using 25 mm/s measurements, you will falsely diagnose everything as prolonged. Always check the speed printed at the bottom of the ECG first.
PART 4 - The 12 Leads: Placement, Direction, and Significance
The ECG is called a "12-lead" but you only attach 10 electrodes to the patient. These 10 electrodes generate 12 different views (perspectives) of the heart's electrical activity.
Complete visual reference - notice lead placement positions (Fig 30.1), origin of waveforms (Fig 30.2), normal 12-lead printout (Fig 30.5), and anatomical groupings (Fig 30.4)
Electrode Placement
Limb electrodes (4 total):
- RA = Right arm (wrist or upper arm)
- LA = Left arm (wrist or upper arm)
- RL = Right leg (ankle or lower leg) - this is the ground/neutral, contributes to no lead
- LL = Left leg (ankle or lower leg)
Chest (precordial) electrodes (6 total):
- V1 - 4th intercostal space, RIGHT of sternum
- V2 - 4th intercostal space, LEFT of sternum
- V3 - Midway between V2 and V4
- V4 - 5th intercostal space, mid-clavicular line
- V5 - Same horizontal level as V4, anterior axillary line
- V6 - Same horizontal level as V5, mid-axillary line
Tip to find V1/V2: Feel the top of the sternum. About 4 cm down is a ridge - the sternal angle (angle of Louis). The 2nd rib articulates here. Count down to 4th intercostal space. V1 is to the right of the sternum at this level; V2 mirrors it on the left.
The 12 Leads: Who They Are and What They Look At
The 12 leads divide into two groups based on their plane:
Group A - Limb Leads (Frontal Plane: looks from front to back through the body)
Bipolar limb leads (measure voltage between two limb electrodes):
| Lead | Positive pole | Negative pole | Direction it looks |
|---|
| Lead I | Left arm | Right arm | Horizontal - looks LEFT |
| Lead II | Left leg | Right arm | Down-right - looks INFERIOR |
| Lead III | Left leg | Left arm | Down-left - looks INFERIOR |
Augmented unipolar limb leads (measure from one limb against combined average of the other two):
| Lead | Positive pole | Direction it looks |
|---|
| aVR | Right arm | Looks toward RIGHT shoulder (upper right) |
| aVL | Left arm | Looks toward LEFT shoulder (upper left) |
| aVF | Left foot | Looks DOWNWARD (inferior) |
Group B - Precordial Leads (Horizontal/Transverse Plane: looks from right to left across the chest)
| Lead | Location | What it sees |
|---|
| V1 | Right of sternum | Septal wall of the heart |
| V2 | Left of sternum | Septal wall |
| V3 | Between V2-V4 | Anterior wall (transitional) |
| V4 | Mid-clavicular | Anterior wall |
| V5 | Anterior axillary | Lateral wall of left ventricle |
| V6 | Mid-axillary | Lateral wall of left ventricle |
Anatomical Groupings: Which Leads Look at Which Part of the Heart?
This is clinically vital for identifying MI location:
| Region of Heart | Leads that see it | Blood supply |
|---|
| Inferior wall | II, III, aVF | Right coronary artery (RCA) |
| Septal | V1, V2 | Left anterior descending (LAD) |
| Anterior | V3, V4 | LAD |
| Lateral (high) | I, aVL | Circumflex artery |
| Lateral (low) | V5, V6 | Circumflex artery |
So when you see ST elevation in leads II, III, aVF - that's an inferior MI from RCA occlusion. When V1-V4 show changes - that's an anterior MI from LAD occlusion.
PART 5 - Why Does aVR Look Upside Down? (The Direction Problem)
This confuses almost everyone. Here is the clear explanation:
When electrical current moves TOWARD a lead's positive pole, the deflection goes UP.
When electrical current moves AWAY from a lead's positive pole, the deflection goes DOWN.
The heart's main electrical current travels from upper-right to lower-left (from SA node, down through the ventricles). Lead aVR sits in the upper-right - it looks DOWN toward the heart from the right shoulder. This means the main current is flowing away from aVR's positive pole at almost every moment. The result: aVR shows mostly negative (downward) deflections - everything appears flipped compared to Lead II.
This is completely normal. aVR is a "mirror image" lead. Its value is:
- Confirming leads are placed correctly (should be opposite to Lead II)
- Detecting right-sided events like right ventricular strain, sodium channel toxicity (tall R in aVR), or aVR ST elevation in left main occlusion
PART 6 - How to Read an ECG: The Systematic Order
Never read an ECG randomly. Use this fixed sequence every time - it ensures you miss nothing:
Step 1 - Check Patient Details and Technical Quality
- Patient name, date, age
- Paper speed (standard = 25 mm/s)
- Calibration pulse (10mm tall = 1 mV standard)
- Look for artifacts, leads that fell off, baseline wander
Step 2 - Rate
First, is the rhythm regular or irregular? Then calculate rate.
Method 1 - 300 rule (for regular rhythms, fast and easy):
Count the large boxes between two consecutive R waves. Divide 300 by that number.
- 1 large box = 300 bpm
- 2 large boxes = 150 bpm
- 3 large boxes = 100 bpm
- 4 large boxes = 75 bpm
- 5 large boxes = 60 bpm
- 6 large boxes = 50 bpm
Memorize: 300 - 150 - 100 - 75 - 60 - 50 as you count each box away.
Method 2 - 1500 rule (for regular rhythms, more precise):
Count small boxes between two R waves. Divide 1500 by that number.
Method 3 - 6-second strip method (for irregular rhythms like atrial fibrillation):
Count the number of R waves in a 10-second strip (most rhythm strips are 10 seconds long). Multiply by 6. This gives approximate beats per minute.
Step 3 - Rhythm
- Are R-R intervals regular?
- Is there a P wave before every QRS?
- Does every P wave look the same (all from SA node)?
- Is the PR interval constant?
If yes to all four: Normal sinus rhythm
Step 4 - Axis (see Part 7 below)
Step 5 - P Wave
- Present? Upright in I and II?
- Duration <0.12 sec (3 small boxes)?
- Morphology the same in all beats?
Step 6 - PR Interval
- Normal: 0.12-0.20 sec (3-5 small boxes)
- Short PR (<3 boxes): pre-excitation (WPW syndrome)
- Long PR (>5 boxes): heart block
Step 7 - QRS Complex
- Width: normal <0.12 sec (<3 small boxes)
- Wide QRS (>3 boxes) = bundle branch block or ventricular origin
- Height (amplitude): tall in hypertrophy, small in pericardial effusion
Step 8 - ST Segment
- Should sit on the isoelectric line
- ST elevation >1mm in two adjacent leads = STEMI (ST elevation MI) until proven otherwise
- ST depression = ischemia or reciprocal change
Step 9 - T Wave
- Normally upright in most leads, inverted in aVR
- T inversion in chest leads = ischemia, LVH strain, RBBB
- Peaked tall T waves = hyperkalemia
Step 10 - QT Interval
- Measure from start of Q to end of T wave
- Correct for rate (QTc): use Bazett's formula = QT / √(RR interval in seconds)
- QTc >440 ms (men) / >460 ms (women) = prolonged (arrhythmia risk)
PART 7 - Cardiac Axis: The Most Misunderstood Concept Made Simple
What is Cardiac Axis?
The cardiac axis is the average direction of the ventricular depolarization wavefront, measured in degrees on a circle. Think of it as: "which direction does the electrical wave in the ventricles mainly travel?"
Normally, depolarization spreads from the SA node down through the AV node and Purkinje fibers toward the apex and left side of the ventricles (because the left ventricle is dominant). This gives a normal axis pointing down and to the left = roughly -30° to +90° (most textbooks say 0° to +90°, some include down to -30°).
The mean electrical axis of a normal heart is approximately +59 degrees (Guyton & Hall, Textbook of Medical Physiology).
The Hexaxial Reference System
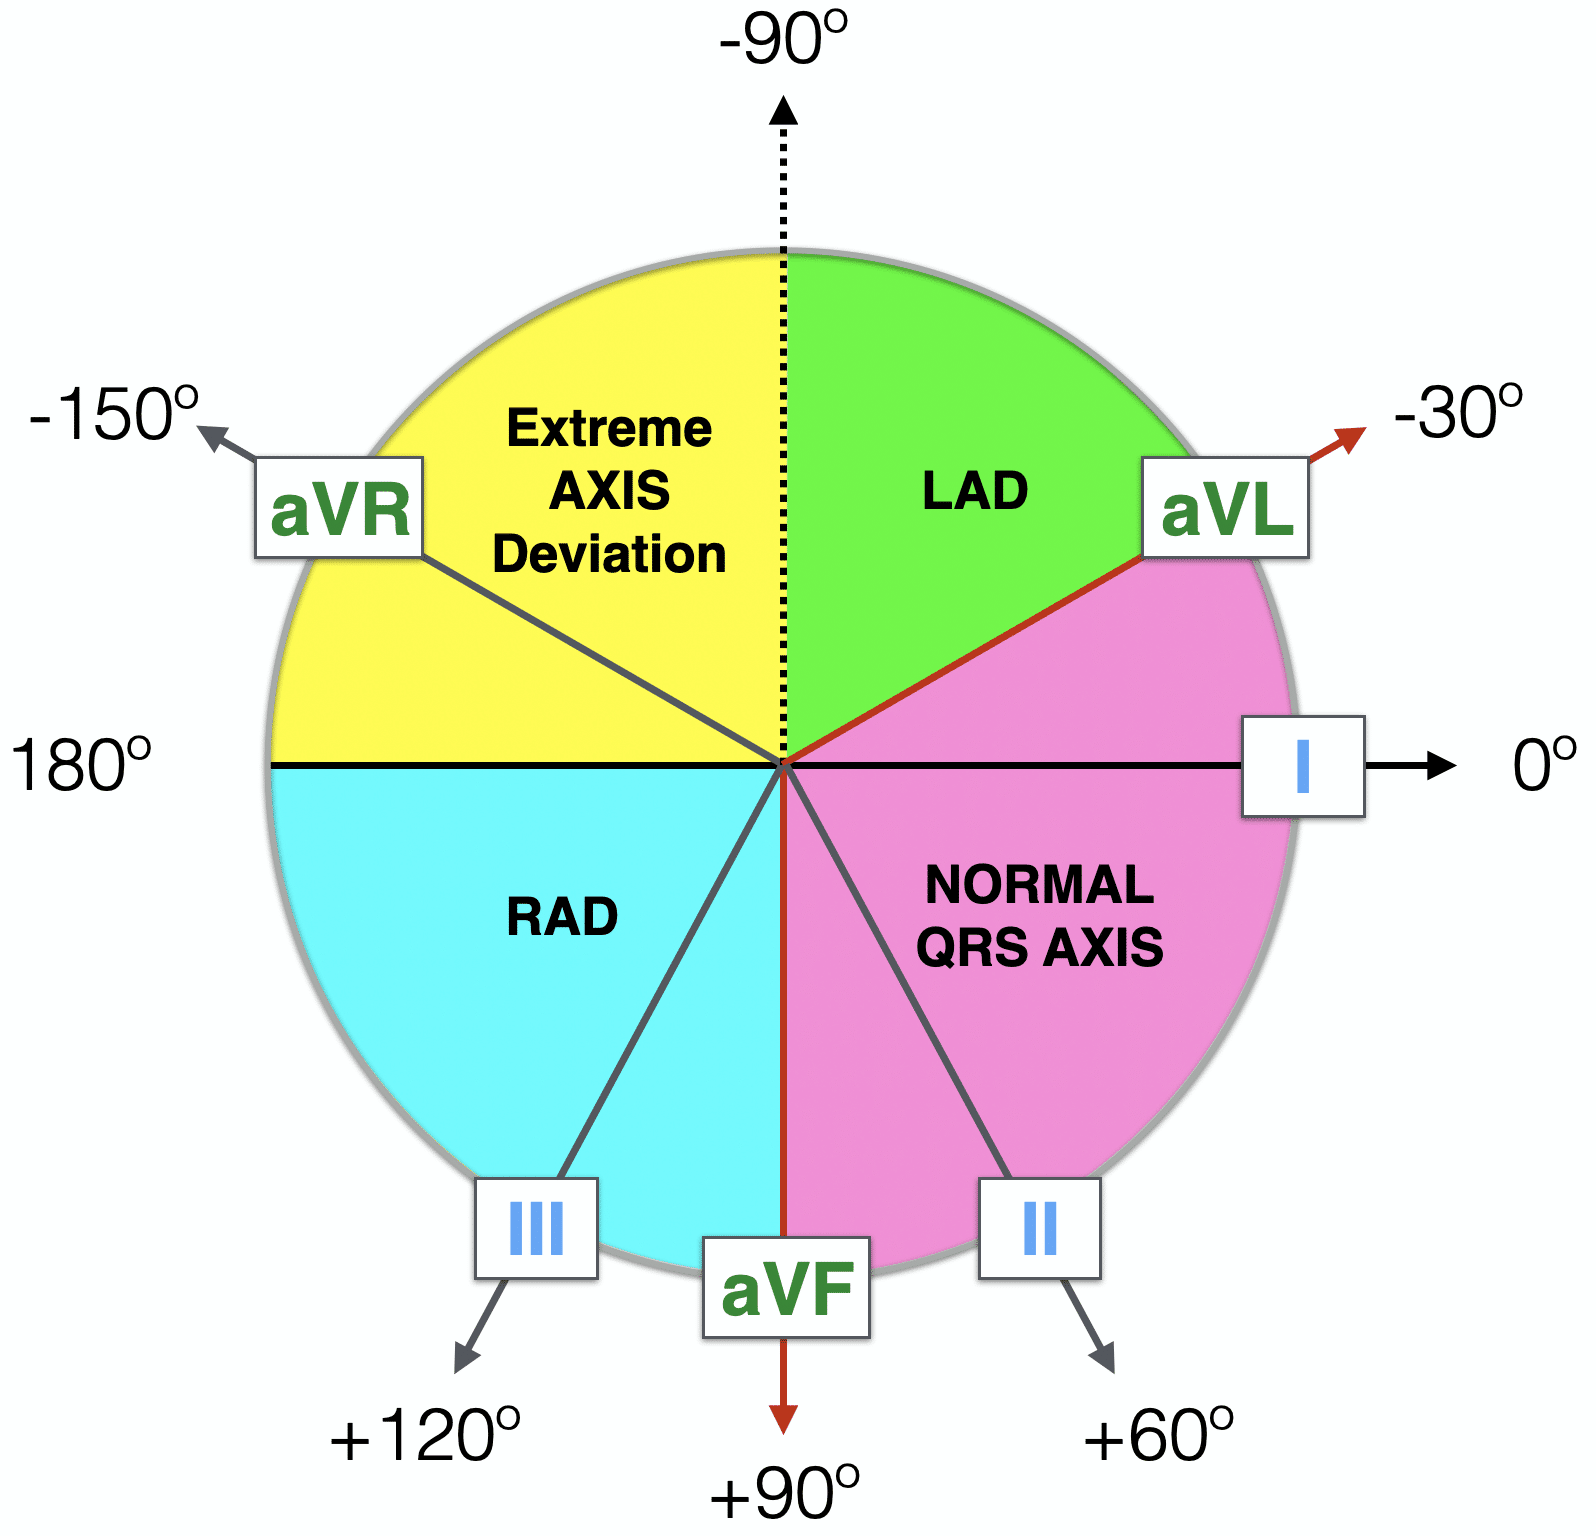
Each of the 6 limb leads points in a specific direction in the frontal plane:
| Lead | Angle |
|---|
| Lead I | 0° (points right → left) |
| Lead II | +60° |
| aVF | +90° |
| Lead III | +120° |
| aVL | -30° |
| aVR | -150° |
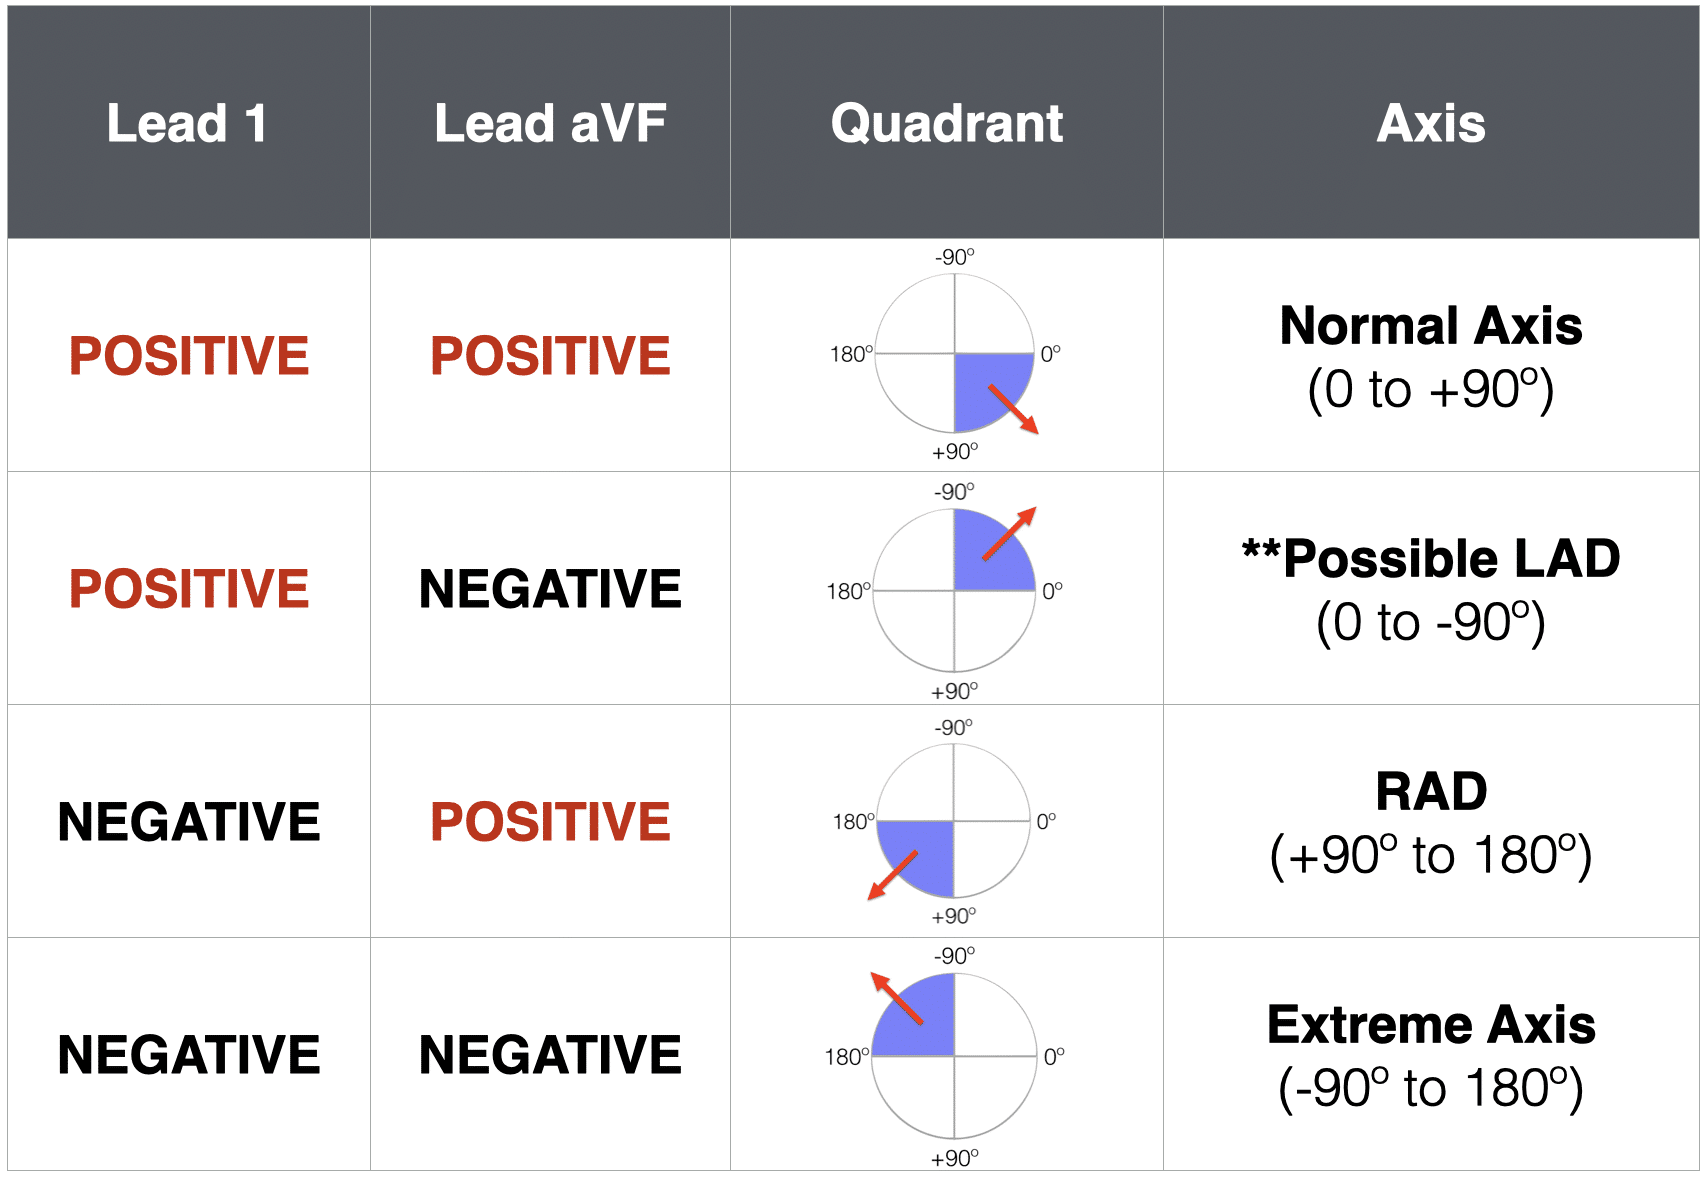
How to Determine Axis Quickly: The Two-Lead Method (Lead I + aVF)
Because Lead I is horizontal (0°) and aVF is vertical (+90°), they divide the circle into 4 quadrants. Check if QRS is positive (upward) or negative (downward) in each:
| Lead I | aVF | Axis |
|---|
| Positive | Positive | Normal axis (0° to +90°) |
| Positive | Negative | Left Axis Deviation (LAD) (more than -30°) - check Lead II: if Lead II is also negative, it's definite LAD |
| Negative | Positive | Right Axis Deviation (RAD) (+90° to +180°) |
| Negative | Negative | Extreme axis deviation (-90° to ±180°) - "Northwest axis" |
Clinical Causes of Axis Deviation
Left Axis Deviation (LAD):
- Left anterior fascicular block (most common)
- Left ventricular hypertrophy (LVH)
- Left bundle branch block (LBBB)
- Inferior MI (loss of inferior wall forces)
- WPW syndrome
Right Axis Deviation (RAD):
- Right ventricular hypertrophy (RVH)
- Pulmonary embolism (acute cor pulmonale)
- COPD / chronic lung disease
- Left posterior fascicular block
- Normal variant in tall, thin young people
- Right bundle branch block (RBBB)
PART 8 - Tachycardia and Bradycardia on the ECG
Definitions
| Condition | Heart Rate |
|---|
| Bradycardia | < 60 bpm |
| Normal sinus rhythm | 60-100 bpm |
| Tachycardia | > 100 bpm |
How to Spot Them on the Strip
Bradycardia = R waves are far apart. Between consecutive R waves, you will count MORE than 5 large boxes (>1 second between beats). Using the 300 rule: if the R-R interval is 6 large boxes, rate = 300/6 = 50 bpm.
Tachycardia = R waves are crowded together. Between consecutive R waves, you will count FEWER than 3 large boxes. If R-R interval is 2 large boxes, rate = 300/2 = 150 bpm.
Sinus Bradycardia
- Rate: <60 bpm
- P wave: normal (upright in I, II)
- P-QRS relationship: normal (one P before each QRS)
- PR interval: normal
- The only difference from normal: slow rate
- Causes: Athletes (normal), sleep, hypothyroidism, medications (beta-blockers, digoxin), vagal stimulation, inferior MI affecting SA node
Sinus Tachycardia
- Rate: 100-180 bpm
- P wave: normal
- P-QRS: one P before each QRS (all matching, all the same)
- The only difference: fast rate
- Causes: Exercise, fever, pain, anxiety, hypovolemia, anemia, pulmonary embolism, hyperthyroidism, heart failure
Key distinction: In sinus tachycardia, if you look carefully, you can still identify individual P waves before each QRS. At very fast rates (>140 bpm), P waves may be hidden inside T waves - this is a clue to look harder.
Distinguishing Sinus Tach from Other Tachycardias
| Feature | Sinus Tach | SVT (AVNRT) | AF |
|---|
| Rate | 100-180 | 150-250 | 100-180 (irregular) |
| Rhythm | Regular | Regular | Irregularly irregular |
| P waves | Clear, upright in II | Hidden in QRS or just after | Absent (replaced by fibrillatory baseline) |
| QRS width | Narrow | Narrow | Narrow (unless aberrant) |
PART 9 - Which Lead Should You Read First and Why?
The Recommended Reading Order
Step 1 - Start with the Rhythm Strip (Lead II, bottom)
Most ECG machines print a long continuous strip of Lead II at the bottom. This is 10 seconds long and gives you the best view of rate and rhythm. Lead II runs almost perfectly parallel to the main electrical axis (normal axis ~+60°), so P waves and QRS complexes are tall and easy to identify here. Always start here.
Step 2 - Confirm with Lead V1
V1 is excellent for:
- Distinguishing left vs right bundle branch block
- Detecting P wave morphology (right atrial enlargement gives tall peaked P in V1; left atrial enlargement gives biphasic P)
- Seeing AV conduction clearly
Step 3 - Inferior leads: II, III, aVF together
Look at the inferior group as a unit. Check for Q waves, ST changes, T inversion.
Step 4 - Lateral leads: I, aVL, V5, V6
High lateral (I, aVL) and low lateral (V5, V6) - these often show changes together.
Step 5 - Anterior/Septal: V1-V4
Check for poor R-wave progression (Q waves where R waves should be developing) - sign of anterior MI. Look for ST changes across these leads.
Step 6 - aVR last (or alongside Step 1)
aVR is the "mirror" lead. ST elevation in aVR with widespread ST depression elsewhere = left main coronary artery occlusion or severe LAD disease.
Why This Order?
You read II first because it is the "monitoring lead" - tallest waves, clearest rhythm. You group anatomically related leads together because changes in adjacent leads (called contiguous leads) confirm a real event. An isolated change in one lead is usually artifact or poor contact. Two or more adjacent leads showing the same change = real.
PART 10 - Changes to Look For: ST Segments and Their Meaning
| Change | Appearance | Meaning |
|---|
| ST elevation | ST rises above baseline | Acute STEMI, pericarditis (saddle-shaped), Brugada pattern |
| ST depression | ST dips below baseline | Ischemia (demand), NSTEMI, digoxin effect, reciprocal in STEMI |
| T wave inversion | T flips downward | Ischemia, LVH strain pattern, RBBB, PE (Wellens syndrome in V2-V3 = proximal LAD disease) |
| Peaked tall T | T wave very tall and symmetrical | Hyperkalemia, hyperacute STEMI (very early) |
| Prolonged QT | T wave extends far right | Drug toxicity (amiodarone, antipsychotics, quinolones), hypokalemia, hypomagnesemia |
| Delta wave + short PR | Slurred upstroke on QRS | WPW pre-excitation |
| Deep broad Q wave | Q >0.04s wide or >25% R height | Old MI (scar), loss of that wall's electrical activity |
Quick Reference Summary
| Parameter | Normal Value |
|---|
| Heart rate | 60-100 bpm |
| PR interval | 0.12-0.20 s (3-5 small boxes) |
| QRS duration | <0.12 s (<3 small boxes) |
| QT interval (QTc) | <440 ms men, <460 ms women |
| P wave | <0.12 s wide, <0.25 mV tall, upright in I, II |
| ST segment | On isoelectric line ±1 mm |
| Cardiac axis | -30° to +90° |
| Paper speed | 25 mm/s standard |
| Small box | 0.04 s / 0.1 mV |
| Large box | 0.20 s / 0.5 mV |
*Sources: Costanzo Physiology 7th Edition; Guyton and Hall Textbook of Medical Physiology; ECG Learning Center (University of Utah); LITFL ECG Library; Braunwald's Heart Disease.*That is the complete guide. Here is a quick summary of what was covered:
What you now have:
- ECG basics - what the machine records, why waves are generated
- P-QRS-T waveform with a textbook image pointing out each labeled component
- The ECG grid - exactly what each small box (0.04s/0.1mV) and large box (0.2s/0.5mV) means, and why paper speed (25 mm/s standard) is checked before anything else
- All 12 leads - precise electrode placement for all 10 electrodes, what direction each lead "looks," and which anatomical region each group covers (inferior/septal/anterior/lateral)
- Why aVR looks inverted - the current moves away from it, so deflections go downward - this is expected, not an error
- Systematic reading order - start with Lead II rhythm strip, then V1, then group by anatomy
- Cardiac axis - the hexaxial wheel with labeled zones, the Lead I + aVF quadrant method, and clinical causes of left/right deviation
- Tachycardia vs bradycardia - how to calculate rate using the 300-rule, sinus brady/tach features, and how to distinguish sinus tachycardia from SVT or AF
- ST/T changes table - a quick reference for every significant ECG change and what it means