
Ketoacidosis
"diabetic ketoacidosis"[MeSH Terms] AND management
diabetic ketoacidosis pathophysiology diagram
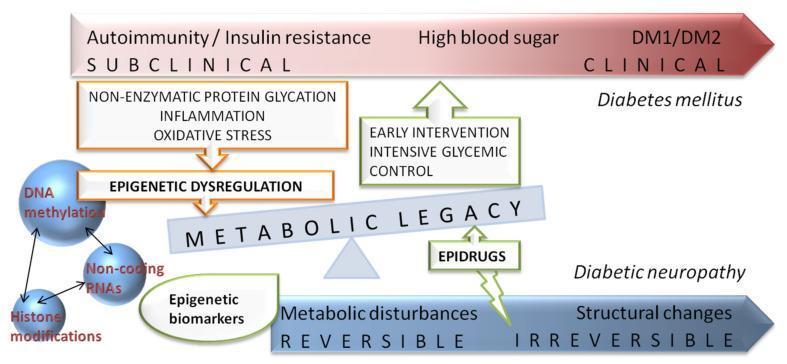
A pathophysiology diagram illustrating the disease progression from subclinical states to clinical diabetes mellitus (DM1/DM2) and diabetic neuropathy. The upper horizontal arrow tracks clinical progression from autoimmunity/insulin resistance and high blood sugar to clinical diagnosis. A parallel lower arrow tracks the transition from reversible metabolic disturbances to irreversible structural changes in diabetic neuropathy. Central to the diagram is the 'Metabolic Legacy' (metabolic memory) concept, represented as a balance scale. This legacy is influenced by non-enzymatic protein glycation, inflammation, and oxidative stress, which lead to 'Epigenetic Dysregulation'. Specific epigenetic mechanisms depicted include DNA methylation, non-coding RNAs, and histone modifications. Educational focus is placed on intervention strategies, showing that 'early intensive glycemic control' and 'epidrugs' (targeting epigenetic biomarkers) can potentially modulate this metabolic legacy to prevent or delay the progression from functional disturbances to permanent structural nerve damage.
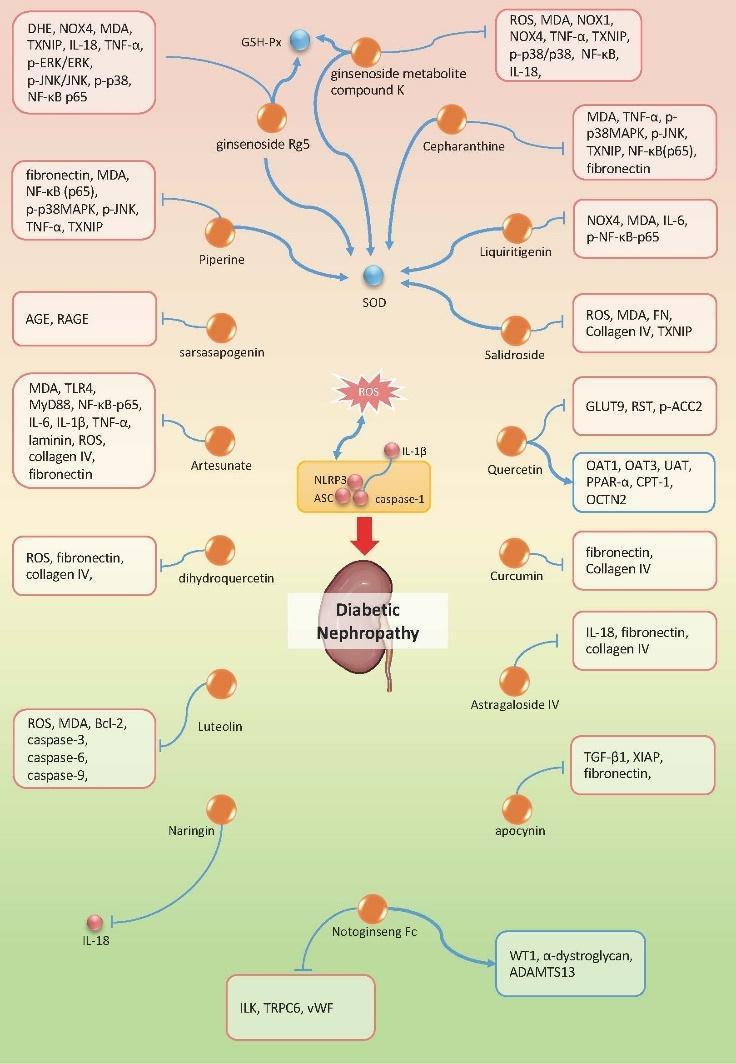
A medical pathophysiology diagram illustrating the therapeutic mechanisms of various natural compounds in the treatment of Diabetic Nephropathy (DN) through the modulation of the NLRP3 inflammasome signaling pathway. The central axis depicts the progression from ROS and IL-1̢ stimulation to the activation of the NLRP3 inflammasome complex (NLRP3, ASC, caspase-1), ultimately leading to renal damage. Surrounding this axis are orange nodes representing bioactive candidates such as Quercetin, Curcumin, Artesunate, and Luteolin. The diagram utilizes blue T-bars to indicate the inhibition of pro-inflammatory and pro-fibrotic markers, including NF-̠B, TNF-α, fibronectin, collagen IV, and various caspases (3, 6, 9). Conversely, blue arrows indicate the upregulation of protective antioxidant enzymes like SOD and GSH-Px. Specific pathways shown include MAPK (p38, JNK, ERK) inhibition and the regulation of metabolic transporters (GLUT9, OAT1). This schematic summarizes how diverse natural agents suppress the chronic low-grade inflammation and oxidative stress that drive the pathogenesis of diabetic kidney disease.
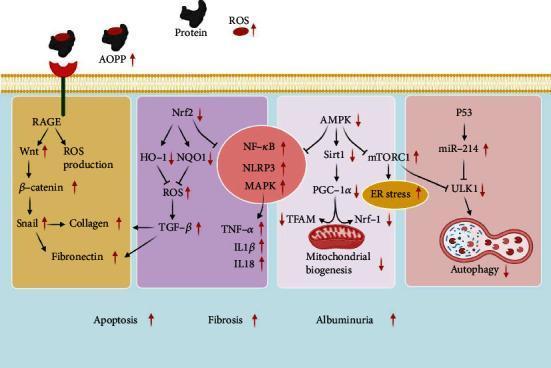
A pathophysiology diagram illustrating impaired molecular signaling pathways in diabetic nephropathy. The diagram is divided into four functional domains: 1) The RAGE pathway (yellow) shows Advanced Oxidation Protein Products (AOPP) activating RAGE, leading to increased ROS, Wnt, β-catenin, Snail, collagen, and fibronectin. 2) The Nrf2 pathway (purple) depicts decreased Nrf2, HO-1, and NQO1, resulting in increased ROS, TGF-β, and inflammatory markers (NF-κB, NLRP3, MAPK, TNF-α, IL1β, IL18). 3) The AMPK pathway (grey) shows decreased AMPK, Sirt1, PGC-1α, TFAM, and Nrf-1 leading to reduced mitochondrial biogenesis, while increased mTORC1 aggravates ER stress. 4) The P53 pathway (red) demonstrates increased P53 and miR-214, which inhibits ULK1 and suppresses autophagy. Collectively, these dysregulated pathways contribute to the clinical manifestations of increased apoptosis, fibrosis, and albuminuria. Red arrows indicate upregulated or downregulated protein expression levels characteristic of the diabetic state, emphasizing the loss of antioxidant defenses and homeostatic mechanisms like autophagy.
Ketoacidosis
Types
| Type | Key Driver |
|---|---|
| Diabetic (DKA) | Absolute or relative insulin deficiency + counterregulatory hormone excess |
| Starvation | Prolonged fasting; milder, rarely severe acidosis |
| Alcoholic | Ethanol + poor nutrition; glucose usually low or normal |
| Inherited metabolic errors | Rare organic acidemias |
Pathophysiology
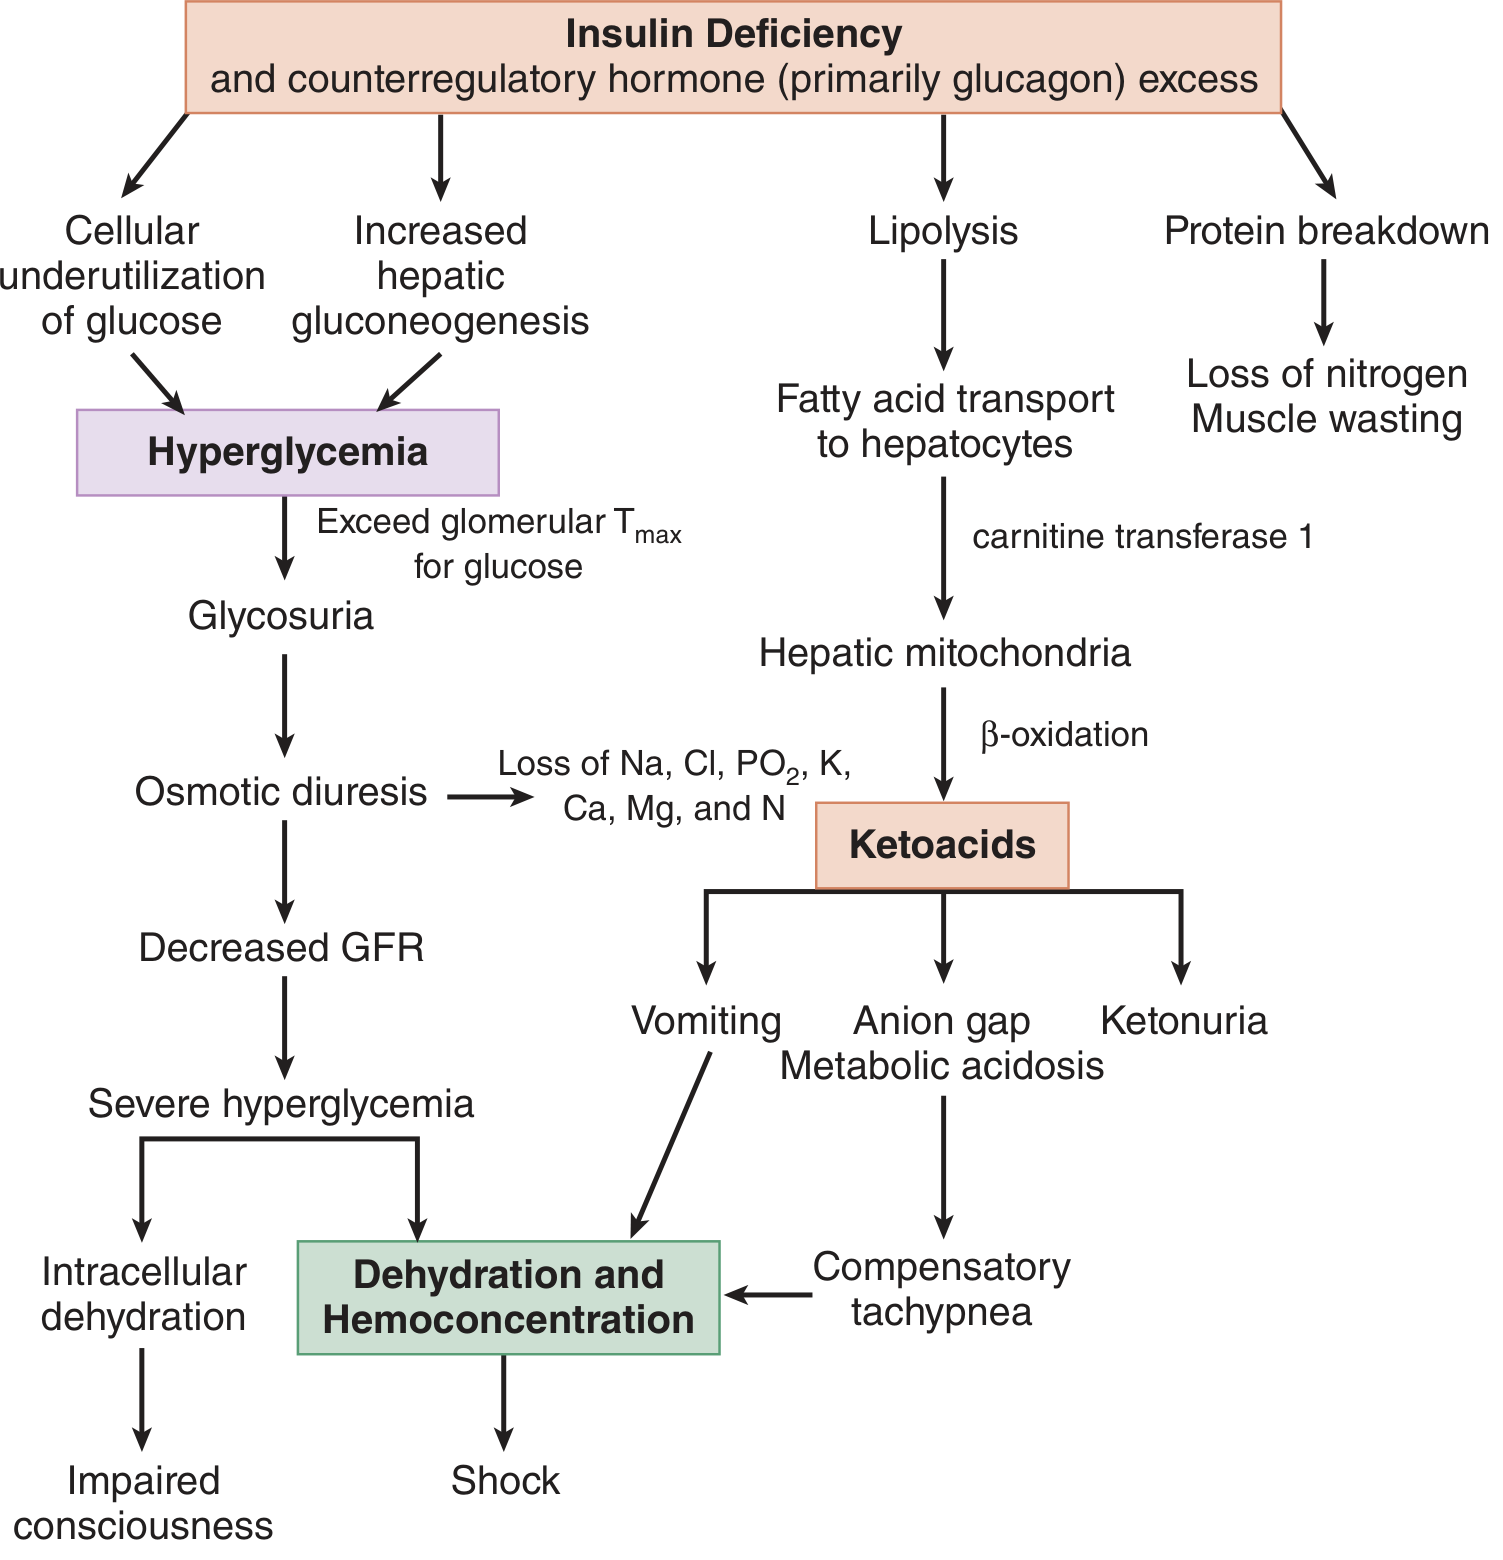
1. Hyperglycemia
- Decreased cellular uptake of glucose
- Increased hepatic gluconeogenesis and glycogenolysis
- Protein breakdown provides glucogenic precursors (amino acids, glycerol)
2. Ketogenesis
- Lipolysis releases free fatty acids (FFAs) from adipose tissue
- FFAs travel to the liver, enter mitochondria via carnitine transferase-1, and undergo beta-oxidation
- Acetyl-CoA production exceeds the Krebs cycle capacity → converted to acetoacetate (AcAc), beta-hydroxybutyrate (beta-OHB), and acetone
- AcAc + NADH ⇌ beta-OHB + NAD⁺
- In normal subjects, beta-OHB:AcAc ratio = 2:1; in DKA it rises to 2.5-3:1, and with associated lactic acidosis can exceed 8:1
3. Osmotic Diuresis and Electrolyte Loss
- Glycosuria (once plasma glucose exceeds the renal Tmax) triggers osmotic diuresis
- Urinary losses of Na⁺, Cl⁻, K⁺, PO₄, Ca²⁺, Mg²⁺
- Renin-angiotensin-aldosterone system activation worsens renal K⁺ losses
- Ketoanion excretion in urine = loss of potential bicarbonate
- Result: profound dehydration, hemoconcentration, decreased GFR → worsening hyperglycemia
4. Potassium Paradox
- Patients often present with hyperkalemia despite total-body K⁺ depletion
- Mechanism: insulin deficiency impairs cellular K⁺ uptake; hyperosmolarity causes water and K⁺ to shift extracellularly ("solute drag")
- As treatment proceeds (insulin, fluid, correction of acidosis), K⁺ shifts intracellularly, causing rapid hypokalemia if not supplemented
Precipitating Causes of DKA
- Infection (most common identifiable trigger)
- Omission/reduction of insulin or insulin pump failure
- New-onset Type 1 DM (may be first presentation)
- Myocardial infarction, stroke, pulmonary embolism
- Pancreatitis, GI hemorrhage, major trauma, surgery
- Medications: corticosteroids, thiazides, antipsychotics, sympathomimetics
- Cocaine use, pregnancy, hyperthyroidism, pheochromocytoma, Cushing's syndrome
- No clear cause identified in many patients
Clinical Features
| Feature | Mechanism |
|---|---|
| Polyuria, polydipsia | Osmotic diuresis |
| Nausea, vomiting, abdominal pain | Ketones + prostaglandins I₂ and E₂; can mimic acute abdomen |
| Kussmaul respirations | Physiologic compensation for metabolic acidosis (↑ rate and depth) |
| Fruity/acetone breath | Exhaled acetone |
| Tachycardia, hypotension, poor skin turgor | Volume depletion |
| Altered consciousness | Hyperosmolality (>320 mOsm/L correlates better than pH severity) |
| Hypothermia (paradoxical) | Peripheral vasodilation from prostaglandins, despite volume depletion |
Diagnostic Criteria
- Blood glucose >250 mg/dL (13.9 mmol/L)
- Anion gap >10-12 mEq/L
- Bicarbonate <15 mEq/L
- pH <7.3
- Moderate ketonuria or ketonemia
| Severity | pH | HCO₃⁻ | Anion Gap | Mental Status |
|---|---|---|---|---|
| Mild | 7.25-7.30 | 15-18 mEq/L | >10 | Alert |
| Moderate | 7.00-7.24 | 10-15 mEq/L | >12 | Alert to drowsy |
| Severe | <7.00 | <10 mEq/L | >12 | Stupor/coma |
Management
Fluids
- Isotonic crystalloid resuscitation (several liters)
- Preference for balanced crystalloids (e.g., Plasmalyte-148) over 0.9% NaCl - multiple studies show normal saline produces predictable hyperchloremic acidosis, prolonged acidosis, lower bicarbonate, worse blood pressure, and longer hospital stay compared to balanced solutions
- Add IV dextrose when glucose falls to the "controlled" range (typically <250 mg/dL) to allow continued insulin to clear ketones
Insulin
- IV insulin infusion: 0.1 units/kg/hour (fixed weight-based rate) is standard
- A 2024 systematic review and meta-analysis (Alnuaimi et al., PMID 39090718) compared subcutaneous (SC) insulin to continuous IV infusion in adults with DKA
- A 2026 meta-analysis of RCTs (Thammakosol et al., PMID 41208563) evaluated early SC basal insulin with IV insulin infusion - relevant for transition protocols
Potassium
- Replace aggressively as soon as K⁺ is confirmed not to be dangerous - total body stores are depleted despite serum hyperkalemia at presentation
- Do not give insulin until K⁺ > 3.5 mEq/L (risk of fatal hypokalemia)
Phosphate and Magnesium
- Also depleted; replete as needed
Bicarbonate
- Generally NOT recommended (even in severe DKA) unless pH <6.9
Resolution Criteria (Anion Gap Closure)
- Glucose <200 mg/dL
- Anion gap normalized
- Bicarbonate ≥15 mEq/L
- pH >7.3
- Overlap SC insulin with IV infusion before discontinuing the drip
Key Pitfalls
- Beta-OHB:AcAc ratio trap - Urine dipstick may worsen as the patient improves (AcAc rises as beta-OHB clears)
- Hyperchloremic acidosis from normal saline - May be mistaken for persistent ketoacidosis; use balanced crystalloids when possible
- Hypokalemia after insulin - Anticipate and replace K⁺ proactively; fatal arrhythmias can occur
- Abdominal pain - If it doesn't resolve with DKA treatment, investigate for primary intra-abdominal pathology
- Occult infection - Absence of fever doesn't rule it out
- Tintinalli's Emergency Medicine: A Comprehensive Study, Chapter 225
- Murray & Nadel's Textbook of Respiratory Medicine, Chapter 12
- Miller's Anesthesia, 10e, Chapter on Metabolic Disorders
- Recent meta-analyses: Alnuaimi 2024 (PMID 39090718), Thammakosol 2026 (PMID 41208563)
What is the most likely diagnosis?
- Patient demographics (age, known diabetes?)
- Symptoms (polyuria, polydipsia, vomiting, abdominal pain, altered consciousness?)
- Vitals (tachycardia, hypotension, Kussmaul breathing, fruity breath?)
- Labs/ABG (glucose, pH, bicarbonate, anion gap, ketones?)
- Precipitating context (missed insulin, infection, new presentation?)