
give microscopic feature of acute mi and healed mi with image
acute myocardial infarction microscopic histology coagulative necrosis
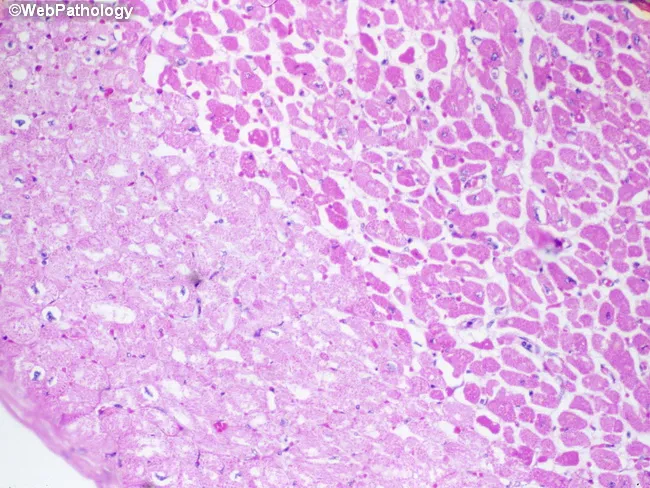
Imaging modality: Light microscopy of hematoxylin-eosin (H&E) stained cardiac tissue. Specimen is paraffin-embedded myocardial section, 5 micron thick, imaged with bright-field optics at high magnification. Anatomic region: left ventricular myocardium with an infarct in the left half of the field. The histology demonstrates pallor of necrotic cardiomyocytes (myocytolysis) produced by sarcolemmal disruption with influx of salt and water and cytoplasmic swelling. In this early post-ischemic stage, fibers lose cross-striations and display increased eosinophilia; nuclei are often absent or pyknotic. The infarct border may show waviness of fibers and mild edema; contraction bands may be present at the margin. Neutrophilic infiltration is typically minimal during the first 24 hours but may begin to appear around this window. The combination of coagulative necrosis, myocytolysis, and pallor indicates an acute myocardial infarction approximately one day old. This histologic pattern correlates with ischemia from coronary occlusion, clinical presentation of acute coronary syndrome, and aligns with diagnostic timelines (0-24 h). Clinically the image supports timing of infarct and helps distinguish acute infarction from myocarditis or chronic scar, serving as an educational reference for pathology, medical education, and research on myocardial injury dynamics. Further confirmed by clinical correlation and education.
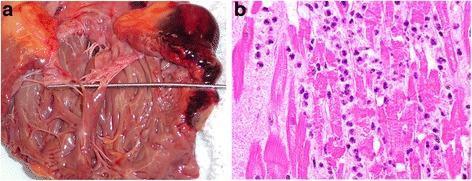
This composite image illustrates the macroscopic and microscopic features of a myocardial rupture. Figure (a) is a clinical autopsy photograph of an opened heart showing a slit-like transmural rupture at the base of the right ventricle. A metallic probe is inserted through the defect to demonstrate the communication. Extensive dark red epicardial hemorrhage is visible adjacent to the rupture site, and the tricuspid valve apparatus is centrally located within the ventricular chamber. Figure (b) is a high-power light microscopy image (H&E stain) of the infarcted tissue. It demonstrates acute myocardial necrosis characterized by hypereosinophilic, disorganized myocytes lacking nuclei (coagulative necrosis) and a dense infiltration of polymorphonuclear leukocytes (neutrophils). These findings are pathognomonic for an acute myocardial infarction in the 48–72 hour range, leading to catastrophic free wall rupture. This visual material is used in pathology and cardiology to teach the mechanical complications of acute myocardial infarction and the histopathological stages of cardiac tissue repair and inflammation.
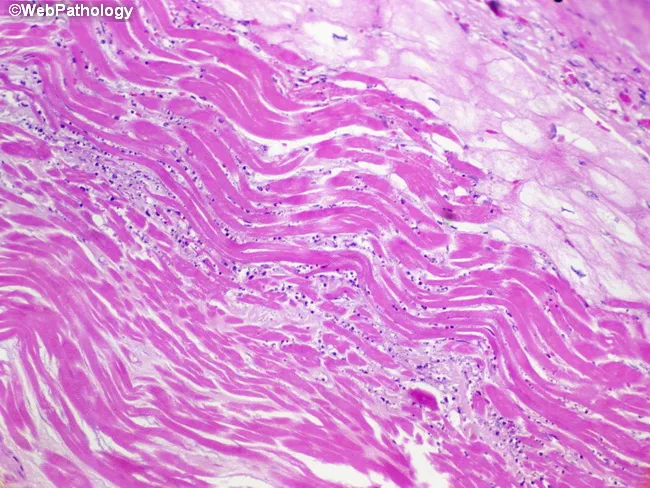
Imaging modality: light microscopy of a cardiac tissue section stained with hematoxylin and eosin reveals infarct border-zone myocardium from the left ventricle. The tissue shows parallel, wavy myocardial fibers along the border between viable and necrotic tissue—a hallmark of early coagulative necrosis in myocardial infarction. The fibers appear elongated and noncontractile, with eosinophilic (pink) cytoplasm and loss of distinctive cross-striations; nuclei are scarce or absent in necrotic cells. In the periphery, viable myocytes tug on adjacent fibers during systole, producing the characteristic waviness. The infarct core is hypo-cellular with meshy eosinophilic areas and early inflammatory cells beginning to infiltrate, consistent with the 6–12 hour window after ischemic onset. These histologic changes reflect irreversible injury, rapid necrosis, and initiation of repair processes. Clinically, recognition of wavy fibers and coagulative necrosis supports an acute MI diagnosis and helps estimate timing, guiding anti-ischemic therapy, reperfusion decisions, and prognostic assessment. This image is representative in education and research contexts for teaching infarct evolution, distinguishing acute from subacute tissue changes, and illustrating the border zone pathophysiology in cardiology and pathology education. This micrograph serves as a teaching tool for students, residents, and researchers studying ischemic injury timelines, scar formation, and therapeutic windows in infarcted myocardium.
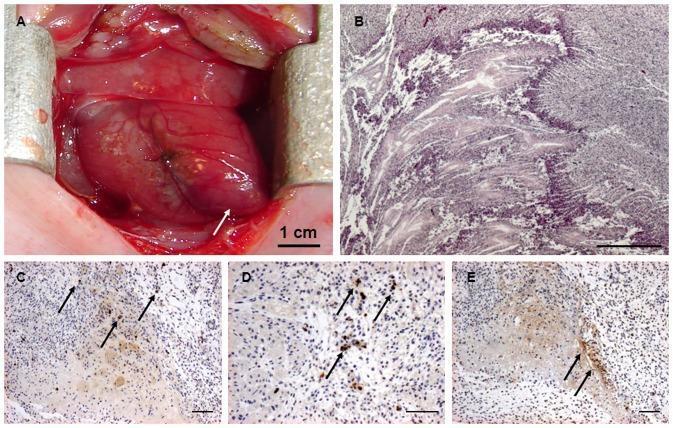
This composite educational image illustrates the macroscopic and microscopic features of an acute myocardial infarction (MI) in a fetal sheep model. Panel A is a clinical photograph showing the heart in situ during surgery; a white arrow indicates the anterior-apical region, which exhibits a distinct purple discoloration signifying acute ischemia and tissue necrosis. Panel B shows a Hematoxylin and Eosin (H&E) stained histological section (scale bar 500 μm) demonstrating myocardial necrosis characterized by loss of classical fiber morphology, nuclei, and cardiac proteins compared to healthy tissue. Panels C and D (scale bar 100 μm) utilize immunohistochemistry to show positive staining for activated caspase-3 (black arrows), a marker of the pro-apoptotic pathway. Panel E (scale bar 100 μm) presents a TUNEL assay (black arrows) identifying DNA fragmentation. Together, these panels demonstrate the progression of ischemic injury from gross vascular compromise to programmed cardiomyocyte cell death, providing essential visual markers for cardiovascular pathology and embryological research.
healed myocardial infarction fibrosis scar histology microscopy
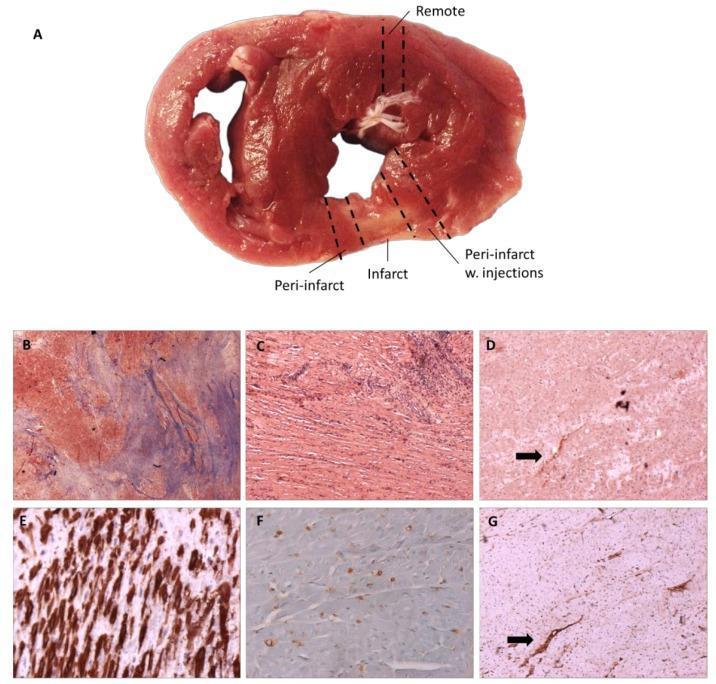
This composite educational image illustrates myocardial histology following infarction. Panel A displays a gross clinical photograph of a transverse heart section (minipig model), with dashed lines demarcating 'Remote', 'Infarct', and 'Peri-infarct' sampling regions. Panels B and C show light microscopy of the infarcted tissue; Masson’s Trichrome (B) reveals significant collagen deposition (blue staining), indicating fibrosis, while Hematoxylin-eosin (C) demonstrates myocyte arrangement and cellular infiltration. Panels D through G utilize immunohistochemistry (IHC) to identify molecular markers in the peri-infarct and infarct areas. Integrin αvβ3 (D) and CD31 (G) staining (light brown) highlight neo-angiogenesis and endothelial structures, with arrows indicating co-localized vascular expression. Alpha-smooth muscle actin (E) shows dense brown staining of myofibroblasts within the scar tissue. CD68 (F) displays punctate brown staining consistent with macrophage infiltration. This visual material is used to teach concepts related to tissue remodeling, fibrotic scar formation, and the inflammatory response in ischemic heart disease.
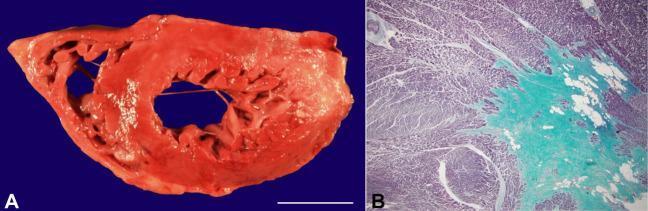
This composite educational resource demonstrates the pathology of chronic myocardial infarction through gross and microscopic examination. Image A is a clinical photograph showing a fresh transverse section of the human heart at the ventricular level. The myocardium exhibits a predominantly reddish-brown hue with visible transmural thinning and whitish, fibrotic scarring in the lateral and posterior walls of the left ventricle. A focal area of subendocardial fibrosis is also visible in the anterior ventricle. A 3 cm scale bar is included for morphometric reference. Image B is a light microscopy image at 20x magnification using Gomori trichrome stain, which highlights tissue composition. The viable cardiomyocytes are stained reddish-purple, while dense collagenous scar tissue (fibrosis) is stained bright blue-green, illustrating the replacement of necrotic muscle fibers with connective tissue. This finding is characteristic of a remote or healed myocardial infarct. This material is suitable for cardiovascular pathology education, illustrating the progression from myocardial injury to permanent scarring and ventricular remodeling.
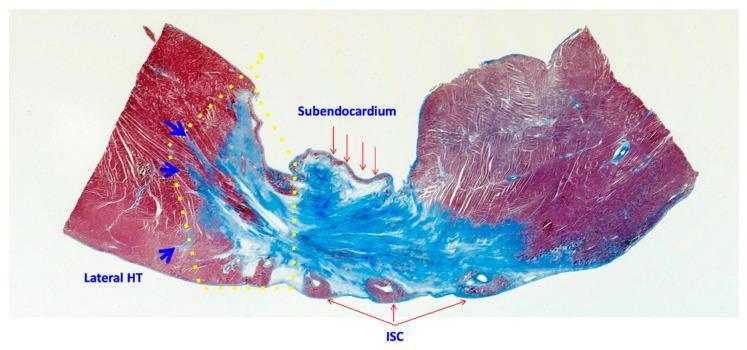
This diagnostic image is a low-magnification microscopy cross-section of myocardial tissue stained with Masson’s Trichrome, illustrating the histopathology of a healed myocardial infarction. The stain differentiates between collagenous fibrosis (blue) and viable myocardium/myocytes (red). The image highlights four distinct morphological zones: 1) A Central Dense Scar, characterized by a large, solid blue region entirely devoid of myocytes; 2) The Subendocardium, shown as the superficial blue layer lining the inner ventricular surface; 3) The Lateral Heterogeneous Tissue (HT), delineated by a yellow dotted line, which displays a transitional morphology where blue fibrotic strands (indicated by blue arrows) infiltrate and interdigitate with red viable muscle bundles; and 4) Intra-scar Channels (ISC), identified as small, circular red islands of surviving myocytes nested within the dense blue fibrotic region. This visual is used to demonstrate the complex structural substrate of cardiac scars, which can serve as pathways for reentrant ventricular tachycardia (VT) in clinical cardiology and electrophysiology.
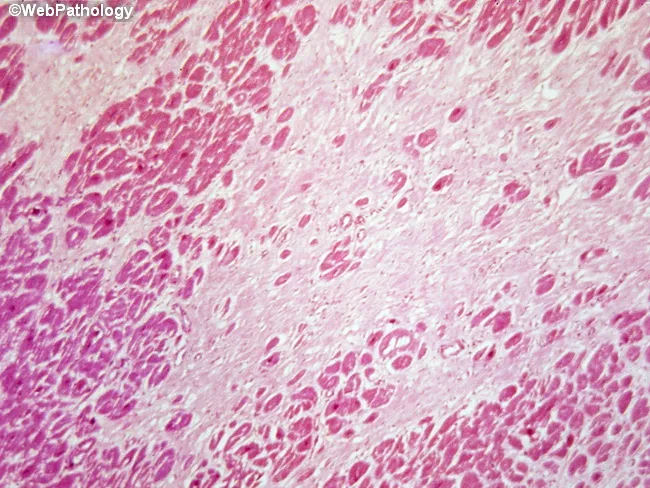
Histopathology of cardiac tissue displaying a healed myocardial infarction with dense collagenous scar replacing necrotic myocardium. Hematoxylin and eosin (H&E) stained section reveals extensive fibrous scar interposed between islands of residual viable myocytes, with loss of normal myofiber architecture and diminished cross‑striations. The scar tissue appears eosinophilic and tightly organized, forming collagen bundles that disrupt parenchymal continuity. In this chronic stage, inflammatory cells are minimal or absent, and granulation tissue is not prominent, consistent with scar maturation. The histologic pattern reflects replacement-type fibrosis and perpetual remodeling of the left ventricular wall; the infarct age is difficult to ascertain from morphology once the scar has matured, as features of early healing (neutrophilic infiltrates, macrophage activity, neovascularization) have resolved. Clinical relevance centers on remote myocardial injury, reduced compliance, potential regional wall motion abnormalities, and arrhythmogenic substrate. The specimen demonstrates a structural basis for prior ischemic insult, guiding clinical correlation with patient history of chest pain or elevated cardiac enzymes. This image is valuable for educational purposes in cardiopathology, illustrating differentiation of healed infarct from ongoing ischemia, active myocarditis, or nonspecific fibrous scar, and highlighting the diagnostic significance of replacement fibrosis in coronary artery disease. Correlate clinically for prognosis and therapeutic planning assessment.
Microscopic Features of Myocardial Infarction
ACUTE MYOCARDIAL INFARCTION
0 - 0.5 hours (Reversible Injury)
- Light microscopy: No visible changes
- Electron microscopy: Relaxation of myofibrils, glycogen loss, mitochondrial swelling
0.5 - 4 hours
- Usually no light microscopic changes
- Variable waviness of fibers at the border - caused by viable adjacent myocardium tugging on non-contractile dead fibers during systole
- EM: Sarcolemmal disruption, mitochondrial amorphous densities (irreversible injury begins)
4 - 12 hours
- Early coagulative necrosis - ghost outlines of cells with preserved architecture but dead cells
- Interstitial edema and hemorrhage
- Myocyte cytoplasmic hypereosinophilia (increased pink staining due to protein denaturation)
- Loss of cross-striations
12 - 24 hours
- Ongoing coagulative necrosis with loss of nuclei and striations
- Pyknosis of nuclei (nuclear condensation)
- Marginal contraction band necrosis - hypereosinophilic transverse bands of contracted sarcomeres (especially prominent after reperfusion)
- Early neutrophilic infiltrate begins
1 - 3 days
- Mottling with yellow-tan infarct center grossly
- Coagulative necrosis well established: loss of nuclei and striations
- Brisk interstitial infiltrate of neutrophils (most prominent in this window) - the hallmark of this stage
Image A & B below (Robbins Fig. 12.13): Panel A shows 1-day-old infarct with coagulative necrosis and wavy fibers (narrow, elongated, vs. normal fibers on the right), edema, and scattered neutrophils. Panel B shows the dense neutrophilic infiltrate of a 3-4 day-old infarct.
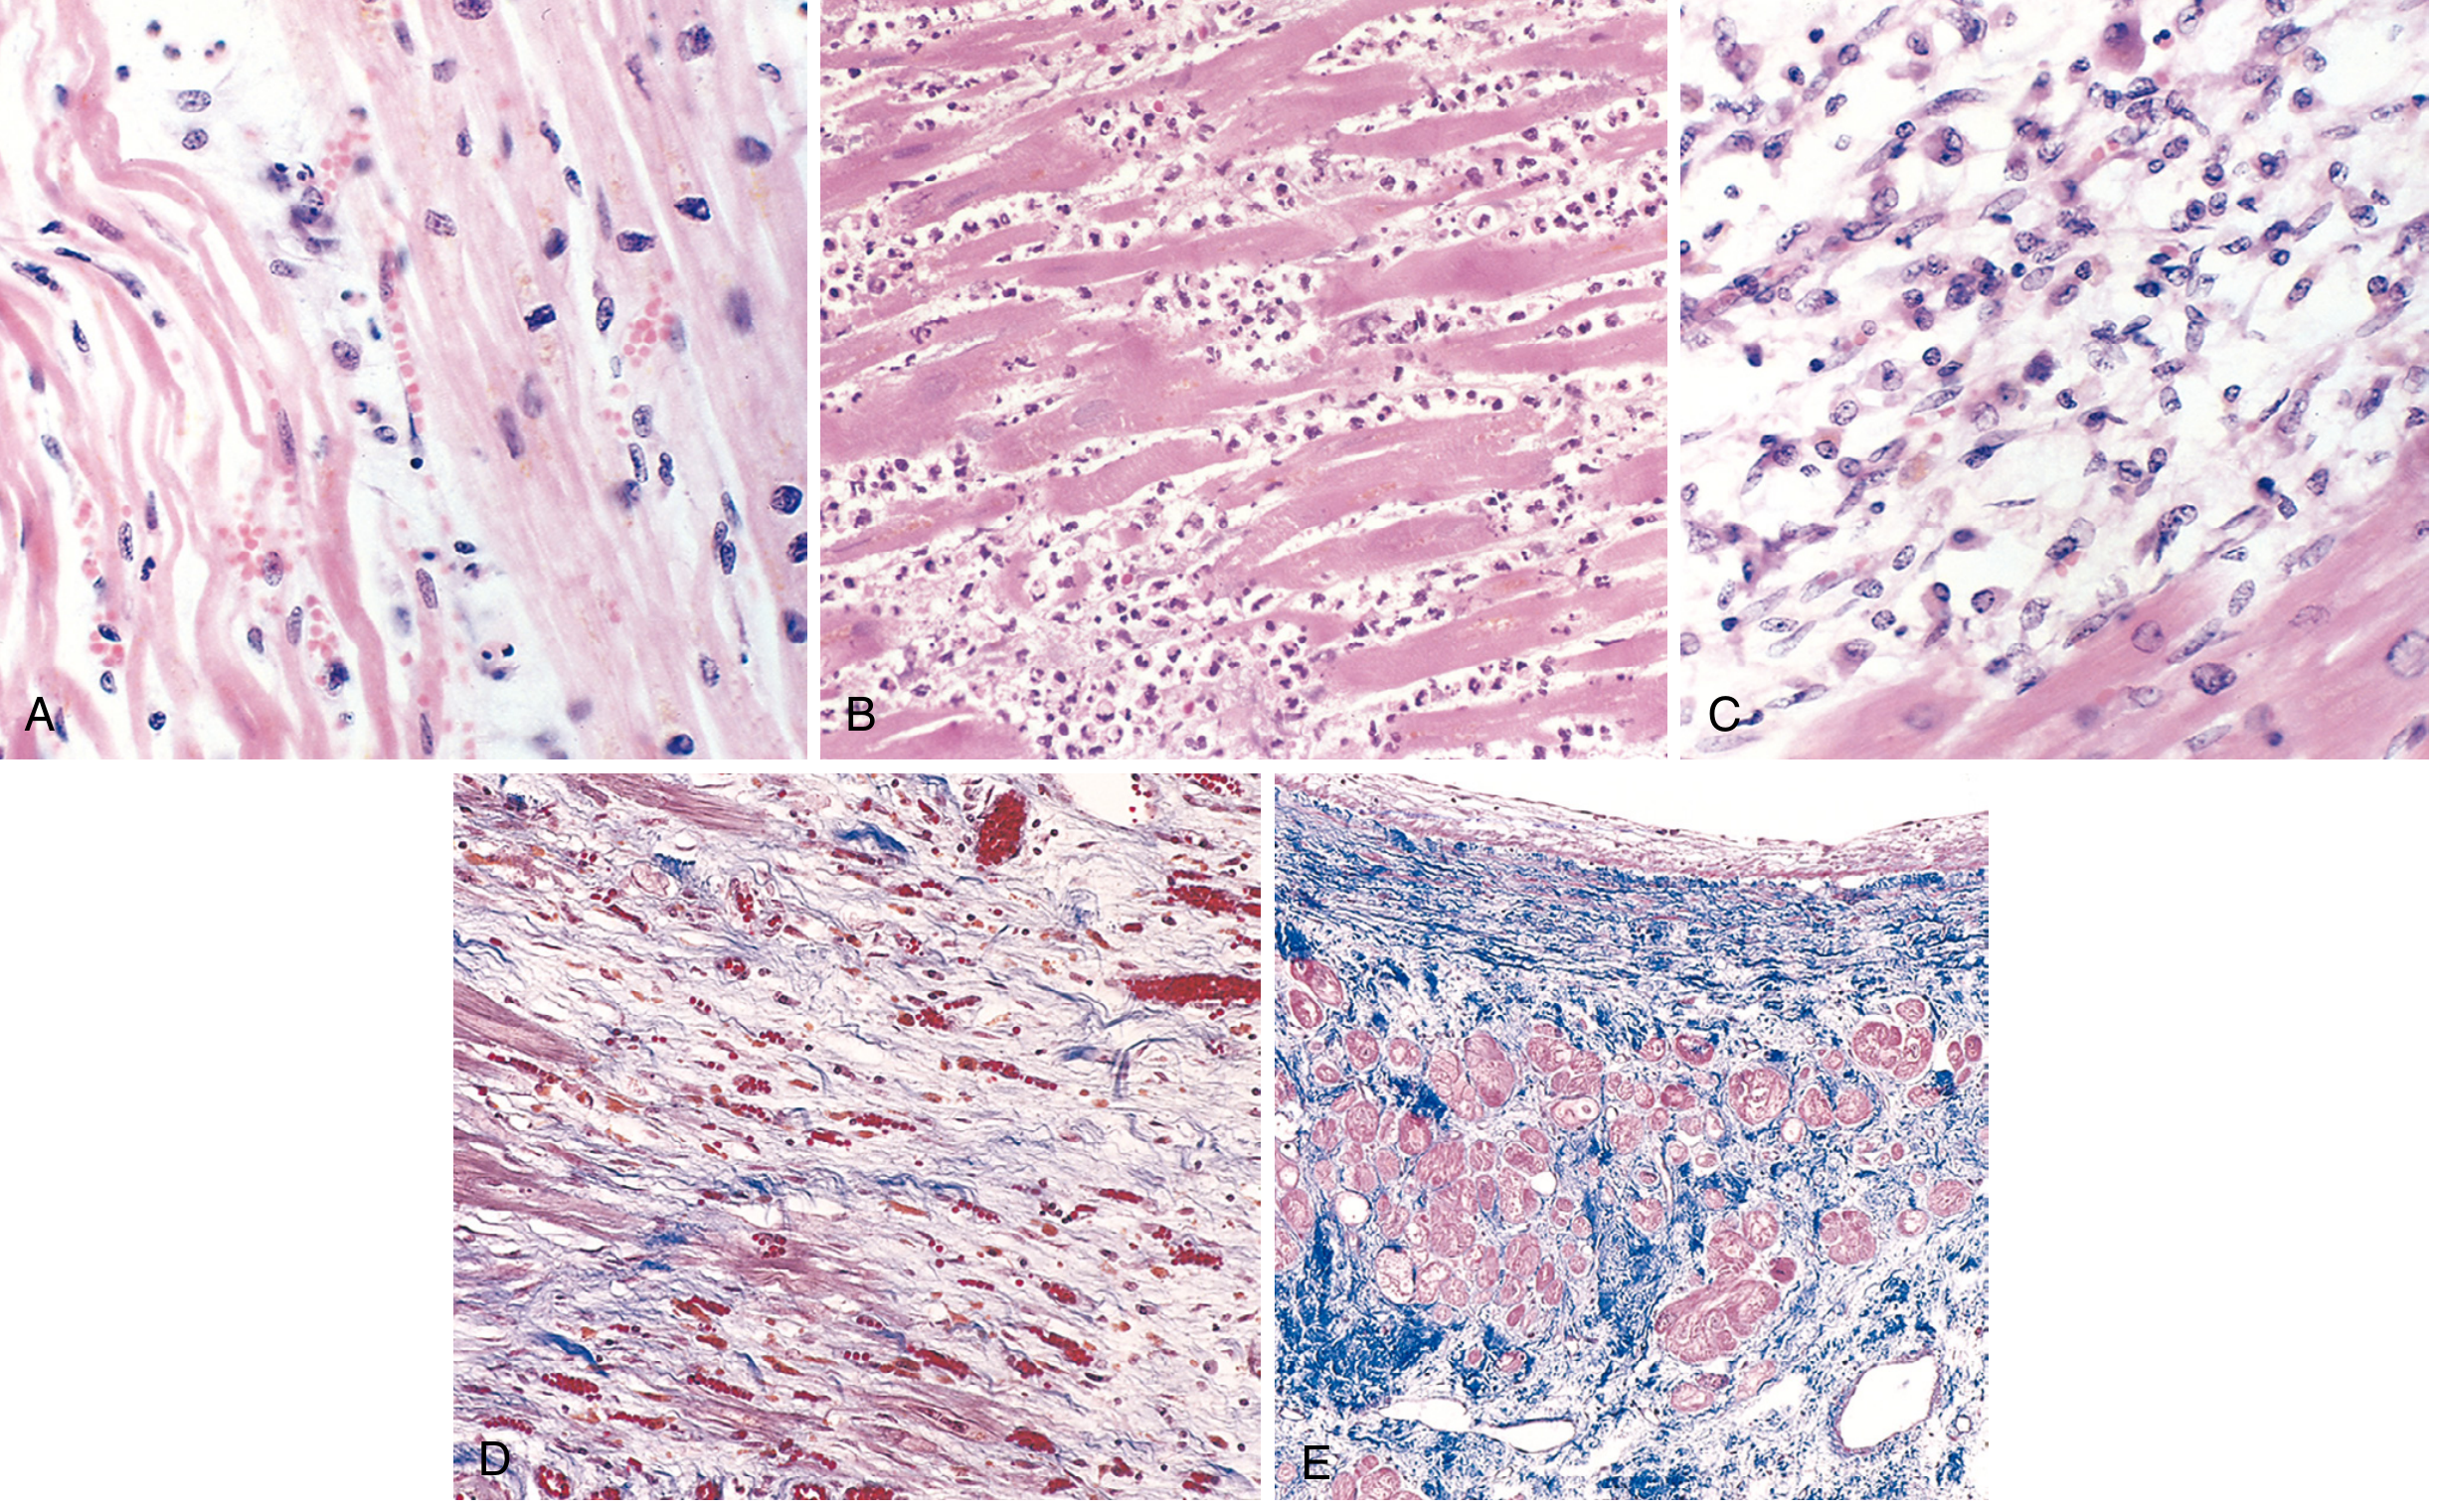
3 - 7 days (Subacute / Early Repair)
- Disintegration of dead myofibers
- Macrophage infiltration begins - these cells phagocytose the necrotic myocytes and neutrophil debris (Panel C above)
- Beginning of granulation tissue formation at the infarct margins
7 - 10 days
- Granulation tissue - the dominant feature: loose collagen, abundant new capillaries (neovascularization), and fibroblasts (Panel D above)
- Macrophage phagocytosis at its peak - "tombstone" empty sarcolemmal tubes visible
- Healing proceeds from the infarct border inward
HEALED MYOCARDIAL INFARCTION
Microscopic Features of Healed MI:
| Feature | Description |
|---|---|
| Replacement fibrosis | Dense collagenous scar replacing the necrotic myocardium entirely |
| Absence of myocytes | No residual cardiomyocytes in the scar zone |
| No inflammation | Inflammatory cells (neutrophils, macrophages) are absent |
| No granulation tissue | Vascular granulation tissue has resolved |
| Collagen bundles | Tightly organized, eosinophilic bundles disrupt normal parenchymal architecture |
| Residual hypertrophy | Adjacent surviving myocytes show compensatory hypertrophy (enlarged cells, prominent nuclei) |
| Masson trichrome stain | Scar stains bright blue (collagen), viable muscle stains red/pink |
Zones visible in healed MI (Masson trichrome):
- Central dense scar - solid blue, entirely devoid of myocytes
- Subendocardium - superficial blue fibrotic layer lining the inner ventricular surface
- Lateral heterogeneous tissue - transitional zone where blue fibrotic strands interdigitate with red viable muscle bundles
- Intra-scar channels - small islands of surviving myocytes within the dense scar (arrhythmogenic substrate for re-entrant VT)
Summary Table (Robbins, Table 12.5)
| Time | Light Microscopy Findings |
|---|---|
| 0-0.5 hr | None |
| 0.5-4 hr | Waviness of fibers at border |
| 4-12 hr | Early coagulative necrosis; edema; hemorrhage |
| 12-24 hr | Coagulative necrosis; pyknotic nuclei; hypereosinophilia; contraction bands; early neutrophil infiltrate |
| 1-3 days | Coagulative necrosis; loss of nuclei/striations; brisk neutrophilic infiltrate |
| 3-7 days | Macrophage infiltration; phagocytosis of dead cells; early granulation tissue at margins |
| 7-10 days | Well-developed granulation tissue; loose collagen; abundant capillaries |
| 2-8 weeks | Progressive fibrosis replacing granulation tissue |
| >2 months | Dense collagenous scar; no inflammation; compensatory myocyte hypertrophy at margins |