
How to calculate paracetamol drug dose calculation
paracetamol acetaminophen dose calculation adults children mg/kg
paracetamol dose calculation chart adults children
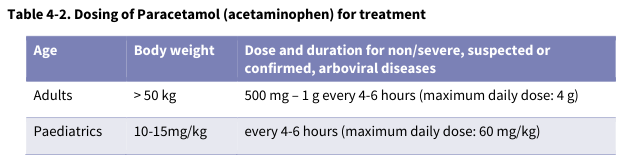
Table 4-2. Dosing of Paracetamol (acetaminophen) for treatment <table><thead><tr><th>Age</th><th>Body weight</th><th>Dose and duration for non/severe, suspected or confirmed, arboviral diseases</th></tr></thead><tbody><tr><td>Adults</td><td>> 50 kg</td><td>500 mg – 1 g every 4-6 hours (maximum daily dose: 4 g)</td></tr><tr><td>Paediatrics</td><td>10-15mg/kg</td><td>every 4-6 hours (maximum daily dose: 60 mg/kg)</td></tr></tbody></table>
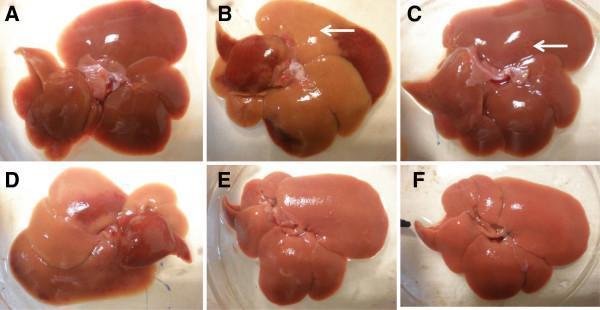
Comparison chart featuring six macroscopic clinical photographs (A–F) of rat livers, serving as a preclinical model for drug-induced liver injury (DILI) and hepatoprotection. (A) Control group: Displays a normal, healthy liver with smooth texture and uniform dark maroon coloration. (B) Paracetamol-intoxicated group (3 g/kg): Shows severe hepatotoxicity characterized by large areas of pale tan/brown discoloration (white arrow) and loss of normal vascular appearance, indicative of massive necrosis. (C) Positive control (200 mg/kg silymarin + paracetamol): Demonstrates significant protection, appearing similar to the control with only a localized tiny hemorrhage spot (white arrow). (D–F) Experimental groups (MEMM pre-treatment at 50, 250, and 500 mg/kg + paracetamol): Illustrates a dose-dependent hepatoprotective effect. The low-dose liver (D) remains pale and discolored, while the higher doses (E and F) show a progressive return to normal morphology, smooth surface integrity, and healthy reddish-brown coloration. This series is used in pharmacology and toxicology to visually assess the efficacy of plant extracts in mitigating chemical-induced hepatic damage.
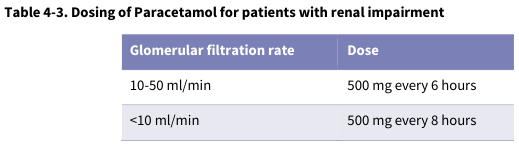
Table 4-3. Dosing of Paracetamol for patients with renal impairment <table><caption>Table 4-3. Dosing of Paracetamol for patients with renal impairment</caption><thead><tr><th>Glomerular filtration rate</th><th>Dose</th></tr></thead><tbody><tr><td>10-50 ml/min</td><td>500 mg every 6 hours</td></tr><tr><td><10 ml/min</td><td>500 mg every 8 hours</td></tr></tbody></table>
Paracetamol (Acetaminophen) Dose Calculation
The Core Formula
Dose (mg) = Weight (kg) × Dose per kg (mg/kg)
Standard Doses by Population
Adults (>50 kg)
| Route | Dose | Frequency | Max Daily Dose |
|---|---|---|---|
| Oral / Rectal | 500 mg - 1 g | Every 4-6 hours | 3,000-4,000 mg/day |
| IV (infusion over 15 min) | 1,000 mg | Every 6 hours | 4,000 mg/day |
Important: Morgan & Mikhail's Clinical Anesthesiology now recommends a maximum of 3,000 mg/day in adults (reduced from the older 4,000 mg/day guideline) to reduce hepatotoxic risk.
Paediatrics (Weight-Based)
| Child's Weight | Dose per dose (at 15 mg/kg) | Frequency | Max Daily |
|---|---|---|---|
| 3 kg (neonate) | 45 mg | Every 6-8 hours | ~60 mg/kg/day |
| 6 kg (2 months) | 90 mg | Every 4-6 hours | 60 mg/kg/day |
| 10 kg (1 year) | 150 mg | Every 4-6 hours | 60 mg/kg/day |
| 15 kg (3-4 years) | 225 mg | Every 4-6 hours | 60 mg/kg/day |
| 20 kg (5-6 years) | 300 mg | Every 4-6 hours | 60 mg/kg/day |
| 30 kg (9-10 years) | 450 mg | Every 4-6 hours | 60 mg/kg/day |
| >50 kg | Use adult dose (500 mg-1 g) | Every 4-6 hours | 4 g/day |
Summary Dosing Table
Step-by-Step Calculation Example
-
Calculate dose range:
- Low end: 18 kg × 10 mg/kg = 180 mg
- High end: 18 kg × 15 mg/kg = 270 mg
-
Choose a dose within range (e.g., 240 mg is a practical rounded dose)
-
Calculate volume from suspension concentration (160 mg/5 mL):
- Volume = (Dose ÷ Concentration) × Volume per unit
- Volume = (240 ÷ 160) × 5 = 7.5 mL
Dosing in Special Populations
Renal Impairment
| GFR (mL/min) | Dose Adjustment |
|---|---|
| 10-50 mL/min | 500 mg every 6 hours |
| <10 mL/min | 500 mg every 8 hours |
Hepatic Impairment
- Use with caution - paracetamol is metabolized by the liver
- Reduce dose or increase intervals
- Avoid in severe hepatic failure
Obese Patients
- Use Ideal Body Weight (IBW) or Normal Fat Mass (NFM) rather than total body weight for maintenance dosing
- Loading dose can be based on actual body weight
Formulation Guide
| Formulation | Concentration | Notes |
|---|---|---|
| Oral suspension (infant/child) | 160 mg/5 mL | Most common pediatric form |
| Chewable tablets | 80 mg or 160 mg | Children >2 years |
| Adult tablets | 325 mg, 500 mg, 650 mg | Children >12 years / adults |
| IV infusion | 10 mg/mL (1 g/100 mL) | Infuse over 15 minutes |
| Suppositories | 80, 120, 325, 650 mg | Same dose as oral |
Key Safety Rules
- Never exceed the maximum daily dose - the most common cause of drug error
- Count ALL sources of paracetamol (combination cold/flu remedies often contain it)
- Risk factors for toxicity: alcoholism, malnutrition, liver disease, concurrent isoniazid, rifampicin, or barbiturates
- Overdose antidote: N-acetylcysteine (NAC) - given urgently in overdose
- Weight-based dosing is more accurate than age-based in children
Paracetamol in ml calculation
paracetamol oral suspension mL volume calculation chart children
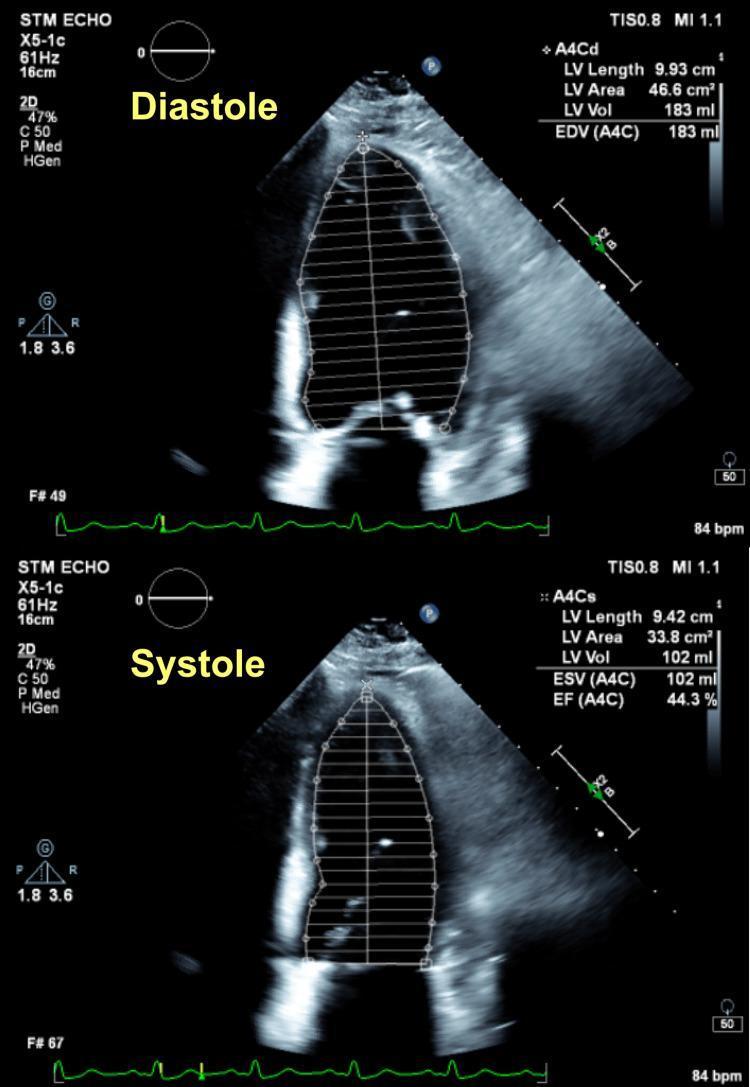
A comparison chart containing two panels of a transthoracic echocardiogram (TTE) in the apical four-chamber (A4C) view, illustrating the calculation of left ventricular ejection fraction (LVEF) using the Simpson's method of disks. The top panel, labeled 'Diastole', shows the end-diastolic phase with a segmented trace outlining the left ventricular cavity. Measurements displayed include an LV Length of 9.93 cm, LV Area of 46.6 cm², and an End-Diastolic Volume (EDV) of 183 ml. The bottom panel, labeled 'Systole', displays the end-systolic phase with a trace measuring an LV Length of 9.42 cm, LV Area of 33.8 cm², and an End-Systolic Volume (ESV) of 102 ml. Based on these volumetric measurements, a calculated Ejection Fraction (EF) of 44.3% is provided. An integrated electrocardiogram (ECG) strip at the bottom of each panel correlates the visual frames with the cardiac cycle. This diagnostic image demonstrates the assessment of systolic function in a patient with a history of coronary artery disease.
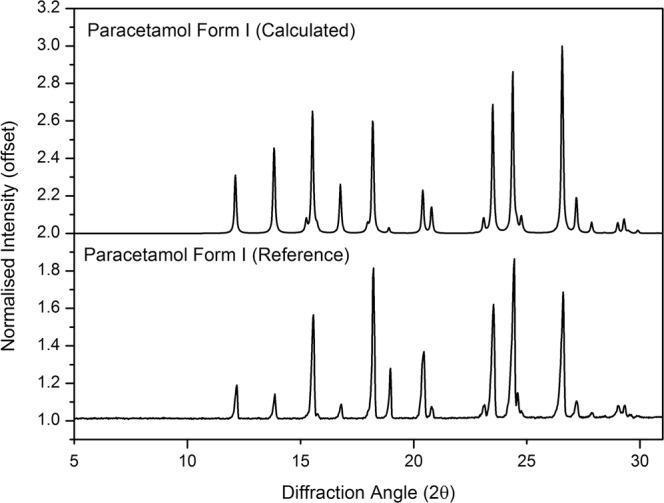
This Comparison Chart displays X-ray Powder Diffraction (XRPD) patterns for Paracetamol Form I, a common analgesic and antipyretic pharmacological agent. The graphic consists of two vertically stacked plots: the top represents the 'Calculated' pattern derived from the Cambridge Structural Database (CSD), and the bottom represents the 'Reference' (measured) experimental pattern. The x-axis measures the Diffraction Angle (2θ) from 5 to 30 degrees, while the y-axis shows Normalized Intensity with an offset. Both plots exhibit distinct, sharp Bragg peaks characteristic of a highly crystalline material. The peaks in both the calculated and reference patterns align at nearly identical 2θ positions—specifically notable around 12, 15, 18, 24, and 27 degrees—confirming the identity of the polymorphic form (Form I). This diagnostic comparison is used in pharmaceutical science to verify the physical form and purity of an active pharmaceutical ingredient (API) after processing, such as 3D printing or grinding, ensuring no phase transformation or amorphization has occurred.
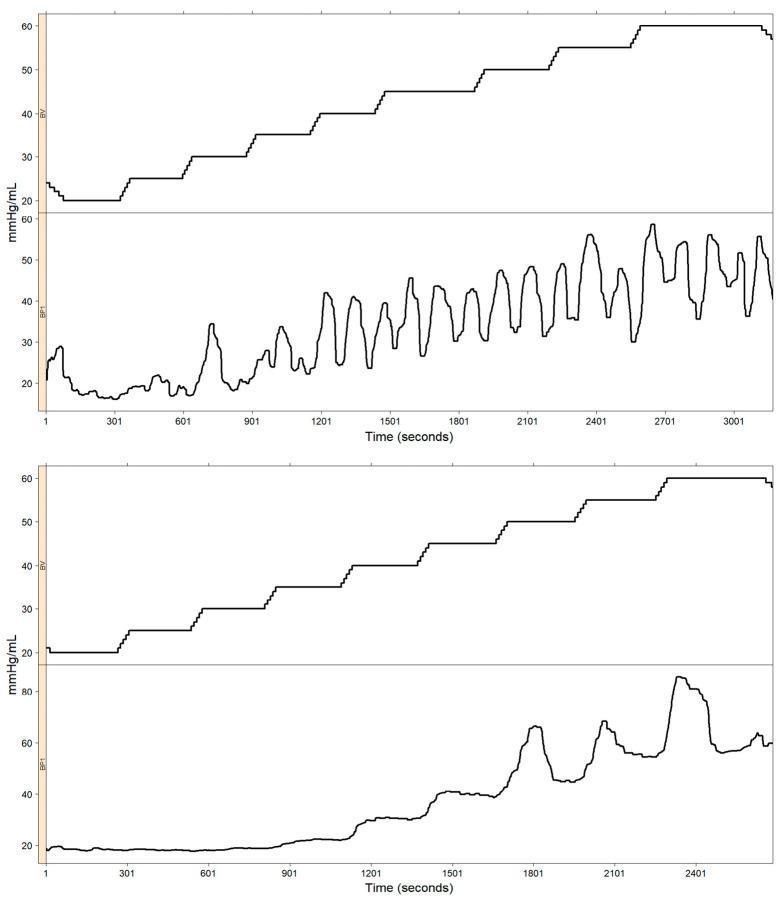
This comparison chart displays time-series data from two different EndoFLIP (Endoluminal Functional Lumen Imaging Probe) measurements, evaluating the volume-pressure relationship in the esophagus. Each panel (upper and lower) consists of two synchronous plots: a top plot showing balloon volume (BV in mL) and a bottom plot showing intra-balloon pressure (BP1 in mmHg) over approximately 3000 seconds. Both panels demonstrate a controlled, stepwise increase in balloon volume from 20 mL to 60 mL. The upper panel illustrates a successful monotonic relationship where pressure increases and oscillates concurrently with volume increments, indicating reliable distensibility data. In contrast, the lower panel depicts a 'failed' monotonic relationship; intra-balloon pressure remains abnormally low and non-responsive during initial volume steps, only showing a significant rise after 1201 seconds. This discrepancy may indicate technical artifacts such as balloon twisting or squeezing, which interfere with the sensor's ability to record uniform pressure. These charts are essential for identifying quality control issues in impedance planimetry studies used to assess esophageal motility and distensibility.
paracetamol mL calculation formula oral suspension IV infusion pediatric adult
Paracetamol mL Calculation
The Master Formula
Step-by-Step Method
| Step | Action |
|---|---|
| 1 | Find patient weight in kg |
| 2 | Calculate dose: Weight (kg) × 10-15 mg/kg = Dose in mg |
| 3 | Check the label concentration (mg/mL or mg/5 mL) |
| 4 | Apply the formula to get mL |
Worked Examples
Example 1 - Child, Oral Suspension (most common)
Patient: 12 kg child, paracetamol syrup 120 mg/5 mL
- Step 1: Dose = 12 kg × 15 mg/kg = 180 mg
- Step 2: Volume = (180 ÷ 120) × 5 = 7.5 mL
Example 2 - Child, Oral Suspension (160 mg/5 mL)
Patient: 20 kg child, syrup 160 mg/5 mL (common in US/UK)
- Dose = 20 × 15 = 300 mg
- Volume = (300 ÷ 160) × 5 = 9.4 mL
Example 3 - Child, Oral Suspension (250 mg/5 mL)
Patient: 10 kg child, syrup 250 mg/5 mL (common in India - Calpol DS, Metacin)
- Dose = 10 × 15 = 150 mg
- Volume = (150 ÷ 250) × 5 = 3 mL
Example 4 - IV Paracetamol (10 mg/mL)
Patient: 25 kg child, IV paracetamol 10 mg/mL (standard IV concentration)
- Dose = 25 × 15 = 375 mg
- Volume = 375 ÷ 10 = 37.5 mL (infuse over 15 minutes)
Adult >50 kg: 1 g dose = 1000 ÷ 10 = 100 mL IV
Ready-Reference IV mL Chart (15 mg/kg, 10 mg/mL)
| Weight (kg) | Dose (mg) | Volume (mL) |
|---|---|---|
| 4 | 60 | 6 |
| 6 | 90 | 9 |
| 8 | 120 | 12 |
| 10 | 150 | 15 |
| 12 | 180 | 18 |
| 15 | 225 | 22.5 |
| 20 | 300 | 30 |
| 25 | 375 | 37.5 |
| 30 | 450 | 45 |
| 40 | 600 | 60 |
| >50 | 1000 | 100 |
Common Formulations & Concentrations at a Glance
| Formulation | Concentration | Common in |
|---|---|---|
| Infant drops | 100 mg/mL | Neonates/infants |
| Oral suspension | 120 mg/5 mL (24 mg/mL) | UK/India (younger children) |
| Oral suspension | 160 mg/5 mL (32 mg/mL) | US (Children's Tylenol) |
| Oral suspension DS | 250 mg/5 mL (50 mg/mL) | India (Calpol DS, Metacin) |
| IV infusion | 10 mg/mL | Hospital IV (all ages) |
Quick Formula Reminder by Formulation
| Label says | Formula |
|---|---|
| 120 mg/5 mL | mL = (Dose ÷ 120) × 5 |
| 160 mg/5 mL | mL = (Dose ÷ 160) × 5 |
| 250 mg/5 mL | mL = (Dose ÷ 250) × 5 |
| 10 mg/mL (IV) | mL = Dose ÷ 10 |
Key Safety Points
- Always check the label concentration before calculating - different brands have different strengths
- Use a graduated syringe, not a household teaspoon
- 1 teaspoon = 5 mL (use only if no syringe is available)
- Never exceed 4 doses in 24 hours in children (5 doses max in some guidelines)
- IV paracetamol must be infused over 15 minutes, not bolused