
Counter current mechanism
countercurrent mechanism kidney loop of Henle diagram
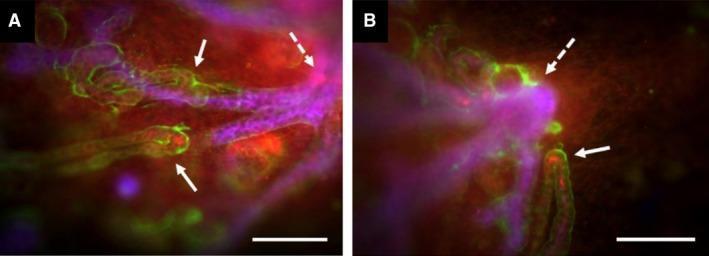
This dual-panel fluorescence microscopy image (A and B) demonstrates the developmental orientation of the loop of Henle in cultured embryonic mouse kidney cortex (E11.5 + 7d). The visual captures two primary tubular systems: the branching collecting duct system, stained purple-blue (CalbindinD28k), and the developing loops of Henle, delineated by green and red signals. The green fluorescence (anti-laminin) marks the basement membranes of the tubules, while the red signal identifies Tamm-Horsfall Protein (THP), a marker for maturing loops of Henle. Solid white arrows highlight the hairpin-like terminal ends or 'tips' of these loops, where red THP expression is most intense. Dotted white arrows point to the primary branch points of the collecting duct network. The images illustrate a clear centripetal growth pattern, where the loops of Henle extend and orient themselves toward the oldest, largest junctions of the collecting duct system. This configuration serves as an educational model for renal morphogenesis and the spatial navigation of nephron segments during kidney development. Scale bars: 200 μm.
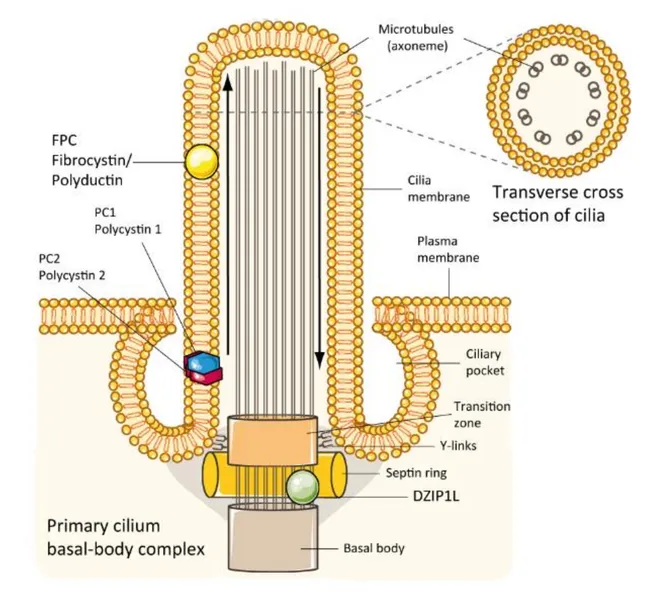
This digital schematic illustration depicts the molecular pathophysiology of autosomal recessive polycystic kidney disease (ARPKD). The image emphasizes a renal tubular epithelial cell with its primary cilium emanating from the apical membrane of a collecting duct/loop of Henle segment. The left side labels the PKHD1-encoded fibrocystin (fibrocystin/polyductin) protein localized to the ciliary membrane and apical plasma membrane, illustrating its role in the ciliopathy pathway alongside polycystin-1 (PC1) and polycystin-2 (PC2). The diagram highlights the basal body–transition zone complex, with DZIP1L positioned at centrioles and the distal basal body, underscoring its necessity for trafficking gene products into the ciliary axoneme. A transverse section inset shows microtubule axonemes and the ciliary pocket, connecting to the primary cilium’s sensory function. Arrows denote intracellular trafficking and-lumen orientation. Dysfunctions in fibrocystin and DZIP1L disrupt ciliary signaling, promoting cystogenesis in ARPKD and reflecting a ciliopathy mechanism shared with other cystic diseases. The illustration also notes that fibrocystin is variably expressed in pancreatic and bile duct epithelium, consistent with multisystem involvement. This visualization serves educational purposes for genetics, nephrology, and cell biology, and supports research into targeted therapies addressing ciliary assembly and trafficking defects. Clinicians and students can correlate genotype–phenotype concepts with this concise framework for learning.
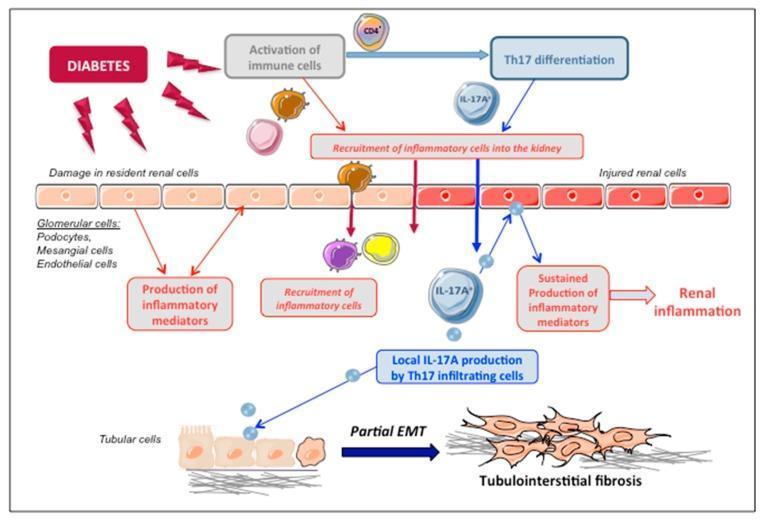
This pathophysiology diagram illustrates the mechanism of IL-17A-mediated renal injury in diabetic nephropathy. The flowchart originates with 'Diabetes' leading to two concurrent pathways: the activation of immune cells and damage to resident renal cells (podocytes, mesangial cells, and endothelial cells). The immune pathway details the differentiation of CD4+ T-lymphocytes into Th17 cells, which infiltrate the kidney and produce local IL-17A. This cytokine acts back on injured renal cells, triggering a feedback loop that leads to the sustained production of inflammatory mediators and chronic renal inflammation. At the cellular level, the diagram highlights the effect of local IL-17A on tubular epithelial cells, depicting a morphological transition labeled as 'Partial EMT' (Epithelial-to-Mesenchymal Transition). Here, structured cuboidal tubular cells transform into elongated, spindle-shaped mesenchymal cells associated with extracellular matrix deposition, ultimately culminating in tubulointerstitial fibrosis. The visual summarizes the interplay between metabolic stress, Th17-driven inflammation, and structural remodeling in the progression of diabetic kidney disease.
Countercurrent Mechanism
What Is a Countercurrent System?
- Ganong's Review of Medical Physiology, 26e, p. 687
Component 1: Countercurrent Multiplier (Loop of Henle)
Anatomical Prerequisites
- About 25% of nephrons are juxtamedullary nephrons whose long loops of Henle dip deep into the medulla (some reaching papillary tips).
- The loop has two functionally opposite limbs running side by side.
Key Membrane Properties (by segment)
| Segment | Water permeability | Solute transport |
|---|---|---|
| Thin descending limb (TDL) | High (aquaporin-1) | Passive; equilibrates with interstitium |
| Thin ascending limb | Low | Passive NaCl diffusion out |
| Thick ascending limb (TAL) | Zero (impermeable to water) | Active Na⁺/K⁺/2Cl⁻ pump (NKCC2) |
Step-by-Step Operation (Ganong's hypothetical model)
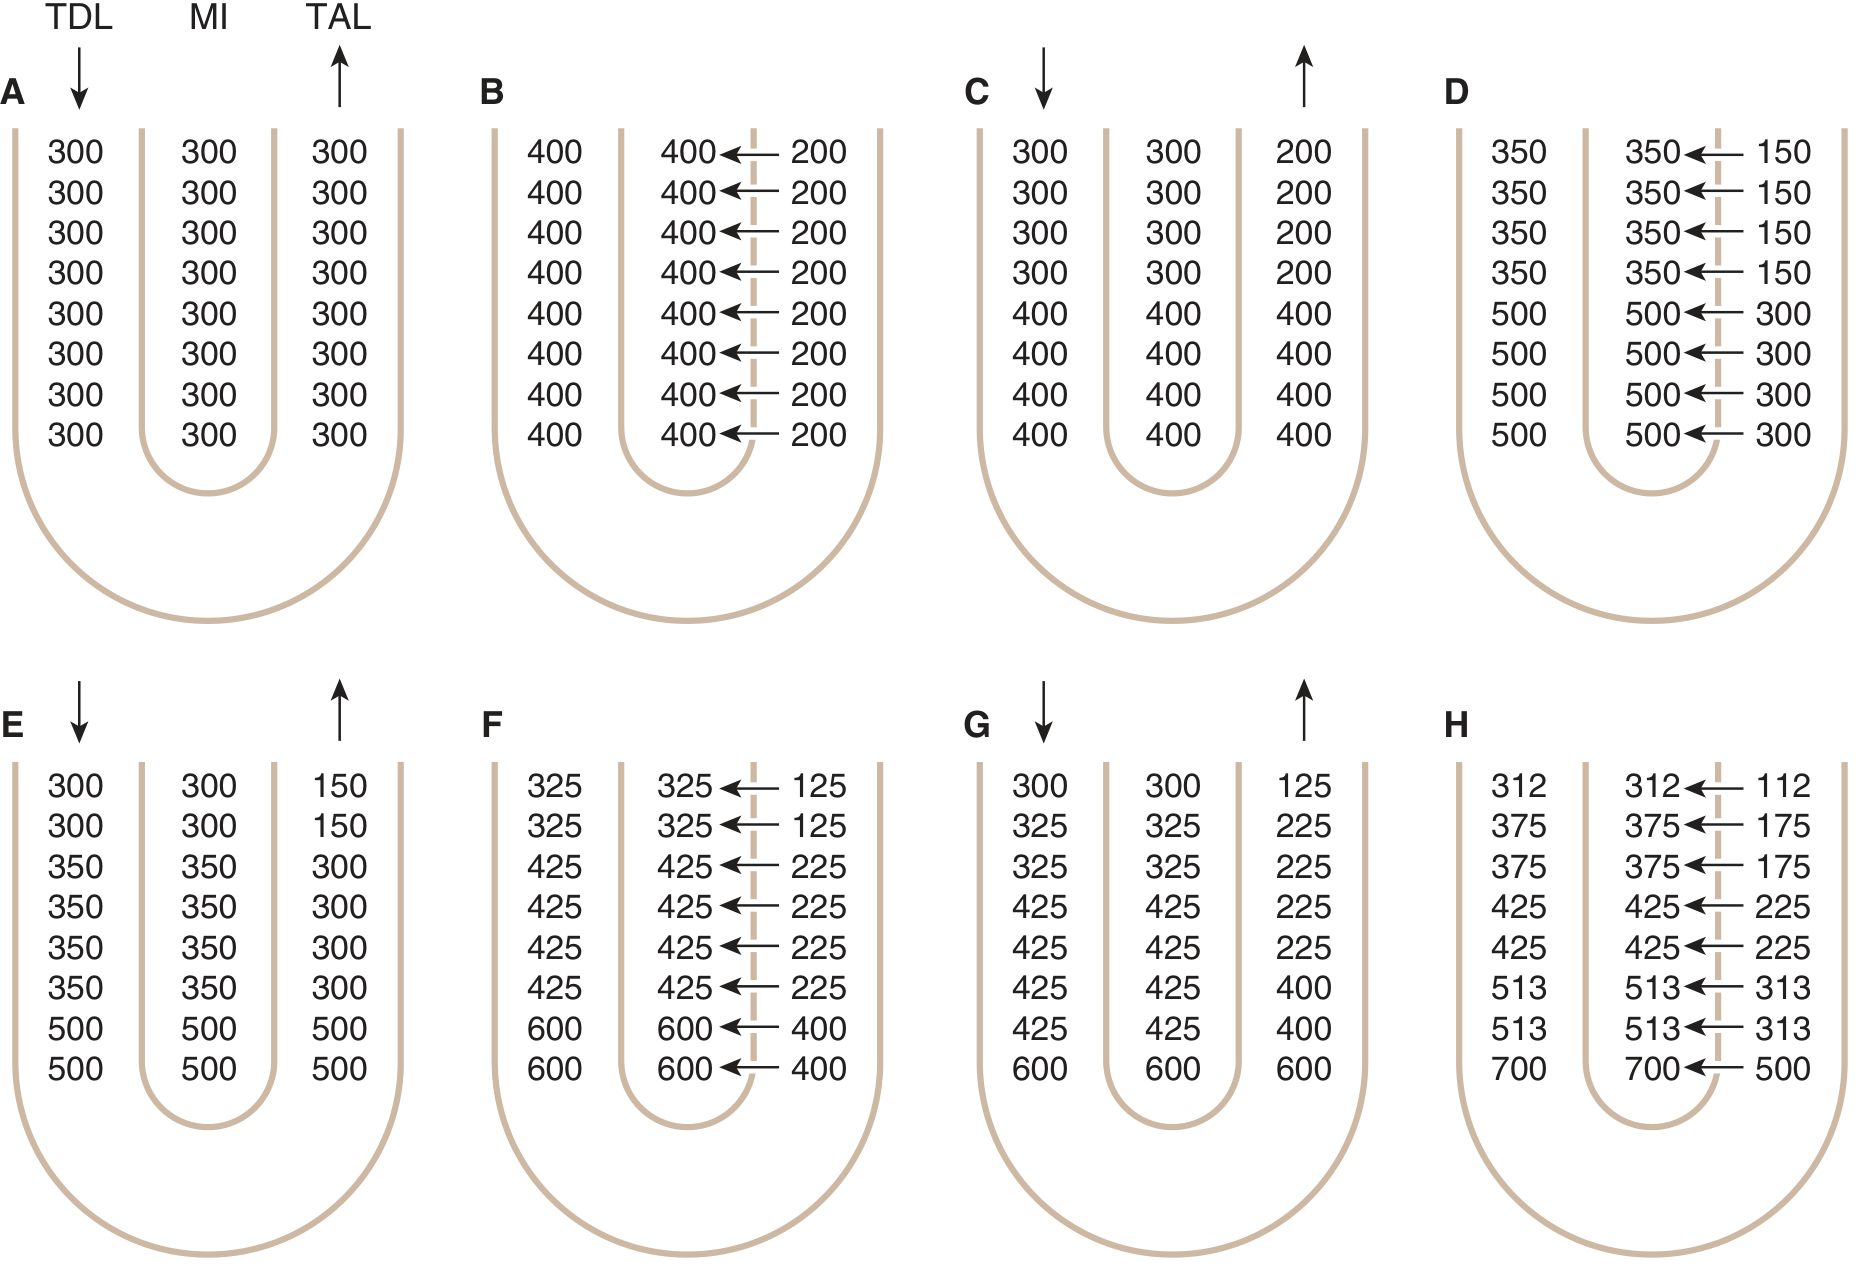
- Guyton & Hall Textbook of Medical Physiology, p. 944-945
Why Juxtamedullary Nephrons Matter
Component 2: Countercurrent Exchanger (Vasa Recta)
- Descending vasa recta: As blood flows down into the increasingly hypertonic medulla, water moves out of the vessel and NaCl/urea diffuse in - blood becomes progressively concentrated.
- Ascending vasa recta: As blood flows back up into the less concentrated cortex, the process reverses - water moves back in and NaCl/urea diffuse out back into the interstitium.
- National Kidney Foundation Primer on Kidney Diseases, 8e, p. 30
Role of Urea
-
In the cortical collecting duct: ADH makes it water-permeable but NOT urea-permeable - water is reabsorbed and urea concentration rises sharply.
-
In the inner medullary collecting duct: UT-A1 and UT-A3 urea transporters (stimulated by ADH/vasopressin) allow concentrated urea to diffuse passively into the interstitium.
-
Some urea re-enters the thin ascending limb of the loop of Henle and recirculates - this "urea recycling" amplifies the gradient.
-
High-protein diet → more urea → better concentrating ability. Malnutrition → impaired concentration.
-
Guyton & Hall, p. 1019-1024
Role of ADH (Vasopressin) - Putting It Together
- ADH absent: The collecting duct remains water-impermeable - dilute urine (~50-100 mOsm/L) is excreted despite the large medullary gradient.
- ADH present: Aquaporin-2 channels are inserted into the apical membrane of collecting duct cells - water flows osmotically into the hypertonic interstitium and is carried away by the ascending vasa recta. Final urine osmolality can reach ~1200 mOsm/L.
Osmolality Changes Along the Nephron (Summary)
| Nephron Segment | Osmolality | Mechanism |
|---|---|---|
| Glomerular filtrate | ~290 mOsm/L | Ultrafiltrate of plasma |
| End of proximal tubule | ~290 mOsm/L | Isosmotic reabsorption |
| Tip of loop of Henle | 800-1200 mOsm/L | Water loss in TDL |
| End of TAL / macula densa | ~290 mOsm/L | NaCl pumped out without water |
| End of distal convoluted tubule | 50-100 mOsm/L | More NaCl removed, no water |
| Final urine (high ADH) | Up to 1200 mOsm/L | Water reabsorption in collecting duct |
| Final urine (no ADH) | 50-100 mOsm/L | Dilute urine passed |
- National Kidney Foundation Primer, 8e, p. 30
Clinical Relevance
- Osmotic diuresis (e.g., diabetic glycosuria, mannitol): Unreabsorbed solutes in tubules hold water, increase loop flow, and wash out the medullary gradient - resulting in dilute, high-volume urine.
- Loop diuretics (furosemide): Block the NKCC2 transporter in the TAL - disrupt active NaCl pumping, collapse the medullary gradient, and abolish concentrating ability.
- Diabetes insipidus: ADH absent (central DI) or ineffective (nephrogenic DI) - medullary gradient intact but collecting duct impermeable to water → massive dilute urine output.
- Malnutrition/low protein intake: Low urea production → reduced medullary osmolality → impaired concentration.