
Electronystagmography and videonystagmography
electronystagmography videonystagmography vestibular testing ENG VNG
![This diagnostic image displays electronystagmography (ENG) or videonystagmography (VNG) tracings recorded during an ophthalmological or vestibular examination. The figure is divided into three sections evaluating eye movement dynamics. The top panel depicts 'Horizontal Eye Position [°]', showing a classic sawtooth wave pattern of spontaneous left-beating nystagmus characterized by a slow rightward drift and a rapid leftward corrective phase. The middle panel shows stable 'Vertical Eye Position [°]' with minimal deviation. The bottom panel illustrates 'Horizontal Eye Position' during a smooth pursuit task, featuring a green sinusoidal target line superimposed with red and blue eye-tracking lines. These tracings exhibit significant saccadic intrusions and oscillations, indicating broken or fragmented pursuit movements where the patient employs catch-up saccades to track the target. The data demonstrates a congenital-type horizontal conjugate nystagmus that intensifies during tracking, relevant for neuro-otological and vestibular diagnostics.](https://cdn.orris.care/cdss_images/pmc_clinical_VQA_70ed686e37e318bf583cc1a3d182e931add3cde3165f0a3ba9a99bd3f6bfb140.jpg)
This diagnostic image displays electronystagmography (ENG) or videonystagmography (VNG) tracings recorded during an ophthalmological or vestibular examination. The figure is divided into three sections evaluating eye movement dynamics. The top panel depicts 'Horizontal Eye Position [°]', showing a classic sawtooth wave pattern of spontaneous left-beating nystagmus characterized by a slow rightward drift and a rapid leftward corrective phase. The middle panel shows stable 'Vertical Eye Position [°]' with minimal deviation. The bottom panel illustrates 'Horizontal Eye Position' during a smooth pursuit task, featuring a green sinusoidal target line superimposed with red and blue eye-tracking lines. These tracings exhibit significant saccadic intrusions and oscillations, indicating broken or fragmented pursuit movements where the patient employs catch-up saccades to track the target. The data demonstrates a congenital-type horizontal conjugate nystagmus that intensifies during tracking, relevant for neuro-otological and vestibular diagnostics.
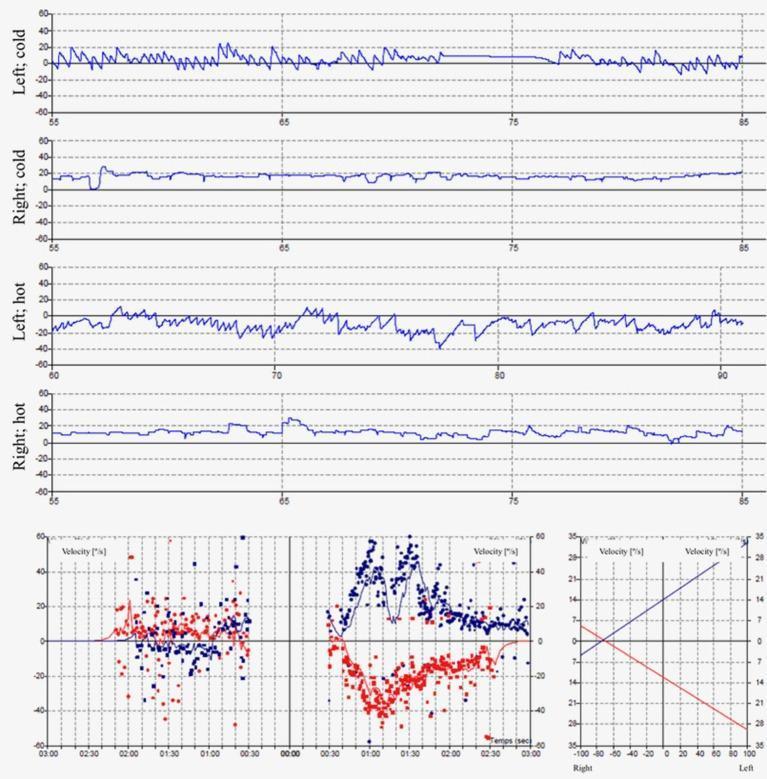
Diagnostic diagnostic traces and charts showing results of a caloric vestibular test, used to assess peripheral vestibular function. The top four panels display Electronystagmography (ENG) or Videonystagmography (VNG) recordings of slow phase velocity (SPV) in degrees per second (°/s) during bithermal caloric irrigation (30°C cold and 44°C hot) for both the left and right ears. The left ear panels demonstrate characteristic nystagmus responses with fluctuating SPV values. In contrast, the right ear panels ('Right; cold' and 'Right; hot') show flat traces with SPV peak values ≤ 5°/s, indicating a diagnosis of right vestibular areflexia. The bottom left quadrant contains a composite scatter plot of nystagmus velocity over time, with red and blue data points representing the fast and slow phases of nystagmus. The bottom right graph provides a summary caloric chart plotting peak velocities to quantify vestibular paresis or directional preponderance. This material is essential for neurology and otolaryngology students studying the diagnostic workup of vertigo, balance disorders, and unilateral vestibular loss.
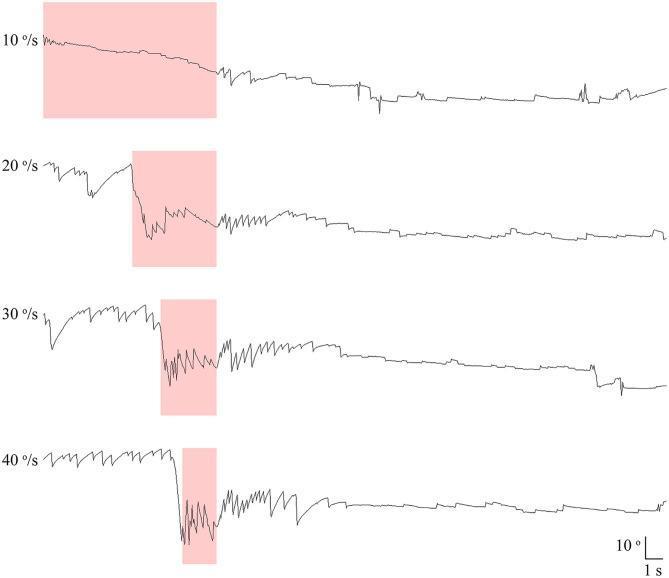
This diagnostic image displays four electronystagmography (ENG) or videonystagmography (VNG) recordings of vertical eye motion in a patient undergoing a motorized rotation chair test. The traces correspond to four different head rotation velocities: 10°/s, 20°/s, 30°/s, and 40°/s. Each recording depicts paroxysmal downbeat nystagmus (DBN) induced during a positioning phase, indicated by shaded pink rectangular areas. There is a direct correlation between rotation velocity and nystagmus intensity; as the velocity increases from 10 to 40°/s, both the amplitude and frequency of the downward deflections (downbeat nystagmus) increase significantly. Following the cessation of positioning, the paroxysmal downbeat nystagmus typically transitions into a lower-amplitude upward deflection, representing a brief upbeat nystagmus. A scale bar at the bottom right indicates 10° for vertical displacement and 1 second for time. This visual aids in understanding the velocity-dependent nature of central positional nystagmus (CPN) and its diagnostic patterns in neuro-otology.
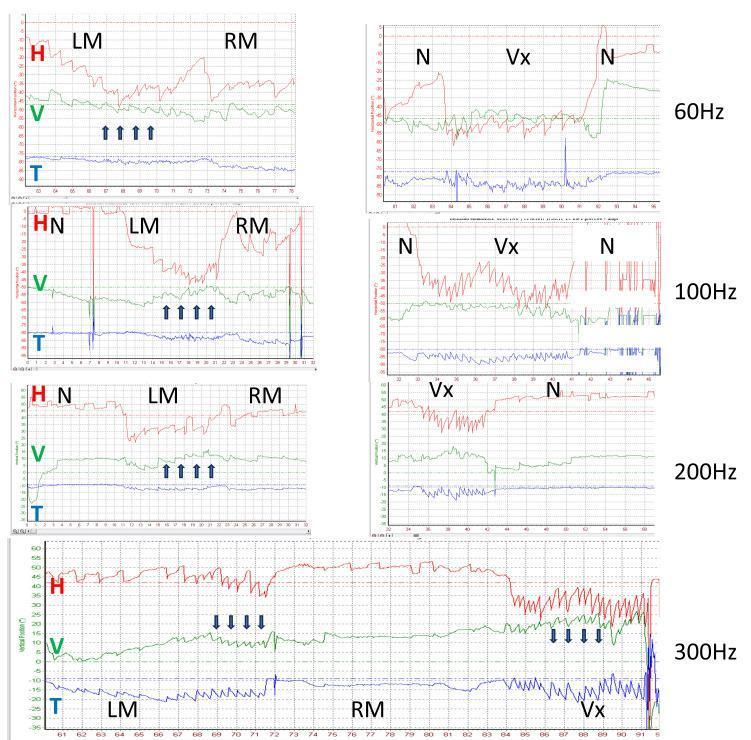
A compilation of three-dimensional videonystagmography (VNG) recordings illustrating stimulus-evoked vestibular-induced nystagmus (SVIN) in a patient with left superior semicircular canal dehiscence (uSCD). The panels display horizontal (H, red), vertical (V, green), and torsional (T, blue) ocular motor components across four bone conduction frequencies: 60 Hz, 100 Hz, 200 Hz, and 300 Hz. The recordings compare different stimulation sites including the left mastoid (LM), right mastoid (RM), vertex (Vx), and baseline no stimulation (N). Key findings demonstrate that the horizontal and torsional components remain consistently left-beating across all frequencies, particularly during vertex stimulation. In contrast, the vertical component exhibits frequency-dependent directionality: it is up-beating (indicated by upward arrows) at 60, 100, and 200 Hz, but reverses to a down-beating pattern (indicated by downward arrows) at 300 Hz. This clinical diagnostic image illustrates the use of high-frequency vibration to evaluate vestibular hypersensitivity and identify semicircular canal pathology.
Electronystagmography (ENG) and Videonystagmography (VNG)
1. Basic Principles
ENG
- Records eye movements indirectly by measuring changes in the corneoretinal potential (CRP) - a steady DC dipole (cornea positive relative to retina, ~1 mV in primary gaze) that rotates with the eyes.
- Skin surface electrodes are placed at each lateral canthus (horizontal movements) and above/below one eye (vertical movements), with a common ground on the forehead.
- As the eyes rotate, the electric field shifts, causing voltage changes proportional to eye position.
- Limitation: cannot detect torsional nystagmus (rotation about the pupil axis does not change the CRP). ENG also picks up more artifact from lid movements and muscle potentials ("noisier" signal).
VNG
- Records eye movements directly using infrared video cameras and digital image-processing technology.
- Eye movements can be observed in real time and/or recorded for review later.
- Advantage over ENG: allows the clinician to go back and visually review the actual recording; enables torsional eye movement measurement (though technology continues to evolve); shows actual nystagmus morphology clearly.
- Disadvantage: cannot record eye movements with eyes closed; head-mounted goggles can be harder to stabilize.
- ENG hardware costs less and still provides reliable clinical data for most purposes.
2. Physiological Basis - Corneoretinal Potential
- Rightward eye movement = upward deflection on the tracing
- Leftward eye movement = downward deflection
3. The ENG/VNG Test Battery
Group 1 - Visual-Oculomotor (Non-vestibular Eye Movements)
| Test | What it assesses |
|---|---|
| Saccade test | Saccadic control system; patient "jumps" gaze between targets 10-30° apart. Normal saccade peak velocity: up to 700°/s, average ~200°/s. Evaluates accuracy (normal vs. dysmetric), latency, velocity |
| Smooth pursuit test | Pursuit control system; patient tracks a slow sinusoidal target. Reports gain (eye velocity/target velocity), phase, symmetry |
| Optokinetic nystagmus (OKN) | Pursuit and optokinetic reflex; patient watches a large moving visual field |
| Fixation test | Stability of gaze fixation |
Group 2 - Static and Dynamic Positional Tests
| Test | What it assesses |
|---|---|
| Gaze test | Spontaneous nystagmus in primary gaze and at ~30° eccentricity (eyes open in light vs. darkness); gaze-evoked nystagmus |
| Positional test | Head tilted into various static positions - detects positional nystagmus; abnormal if slow-phase velocity >4°/s |
| Dix-Hallpike maneuver | Positioning nystagmus; characteristic burst in BPPV |
| Fistula test | Pressure-induced nystagmus (perilymph fistula or superior semicircular canal dehiscence) |
Group 3 - Vestibulo-Oculomotor Function
4. Bithermal Caloric Test (Jongkees Formula)
- Water: body temperature ±7°C → 30°C (cool) and 44°C (warm), irrigated for 30 seconds
- Air: body temperature ±13°C → 24°C (cool) and 58°C (warm), irrigated for 60 seconds
- Patient positioned supine with head elevated 30° (brings the lateral SCC into the vertical plane, maximizing convection)
Cold - Opposite, Warm - Same
- Cold irrigation → endolymph cools → fluid density rises → falls → ampullofugal flow in the lateral SCC → hair cell deflection away from kinocilium → inhibition → slow drift of eyes toward the irrigated side → fast (compensatory) saccades toward the opposite side
- Warm irrigation → endolymph rises → ampullopetal flow → excitation → fast phase toward the same side as irrigation
- Abnormal if UW >15-30% (lab-dependent threshold)
- Indicates hypofunctional labyrinth on the weaker side
- Abnormal if DP >30%
- Clinical value is debated; some believe DP points toward a central lesion and away from a peripheral lesion
- Water irrigation is contraindicated with TM perforation (use air instead; note the perforated side gives a heightened response to air)
- Remove excess cerumen before testing
- Perform otoscopy first
5. ENG/VNG Interpretation
Findings suggesting PERIPHERAL pathology:
- Unilateral caloric weakness
- Bilateral caloric weakness with a history of labyrinthine disease or ototoxicity
- Fatiguing positional nystagmus (e.g., BPPV pattern)
- Intact fixation suppression (patient can suppress nystagmus with visual fixation)
- Direction-fixed nystagmus
Findings suggesting CENTRAL pathology:
- Spontaneous or positional nystagmus with normal calorics
- Direction-changing nystagmus
- Failure of fixation suppression (cannot suppress nystagmus when fixating)
- Bilateral absent/reduced caloric responses without a history of labyrinthine disease or ototoxicity
- Abnormal saccades or saccadic pursuit with normal caloric results
- Hyperactive caloric responses (loss of cerebellar inhibition, in absence of TM defect or mastoid cavity)
6. Oculomotor Patterns on ENG/VNG Recordings
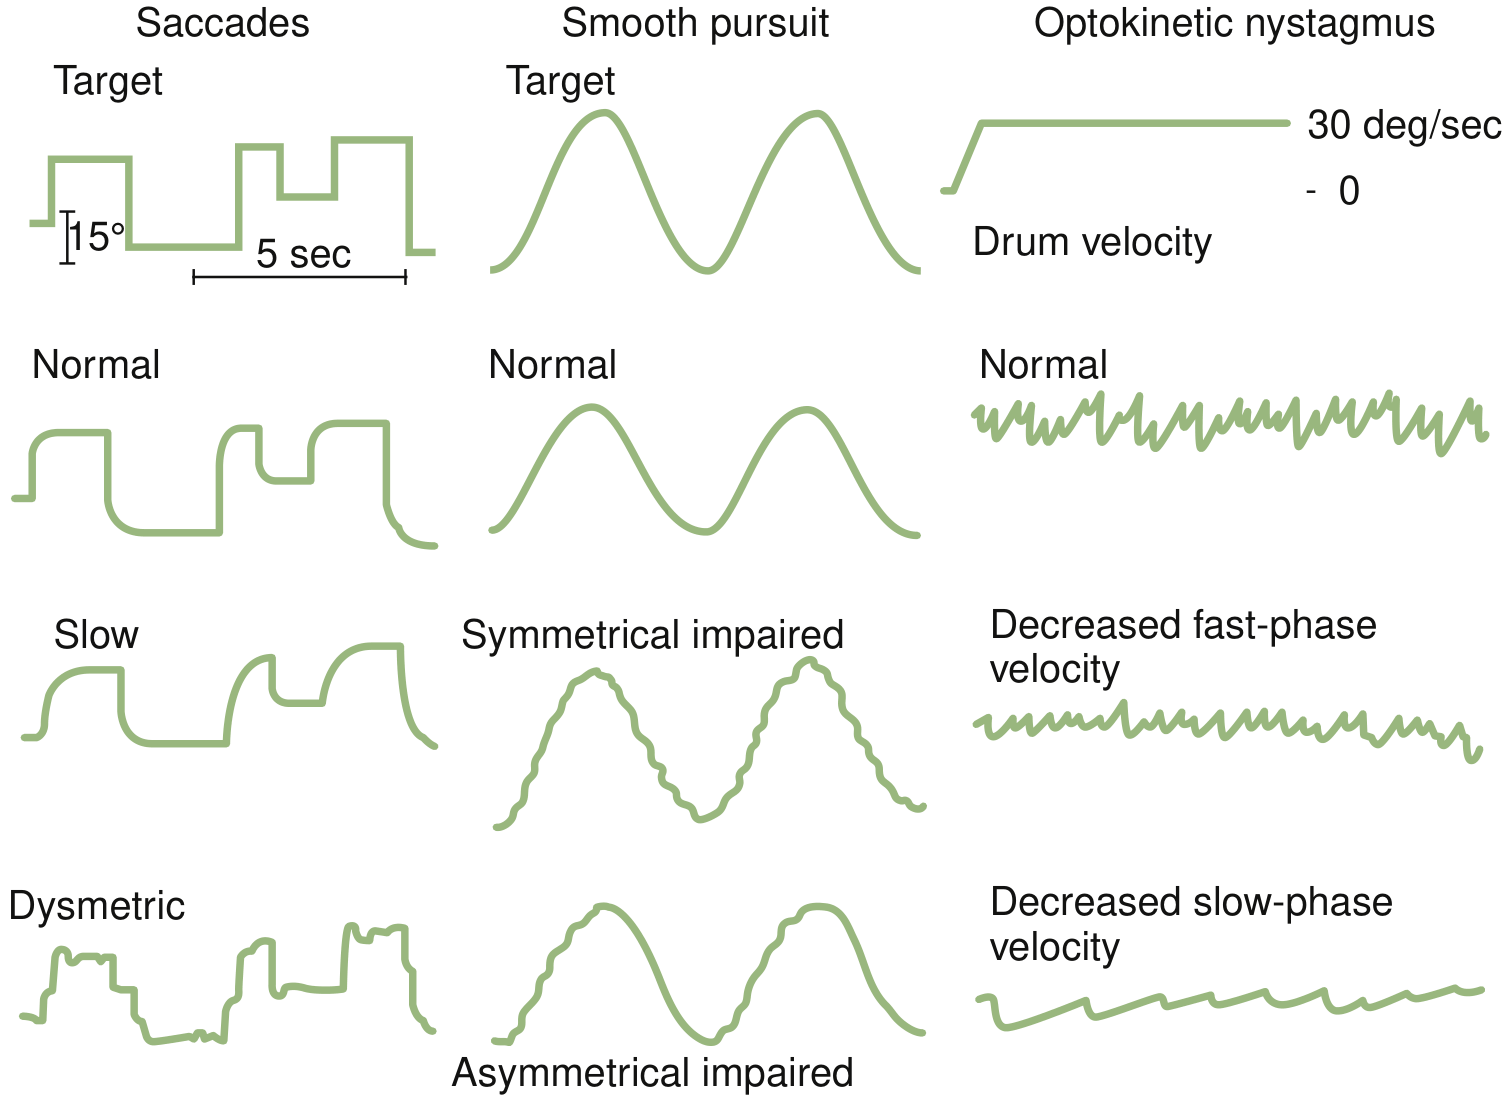
- Slow saccades - pontine or extraocular muscle disease
- Dysmetric saccades - cerebellar disorder
- Symmetrically or asymmetrically impaired smooth pursuit - central pathology
- Decreased OKN fast-phase velocity - pursuit system dysfunction
- Decreased OKN slow-phase velocity - optokinetic reflex impairment
7. Caloric Test Recordings
8. Clinical Uses of ENG/VNG
| Purpose |
|---|
| Aid in establishing diagnosis (central vs. peripheral) |
| Lateralization of dysfunction |
| Documentation of degree of dysfunction |
| Assist in devising treatment plan |
| Aid in long-term management and monitoring |
9. ENG vs. VNG - Comparison Summary
| Feature | ENG | VNG |
|---|---|---|
| Principle | Corneoretinal potential (indirect) | Infrared video camera (direct) |
| Electrodes | Skin surface electrodes | Video goggles |
| Cost | Lower | Higher |
| Artifact/noise | More (lid, muscle) | Less |
| Torsional nystagmus | Cannot detect | Can detect (developing) |
| Closed-eye recording | Yes | No |
| Video review of eye movements | No | Yes (key advantage) |
| Fixation removal | Requires eye closure | Goggles in darkness |
- K.J. Lee's Essential Otolaryngology, p. 351-352
- Shambaugh Surgery of the Ear, pp. 248-250+
- Bradley and Daroff's Neurology in Clinical Practice, p. 377
- Cummings Otolaryngology Head and Neck Surgery
- Scott-Brown's Otorhinolaryngology Head & Neck Surgery, Vol. 2