explain me 10 common heart diseases with ecg changes and ecg images of those diseases
Reading File
Finding Sources
Searching the Web
ECG changes 10 common heart diseases with ECG images labeled
Finding Sources
Finding Sources
Finding Sources
Finding Sources
Finding Sources
Finding Sources
Reading File
Reading File
Searching the Web
ECG images STEMI atrial fibrillation heart block WPW pericarditis labeled diagrams site:litfl.com OR site:ecgwaves.com
Reading File
Loading Image
Reading Web Page
https://litfl.com/atrial-fibrillation-ecg-library
Loading Image
Reading File
Searching the Web
STEMI ECG ST elevation inferior anterior pericarditis WPW ventricular tachycardia labeled ECG images site:litfl.com
Loading Image
Loading Image
Loading Image
Reading File
Loading Image
Searching the Web
atrial fibrillation ECG image irregular rhythm no P waves ventricular tachycardia pericarditis WPW delta wave ECG strip labeled
Finding Sources
Loading Image
Loading Image
I now have all the content and images I need to compose a thorough, well-illustrated answer. Let me write it.
Here is a detailed breakdown of 10 common heart diseases with their ECG changes and images from authoritative sources.
10 Common Heart Diseases: ECG Changes and Images
1. ST-Elevation Myocardial Infarction (STEMI)
What it is: Complete occlusion of a coronary artery causing transmural myocardial ischemia and cell death.
ECG Changes:
- Hyperacute (minutes): Tall, peaked "hyperacute" T waves in leads overlying the infarct
- Acute (hours): ST segment elevation (convex upward / "tombstone") ≥1 mm in limb leads, ≥2 mm in precordial leads
- Evolving (days): T-wave inversions, development of pathological Q waves (>40 ms wide, >25% depth of R wave)
- Chronic: Persistent Q waves; ST may normalize
- Localization by leads:
- Anterior: V1-V4 (LAD occlusion)
- Inferior: II, III, aVF (RCA or LCx)
- Lateral: I, aVL, V5-V6 (LCx)
- Posterior: Reciprocal ST depression in V1-V3 (tall R in V1)
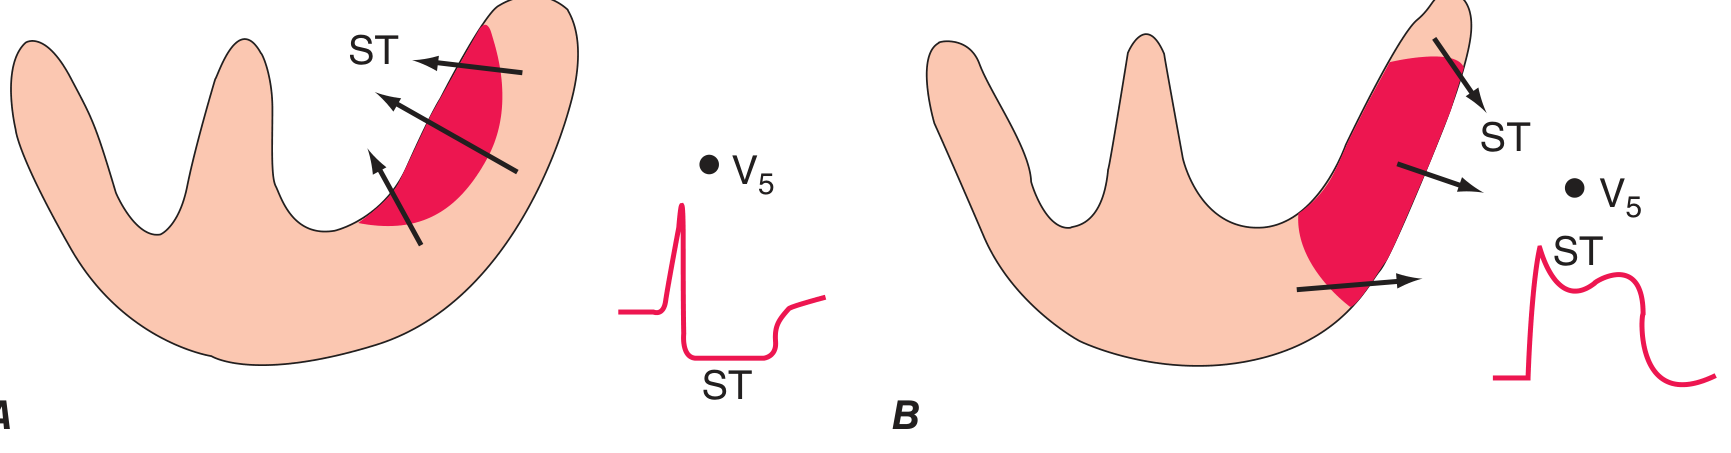
From Harrison's (2025): "When the acute ischemia is transmural, the ST vector usually is shifted in the direction of the outer (epicardial) layers, producing ST elevations and sometimes, in the earliest stages of ischemia, tall, positive so-called hyperacute T waves."
ECG - Ischemia current of injury:
Real 12-lead STEMI (Inferior STEMI with tombstone ST elevations):

2. Non-ST Elevation Myocardial Infarction (NSTEMI) / Unstable Angina
What it is: Partial coronary occlusion causing subendocardial injury without full-thickness necrosis.
ECG Changes:
- ST depression (horizontal or downsloping) in affected leads
- T-wave flattening or inversion
- No ST elevation, no Q wave development
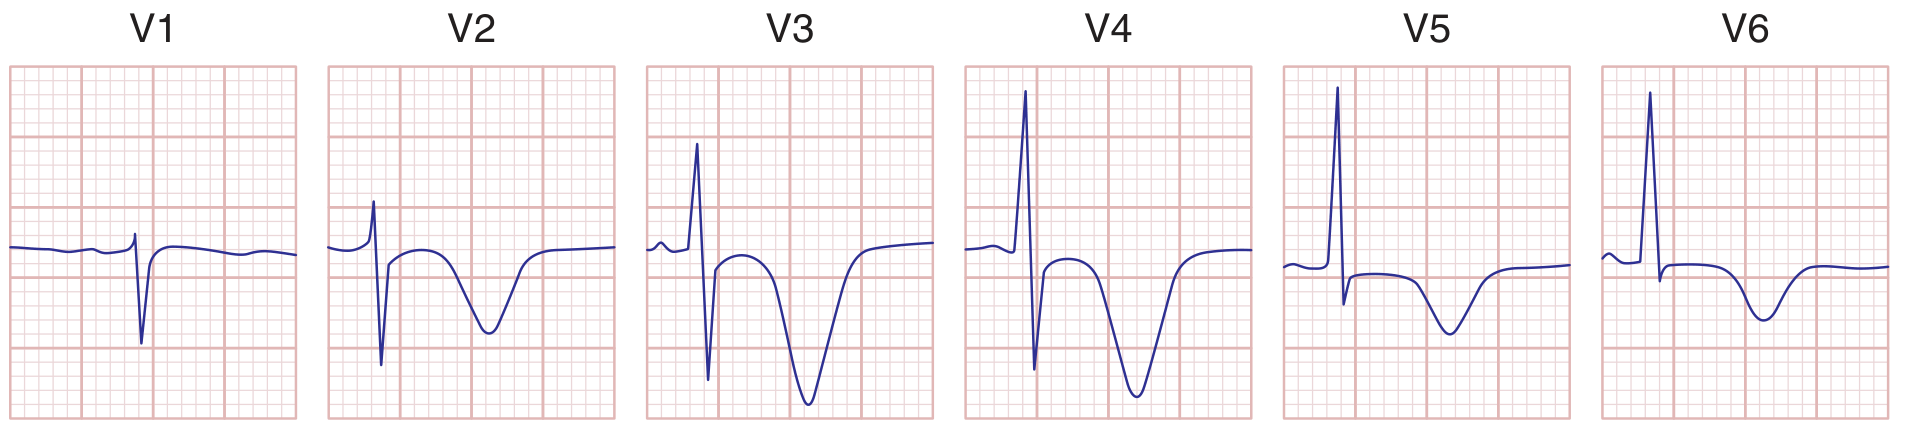
- Wellens Syndrome (severe LAD stenosis): Deep symmetric T-wave inversions in V2-V5 (a critical pattern predicting impending STEMI)
- May be entirely normal in 20-30% of cases at presentation
Wellens T-wave pattern (precordial leads V1-V6):
3. Atrial Fibrillation (AF)
What it is: Disorganized atrial electrical activity firing at 350-600 bpm, the most common sustained arrhythmia.
ECG Changes:
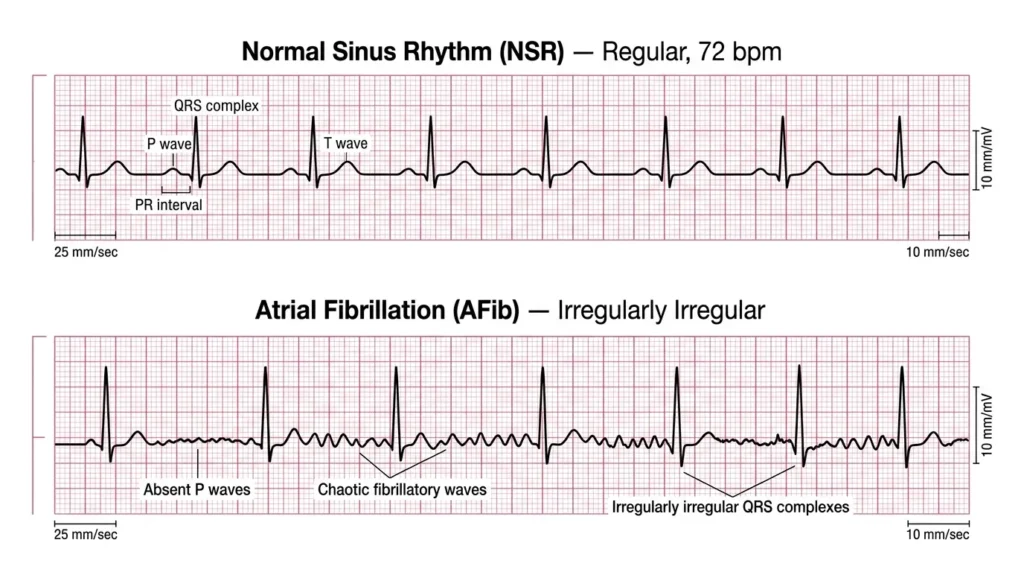
- Absent P waves - replaced by chaotic fibrillatory (f) waves at 350-600/min (best seen in V1, II)
- Irregularly irregular RR intervals (hallmark)
- Narrow QRS complexes (unless aberrant conduction or WPW)
- Ventricular rate typically 100-160/min if uncontrolled
- f waves may be "coarse" (easily visible) or "fine" (nearly isoelectric)
ECG comparison - Normal Sinus Rhythm vs Atrial Fibrillation:
4. Left Ventricular Hypertrophy (LVH)
What it is: Thickening of the left ventricular wall, most commonly from hypertension or aortic stenosis.
ECG Changes (Sokolow-Lyon and other criteria):
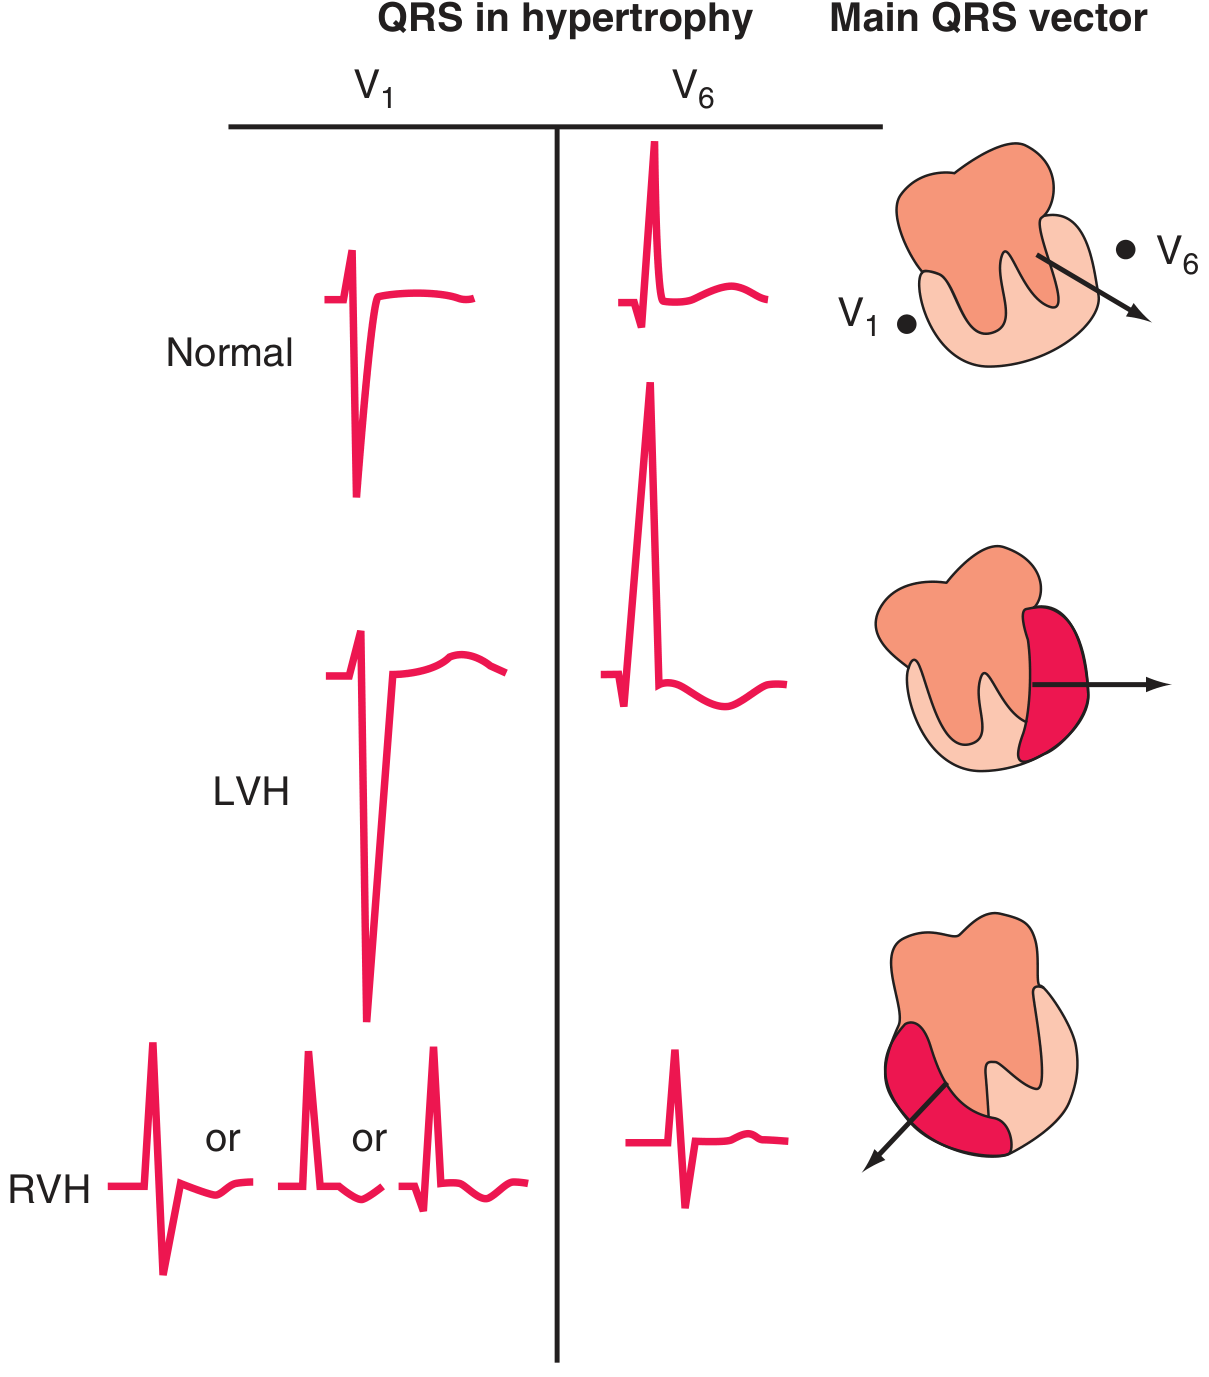
- High voltage: S in V1 + R in V5 or V6 >35 mm (Sokolow-Lyon)
- R in aVL >12 mm (women) or >28 mm (men)
- Left axis deviation
- "Strain pattern": ST depression + T-wave inversion in lateral leads (I, aVL, V5-V6) - discordant to the dominant QRS
- Left atrial enlargement (P mitrale: broad, notched P in II; deep negative terminal portion in V1)
- May progress to LBBB
ECG comparison - LVH and RVH patterns:
5. Right Ventricular Hypertrophy (RVH)
What it is: Thickening of the right ventricular wall from pulmonary hypertension, mitral stenosis, or congenital disease.
ECG Changes:
- Right axis deviation (>+90°)
- Dominant R wave in V1 (R:S ratio >1 in V1)
- Deep S waves in V5-V6 ("S1 S2 S3 pattern")
- ST depression and T-wave inversion in right precordial leads V1-V4 (RV "strain")
- Right atrial enlargement (P pulmonale: peaked P >2.5 mm in II)
- In pulmonary embolism: S1Q3T3 pattern (S in I, Q in III, T-wave inversion in III)
(Seen in image above, bottom row - RVH pattern)
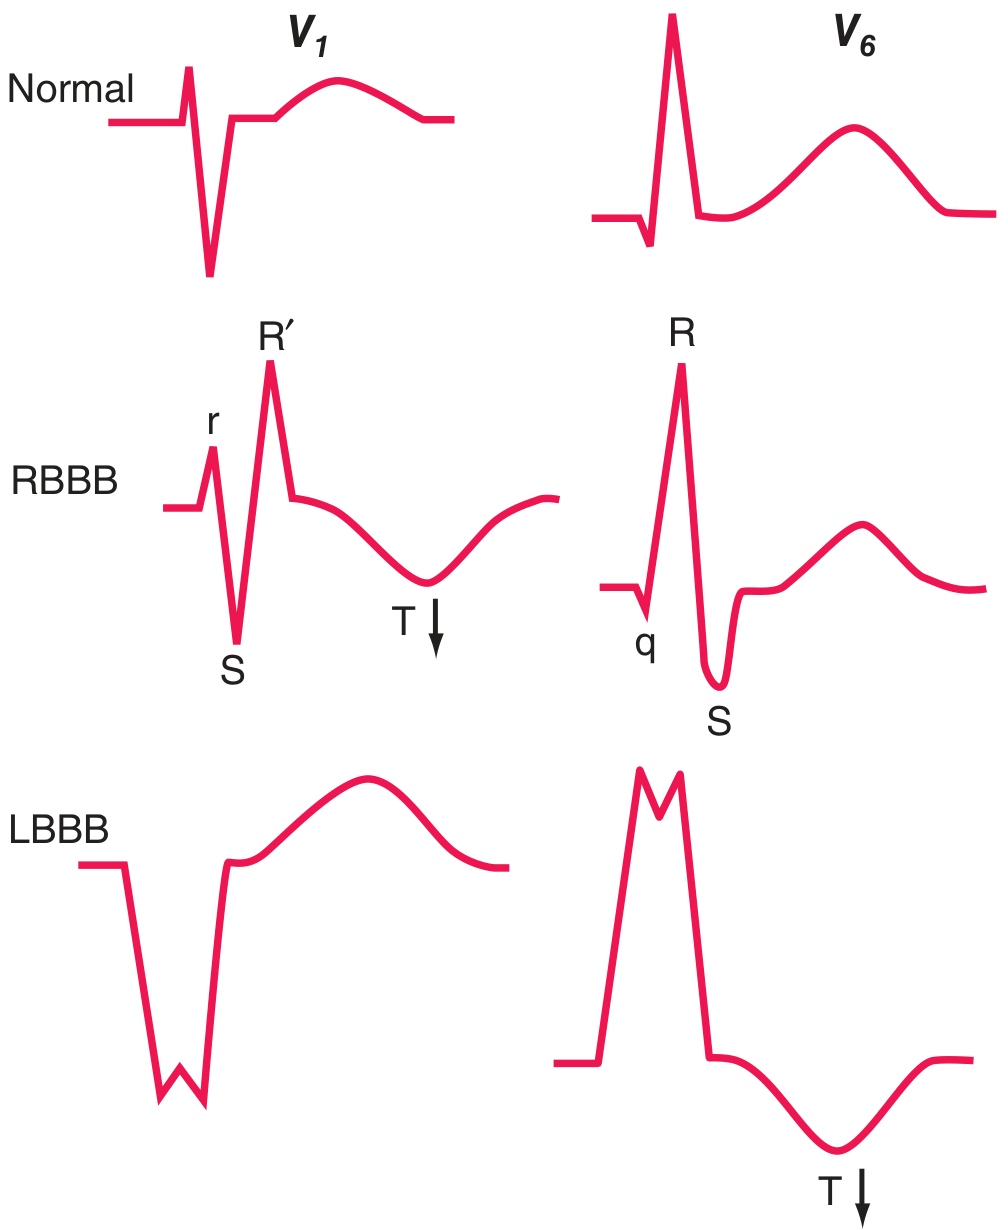
6. Left Bundle Branch Block (LBBB)
What it is: Failure of conduction in the left bundle, forcing right-to-left septal activation with delayed LV activation.
ECG Changes:
- Broad QRS ≥120 ms
- Broad, notched R wave in V5-V6 (M-shaped, "William" pattern)
- Deep QS complex in V1 (no initial r wave)
- Absence of septal Q waves in I, V5-V6
- Secondary ST-T changes: T wave discordant (opposite to QRS)
- Left axis deviation
- New LBBB in a chest pain patient is a STEMI equivalent (Sgarbossa criteria apply)
7. Right Bundle Branch Block (RBBB)
What it is: Failure of conduction in the right bundle, causing delayed RV activation.
ECG Changes:
- Broad QRS ≥120 ms
- rSR' (RSR') in V1 - the classic "rabbit ears" or "M-pattern" ("MoRRow")
- Wide S wave in V5-V6 and I ("WiLLiaM" for LBBB, "MaRRoW" for RBBB)
- Secondary T-wave inversion in V1-V3 (discordant)
- Right axis deviation (if associated)
- Brugada pattern: RBBB-like with coved ST elevation in V1-V2
RBBB and LBBB pattern diagrams:
8. Complete (Third-Degree) AV Block
What it is: Complete failure of AV conduction - no atrial impulses reach the ventricles. Atria and ventricles beat independently.
ECG Changes:
- P waves and QRS complexes completely dissociated (AV dissociation)
- P waves march through at the atrial rate (60-100/min)
- Slow escape rhythm: Junctional escape (40-60/min, narrow QRS) or ventricular escape (20-40/min, wide QRS)
- PR interval varies completely (no constant relationship)
- QRS morphology depends on escape pacemaker location:
- Junctional escape: narrow QRS
- Ventricular escape: wide, bizarre QRS (LBBB or RBBB pattern)
- Second-degree Mobitz I (Wenckebach): Progressive PR prolongation until a QRS is dropped
- Second-degree Mobitz II: Fixed PR with sudden non-conducted P waves (more serious)
- First-degree AV block: PR interval >200 ms (0.2 s), every P conducted
9. Wolff-Parkinson-White (WPW) Syndrome
What it is: An accessory conduction pathway (Bundle of Kent) bypasses the AV node, causing ventricular pre-excitation.
ECG Changes (in sinus rhythm):
- Short PR interval (<120 ms) - fast conduction via accessory pathway
- Delta wave - slurred upstroke of QRS (pre-excitation of ventricle)
- Wide QRS (>120 ms) - from the fused delta wave and normal conduction
- Discordant ST-T changes - secondary repolarization abnormality
- May mimic LBBB or RBBB depending on pathway location
- May mimic inferior MI (pseudo-Q waves in II, III, aVF with left lateral pathway)
- During AF: Broad irregular QRS complexes at very rapid rates (danger of VF)
The classic WPW triad: short PR + delta wave + wide QRS
(From Harrison's 2025: "Prolongation of QRS duration does not necessarily indicate a conduction delay but may be due to preexcitation of the ventricles via a bypass tract, as in Wolff-Parkinson-White (WPW) patterns.")
10. Ventricular Tachycardia (VT)
What it is: Rapid ventricular rhythm (≥3 beats, rate ≥100/min) originating below the bundle of His, most commonly from ischemic scar tissue.
ECG Changes:
- Wide QRS ≥120 ms (usually >140 ms)
- Rapid, regular rate - typically 150-250/min
- AV dissociation - P waves march independently (key diagnostic feature)
- Fusion beats and capture beats (pathognomonic when present)
- QRS axis often extreme (northwest axis, -90° to ±180°)
- Concordance: all precordial leads positive (positive concordance) or all negative (negative concordance)
- Torsades de Pointes: Polymorphic VT with twisting QRS axis around baseline, associated with prolonged QT
Key rules to distinguish VT from SVT with aberrancy:
- Brugada criteria: any lead with RS complex where RS interval >100 ms = VT
- RSR' in V1 (with the left "rabbit ear" taller) = VT
- No RS in any precordial lead = VT
- AV dissociation = VT
12-lead ECG showing wide-complex tachycardia (Inferior STEMI/VT reference):
Summary Table
| # | Disease | Key ECG Feature(s) | Rate/Rhythm |
|---|---|---|---|
| 1 | STEMI | ST elevation, hyperacute T, Q waves | Usually regular |
| 2 | NSTEMI | ST depression, T-wave inversion, Wellens pattern | Regular |
| 3 | Atrial Fibrillation | Absent P waves, irregularly irregular, fibrillatory waves | Irregular |
| 4 | LVH | High voltage (SV1+RV5 >35mm), lateral strain | Regular |
| 5 | RVH | Dominant R in V1, right axis, RV strain | Regular |
| 6 | LBBB | Wide QRS, QS in V1, broad R in V6, no septal Q | Regular |
| 7 | RBBB | Wide QRS, rSR' in V1, wide S in V6 | Regular |
| 8 | Complete AV Block | P waves dissociated from QRS, slow escape rhythm | Regular escape, regular atria |
| 9 | WPW | Short PR, delta wave, wide QRS | Regular (sinus) |
| 10 | Ventricular Tachycardia | Wide QRS, AV dissociation, fusion beats | Regular, fast |
Sources:
- Harrison's Principles of Internal Medicine, 22nd ed. (2025) - Chapter 247
- Ganong's Review of Medical Physiology, 26th ed. - Chapter 29
- Braunwald's Heart Disease, 12th ed.
- LITFL ECG Library (litfl.com)
This is a shared conversation. Sign in to Orris to start your own chat.