
listen ,make a image of abnormal arterial contours - which should inclde - arteriosclerosis , aortic stenosis , aortic regurtitaion & patent ductus arteriosum - which should include changes in systolic and diastolic pressure , graphs of changes of each , why does it happens , dont sugarcoat anything , use diff fonts with diff colours but imp give in highlighted form
Medical educational poster titled "ABNORMAL ARTERIAL CONTOURS" with dark background. Divided into 4 clearly labeled sections with bold colored headers and highlighted boxes. SECTION 1 - "ARTERIOSCLEROSIS" (red header, yellow highlight box): - Waveform graph: High systolic peak, elevated diastolic baseline, steep upstroke, no dicrotic notch, wide pulse pressure. Label systolic UP arrow, diastolic UP arrow. - Text: "Stiff, calcified walls → no elastic recoil → systolic HTN, elevated diastolic, wide pulse pressure" - Graph shows tall, sharp, non-compliant waveform SECTION 2 - "AORTIC STENOSIS" (orange header, cyan highlight box): - Waveform graph: Low flat systolic peak (pulsus parvus), slow upstroke (pulsus tardus), prolonged ejection, reduced pulse pressure. Systolic DOWN arrow, diastolic normal arrow. - Text: "Obstructed outflow → reduced stroke volume → LOW systolic, SLOW rise, narrow pulse pressure, pulsus parvus et tardus" - Graph shows small, delayed, plateau-shaped waveform SECTION 3 - "AORTIC REGURGITATION" (green header, pink highlight box): - Waveform graph: Very HIGH systolic spike, very LOW diastolic (near zero), collapsing rapid downstroke, wide bounding pulse. Systolic UP arrow, diastolic DOWN arrow. - Text: "Blood leaks back into LV during diastole → WIDE pulse pressure, bounding/waterhammer pulse, Corrigan's pulse" - Graph shows tall spike with rapid collapse, diastolic near baseline SECTION 4 - "PATENT DUCTUS ARTERIOSUS (PDA)" (purple header, gold highlight box): - Waveform graph: Elevated systolic, very low diastolic (blood shunted away), wide pulse pressure, bounding quality. Systolic slightly UP, diastolic markedly DOWN. - Text: "Continuous shunt aorta→pulmonary artery → blood stolen in diastole → LOW diastolic, wide pulse pressure, bounding pulse, machinery murmur" - Graph shows elevated systolic with diastolic dip/runoff Bottom section: Comparison table with columns: Condition | Systolic | Diastolic | Pulse Pressure | Waveform Character Row 1 Arteriosclerosis: ↑ | ↑ | Wide | Stiff, no notch Row 2 Aortic Stenosis: ↓ | Normal | Narrow | Slow, plateau Row 3 Aortic Regurgitation: ↑↑ | ↓↓ | Very Wide | Collapsing/bounding Row 4 PDA: ↑ | ↓↓ | Wide | Bounding, runoff Each section uses a different font style. Section labels are bold and large. All key values highlighted with colored rectangles. Arrows indicating pressure changes are large and bright. Grid lines on each waveform graph. White text on dark panels. Professional medical illustration style.
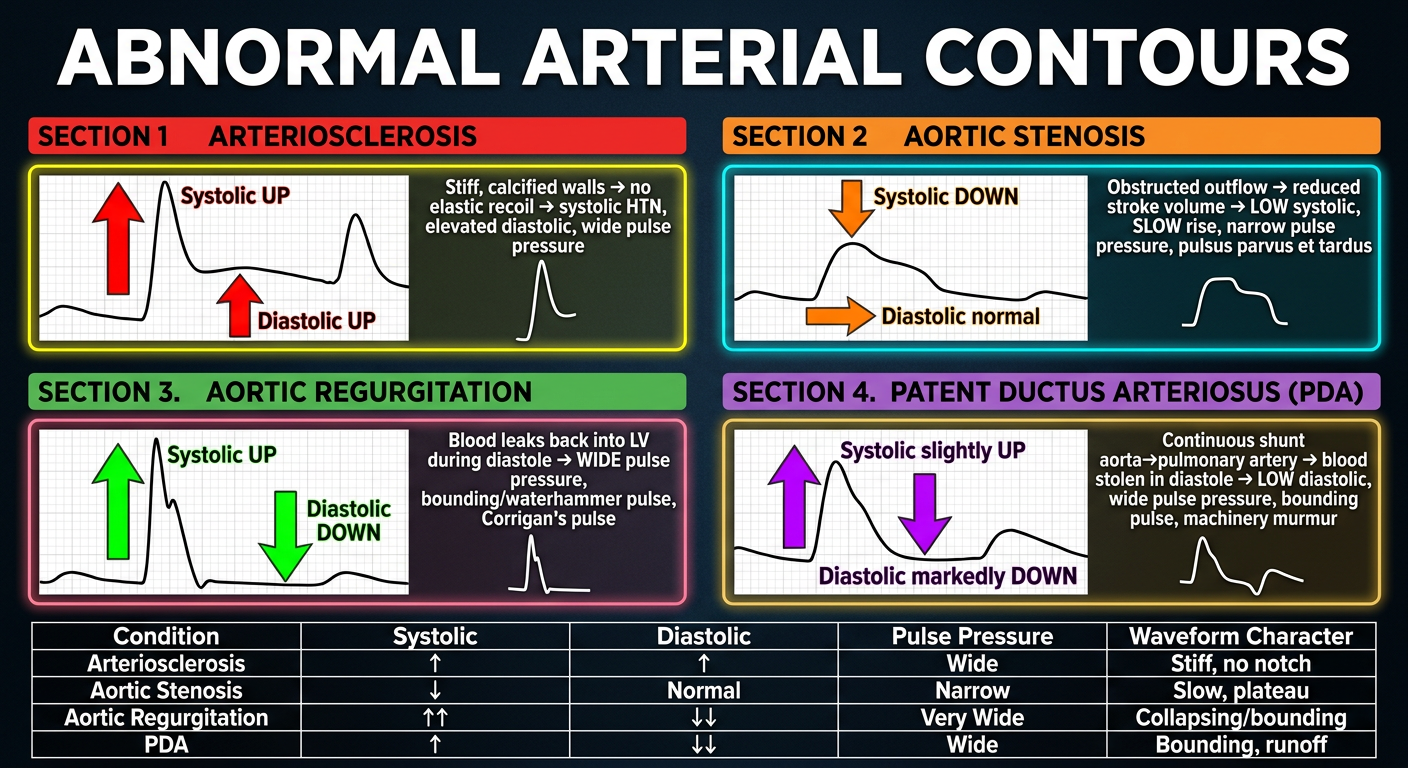
- Walls are stiff and calcified - they can't stretch and recoil normally
- Systolic pressure shoots up (no dampening), diastolic also rises because vessels can't relax properly
- Waveform: tall, sharp spike, no dicrotic notch, wide pulse pressure
- Valve is narrowed - LV has to fight to push blood through
- Stroke volume drops → systolic falls, upstroke is slow and delayed
- Waveform: small (parvus) + delayed (tardus) peak - classic "pulsus parvus et tardus," narrow pulse pressure
- Leaky valve lets blood flood back into LV during diastole
- Systolic spikes (LV dumps a huge stroke volume) but diastolic collapses (blood runs backward)
- Result: widest pulse pressure, bounding "waterhammer" pulse (Corrigan's), diastolic near zero
- Open duct steals aortic blood continuously into pulmonary artery, especially in diastole
- Systolic is maintained but diastolic falls markedly ("diastolic runoff")
- Result: bounding pulse, wide pulse pressure, the classic machinery murmur, peripheral pulses feel sharp and collapsing