Help me learn ecg from scratch
Reading File
Finding Sources
Searching the Web
ECG interpretation basics for beginners systematic approach
Finding Sources
Finding Sources
Finding Sources
Reading File
Reading File
Finding Sources
Reading File
Finding Sources
Reading File
Reading File
Loading Image
Loading Image
Loading Image
Now I have excellent material. Let me compile a thorough, structured ECG guide from scratch.
ECG From Scratch: A Complete Beginner's Guide
1. What Is an ECG?
An electrocardiogram (ECG or EKG) is a recording of the electrical activity generated by the heart at the body surface. It measures differences in electrical potential between electrode pairs placed on the skin. Every time the heart beats, a wave of electrical depolarization spreads through it - the ECG captures this wave's direction, speed, and magnitude over time.
The ECG tells you:
- Rate - how fast the heart is beating
- Rhythm - whether the beat is regular and originates from the right place
- Conduction - how long it takes the signal to travel through different parts
- Axis - the overall direction of electrical activity
- Structural clues - hypertrophy, ischemia, infarction
2. The Cardiac Electrical Sequence
Before reading any trace, understand what generates it:
| Event | ECG Wave |
|---|---|
| SA node fires → atria depolarize | P wave |
| Impulse slows at AV node | PR interval |
| Bundle branches → Purkinje → ventricles depolarize | QRS complex |
| Ventricles repolarize | T wave |
| (Atrial repolarization is hidden inside QRS) | - |
The conduction path: SA node → internodal tracts → AV node → Bundle of His → Left & Right bundle branches → Purkinje fibers → ventricular myocardium.
The AV node is the critical "gatekeeper" - it deliberately slows conduction to allow atrial contraction to complete before the ventricles fire. This delay shows up as the PR interval.
Here is the full cardiac cycle showing how each ECG wave maps to mechanical events:
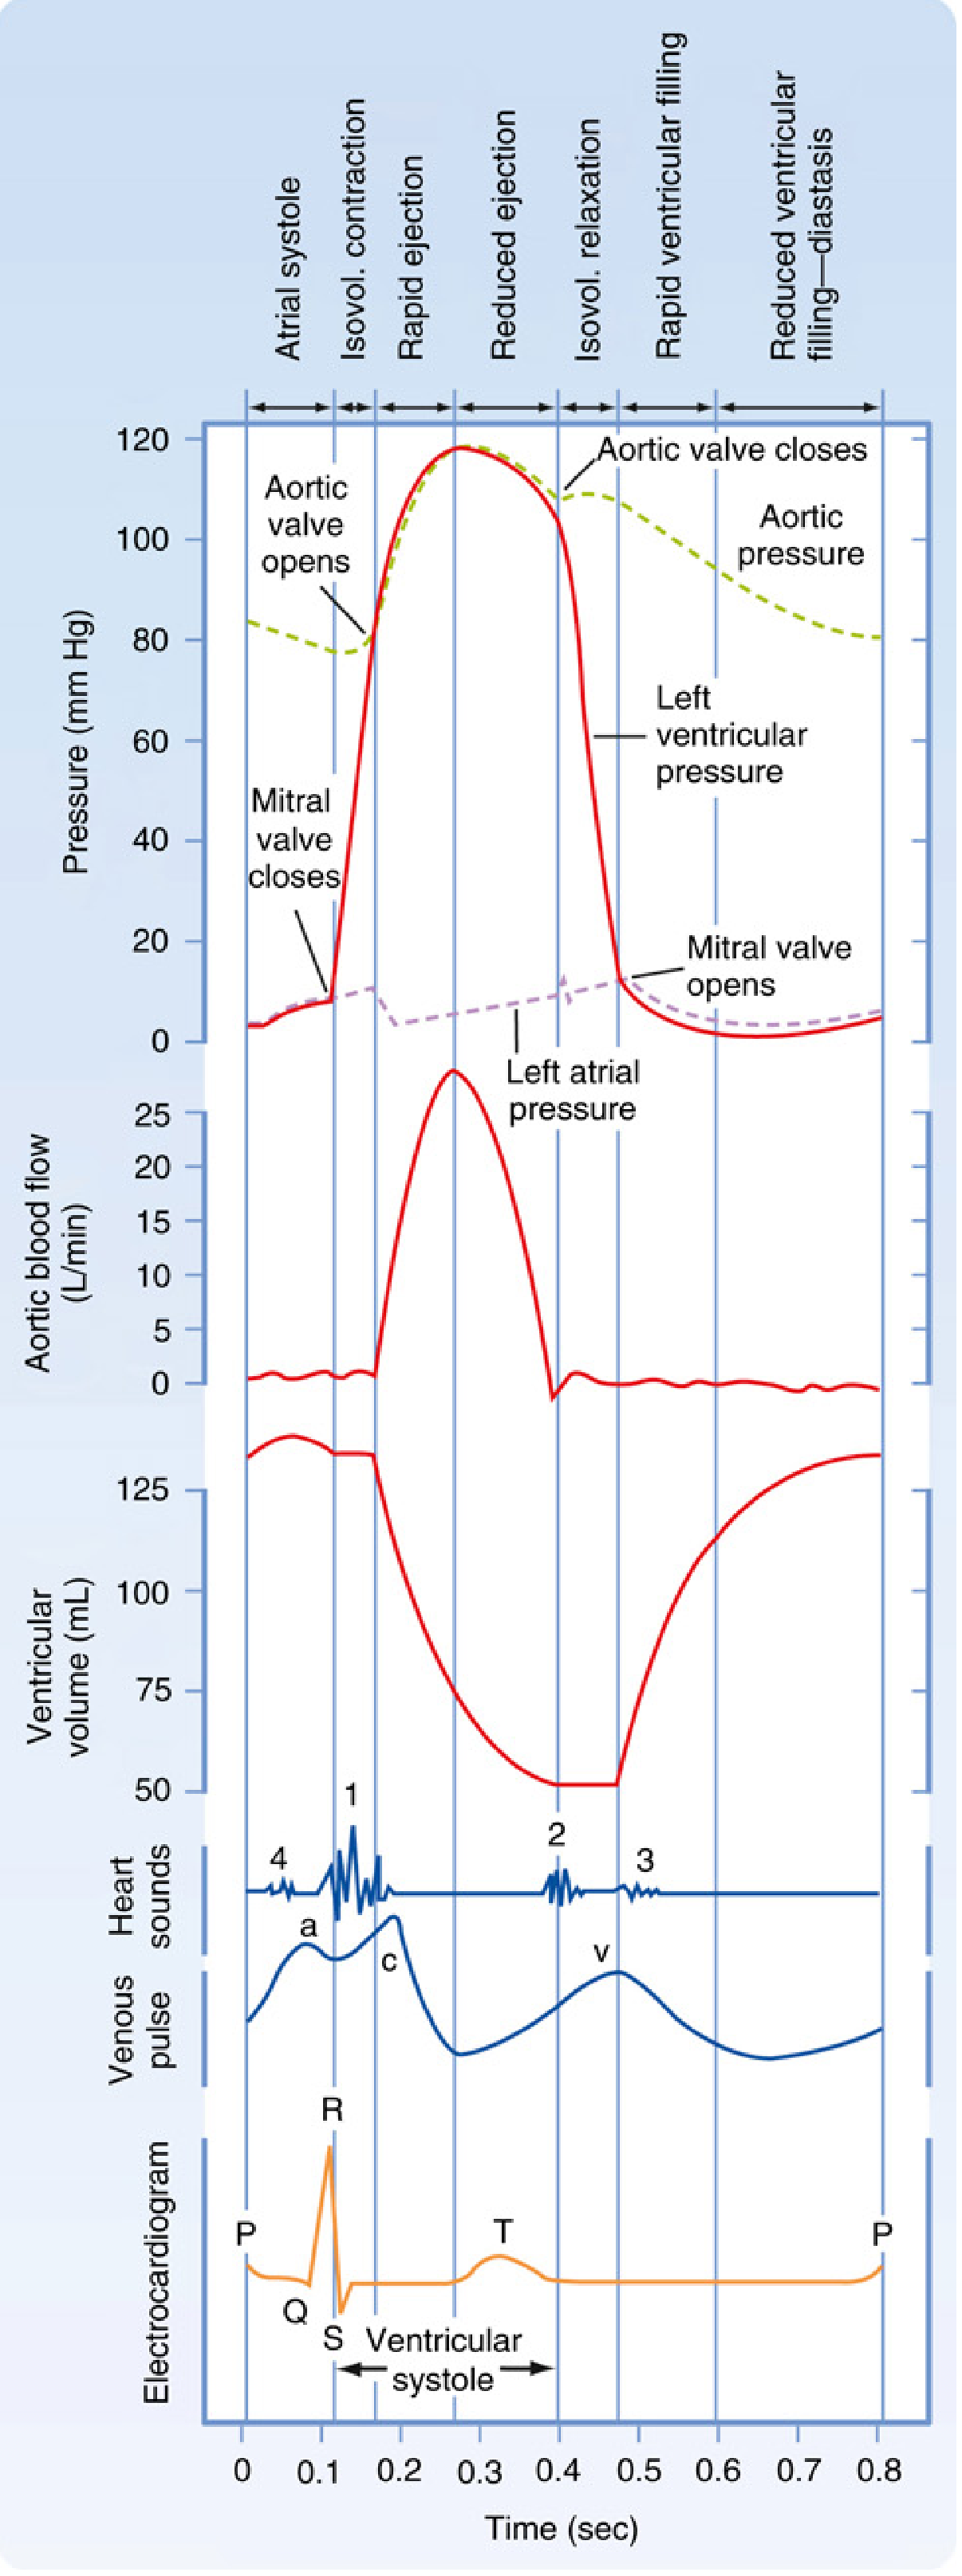
Miller's Anesthesia, 10e - Fig 13.1: Electrical and mechanical events during a single cardiac cycle
3. ECG Paper: The Grid
ECG paper has two sets of grid lines:
- Small boxes: 1 mm wide = 0.04 seconds horizontally, 0.1 mV vertically
- Large boxes: 5 mm wide = 0.2 seconds horizontally (5 small boxes)
- 5 large boxes = 1.0 second
Standard recording speed is 25 mm/sec. Standard calibration is 10 mm = 1 mV.
1 small box = 0.04 sec     (horizontally)
1 large box = 0.20 sec     (= 5 small boxes)
5 large boxes = 1.0 sec
4. The 12 Leads: What They Look At
A standard ECG uses 12 leads - each is a different "camera angle" on the same electrical events.
Limb Leads (Frontal Plane)
These look at the heart from the front, using electrodes on the four limbs:
| Lead | Views |
|---|---|
| I | Lateral (left side) |
| II | Inferior + best for rhythm |
| III | Inferior |
| aVR | Right - normally everything is negative here |
| aVL | High lateral |
| aVF | Inferior (foot) |
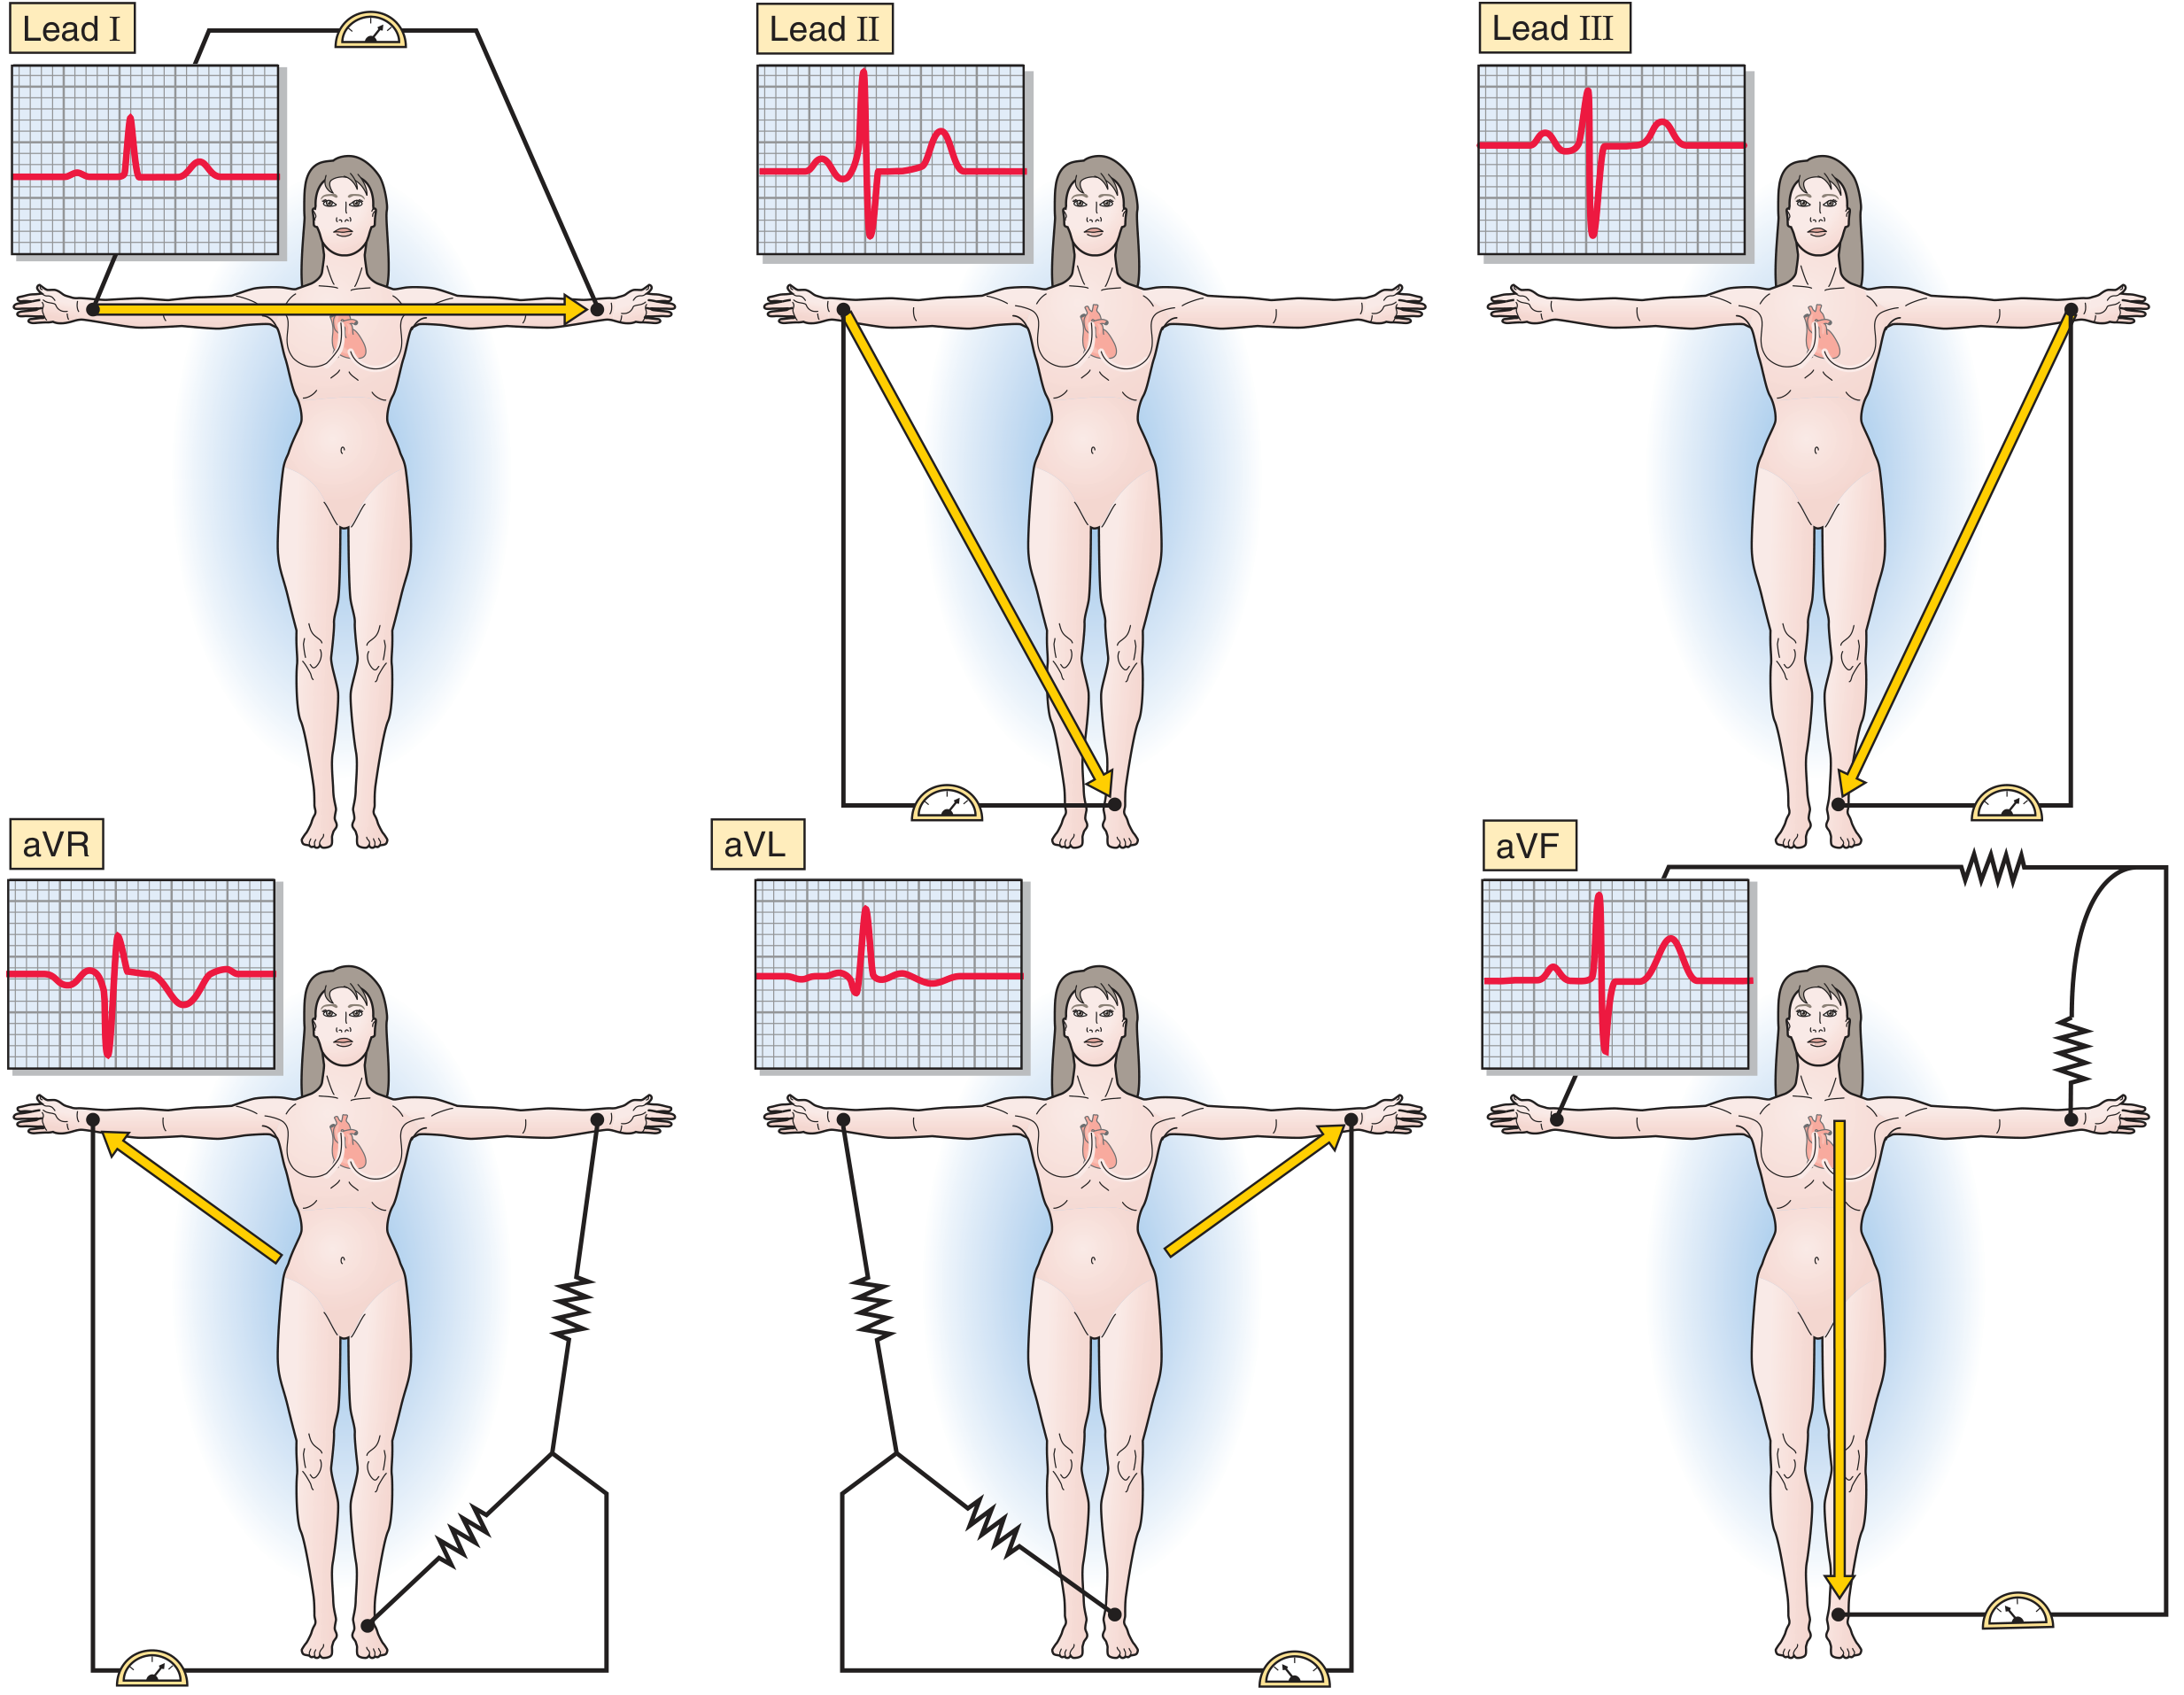
Medical Physiology - The ECG limb leads and their axes
Precordial (Chest) Leads (Transverse Plane)
Six electrodes placed across the chest look at the heart horizontally:
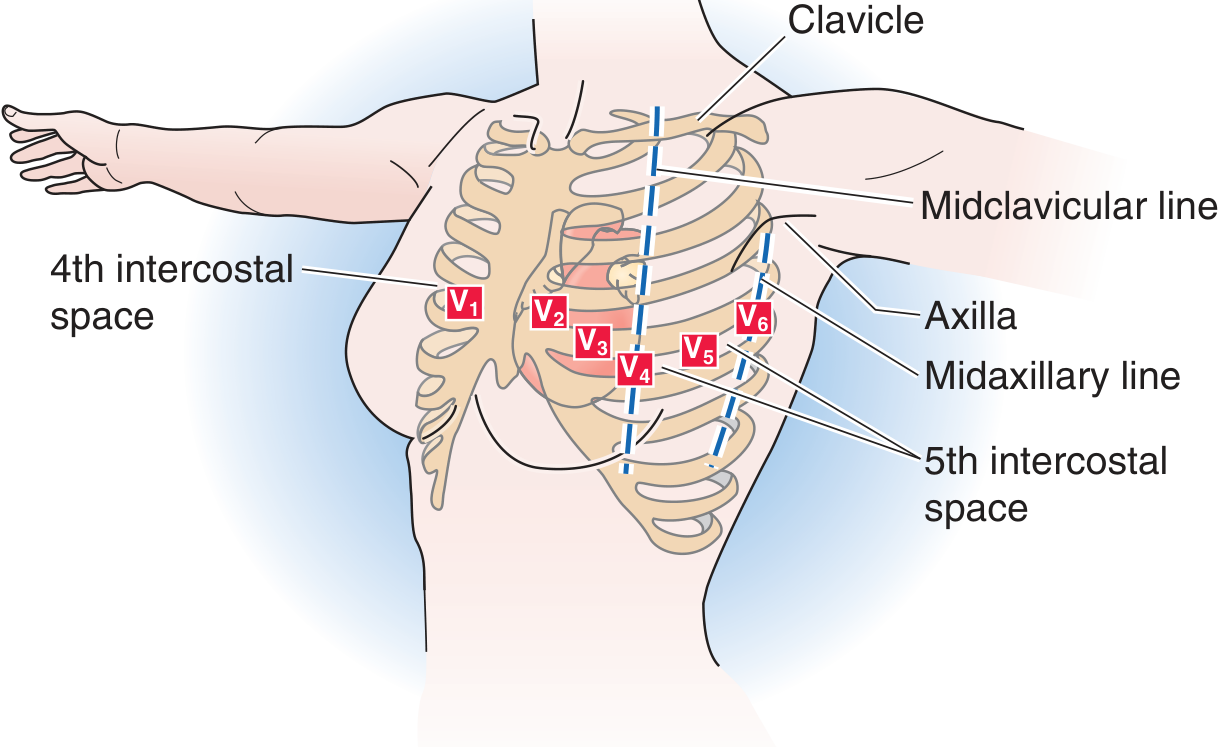
| Lead | Position | Views |
|---|---|---|
| V1 | 4th intercostal space, right of sternum | Right ventricle |
| V2 | 4th intercostal space, left of sternum | Right ventricle |
| V3 | Between V2 and V4 | Anterior (septal transition) |
| V4 | 5th intercostal space, midclavicular line | Anterior |
| V5 | Same level, anterior axillary line | Lateral |
| V6 | Same level, midaxillary line | Lateral |
Key concept: Depolarization moving toward a positive electrode = positive (upward) deflection. Moving away = negative (downward) deflection.
5. The Waves, Intervals, and Segments
P Wave
- Represents atrial depolarization
- Normal: upright in leads I, II, aVF; inverted in aVR
- Duration: < 0.12 sec (3 small boxes)
- Amplitude: < 2.5 mm
PR Interval
- From start of P to start of QRS
- Represents AV nodal conduction time
- Normal: 0.12 - 0.20 sec (3-5 small boxes)
- Short PR: pre-excitation (WPW) or AV junctional rhythm
- Long PR: first-degree heart block
QRS Complex
- Represents ventricular depolarization
- Q wave: first negative deflection (initial septal activation)
- R wave: first positive deflection
- S wave: negative deflection after R
- Normal duration: < 0.12 sec (3 small boxes)
- Wide QRS (> 0.12 sec): bundle branch block or ventricular origin
ST Segment
- From end of QRS to start of T wave
- Represents the plateau phase of the ventricular action potential
- Normally isoelectric (flat at baseline)
- ST elevation: injury pattern (STEMI, pericarditis, Brugada)
- ST depression: ischemia, reciprocal changes, digoxin effect
T Wave
- Represents ventricular repolarization
- Normally upright in leads I, II, V3-V6; inverted in aVR
- Normally asymmetric (gradual upstroke, steeper downstroke)
- Peaked T waves: hyperkalemia, hyperacute MI
- Inverted T waves: ischemia, strain, bundle branch block
QT Interval
- From start of QRS to end of T wave
- Represents total duration of ventricular depolarization + repolarization
- Rate-dependent - must correct using Bazett formula:
QTc = QT (seconds) ÷ √R-R interval (seconds)
- Normal QTc: ≤ 0.44 sec in males; ≤ 0.46 sec in females
- Prolonged QT: risk of torsades de pointes
6. How to Calculate Heart Rate
Method 1 - The 300 Rule (for regular rhythms):
Count the number of large boxes between two consecutive R waves. Divide 300 by that number.
1 large box  = 300 bpm
2 large boxes = 150 bpm
3 large boxes = 100 bpm
4 large boxes = 75 bpm
5 large boxes = 60 bpm
6 large boxes = 50 bpm
Memorize: 300 - 150 - 100 - 75 - 60 - 50
Method 2 - For irregular rhythms:
Count the number of QRS complexes in a 10-second strip (the full rhythm strip), then multiply by 6.
7. A Systematic Approach to Reading Every ECG
Never "eyeball" an ECG randomly. Always use the same steps in order:
Step 1: Rate
- Calculate using the 300-rule or 6-second count
- Normal: 60-100 bpm
- Bradycardia: < 60 bpm | Tachycardia: > 100 bpm
Step 2: Rhythm
Ask these questions:
- Is it regular (constant R-R intervals) or irregular?
- Is there a P wave before every QRS?
- Is the P wave normal (upright in II, inverted in aVR)?
- Is the PR interval constant?
If all yes → Normal Sinus Rhythm
Step 3: Axis
The normal QRS axis in the frontal plane is -30° to +90°.
Quick method using leads I and aVF:
| Lead I | aVF | Axis |
|---|---|---|
| Positive | Positive | Normal (-30° to +90°) |
| Positive | Negative | Left axis deviation (LAD) |
| Negative | Positive | Right axis deviation (RAD) |
| Negative | Negative | Extreme axis ("Northwest territory") |
Causes of LAD: left anterior fascicular block, LVH, inferior MI
Causes of RAD: RVH, left posterior fascicular block, PE, dextrocardia
Step 4: Intervals
- PR: 0.12-0.20 sec (3-5 small boxes)
- QRS: < 0.12 sec (< 3 small boxes)
- QTc: ≤ 0.44 sec (males), ≤ 0.46 sec (females)
Step 5: P Wave Morphology
- Shape, height, duration
- Notched/widened P in II: left atrial enlargement (P mitrale)
- Peaked/tall P in II: right atrial enlargement (P pulmonale, > 2.5 mm)
Step 6: QRS Morphology
- R-wave progression in chest leads (should increase V1 → V5)
- Look for Q waves (pathological = > 0.04 sec wide, > 25% of QRS height)
- Bundle branch blocks?
Step 7: ST Segment and T Waves
- Any elevation or depression?
- Which leads? (tells you which territory is affected)
- T wave inversions?
Step 8: Put It All Together
State your interpretation: Rate, rhythm, axis, any abnormalities, and your clinical conclusion.
8. Normal Values Summary
| Parameter | Normal Range |
|---|---|
| Heart rate | 60-100 bpm |
| PR interval | 0.12-0.20 sec |
| QRS duration | < 0.12 sec |
| QTc (male) | ≤ 0.44 sec |
| QTc (female) | ≤ 0.46 sec |
| P wave duration | < 0.12 sec |
| P wave amplitude | < 2.5 mm |
| QRS axis | -30° to +90° |
9. Common Patterns to Recognize Next
Once you have the basics, these are the most clinically important patterns to learn:
- Normal sinus rhythm - your baseline reference
- Sinus tachycardia / bradycardia - normal P waves, just fast/slow
- Atrial fibrillation - no P waves, irregularly irregular
- Atrial flutter - sawtooth baseline at ~300 bpm, regular ventricular rate
- 1st/2nd/3rd degree heart block - PR interval progressively prolonging or dropping beats
- Bundle branch blocks (LBBB, RBBB) - wide QRS with specific morphology
- ST-elevation MI (STEMI) - ST elevation in a coronary territory
- LVH/RVH - voltage criteria for chamber hypertrophy
- Hyperkalemia / Hypokalemia - peaked T waves vs. U waves + flattened T waves
- Long QT - risk for torsades
10. Learning Tips
- Practice on real tracings - free resources like Litfl ECG Library and ECG Wave-Maven have thousands of cases
- Use the systematic method every time - do not skip steps even for "easy" ECGs
- Learn one pattern at a time - master normal sinus rhythm before moving to arrhythmias
- Draw it out - sketching the conduction system and wave sequence reinforces memory
- Correlate with physiology - knowing why a PR is long in AV block makes patterns stick
Sources: Medical Physiology (Boron & Boulpaep), Box 21-2 & Fig 21-8; Miller's Anesthesia, 10e, Fig 13.1; The Harriet Lane Handbook, 23e, Table 7.2
This is a shared conversation. Sign in to Orris to start your own chat.