Explain bias in easy way for psm exam
Reading File
Finding Sources
Finding Sources
Finding Sources
Finding Sources
Reading File
Finding Sources
Reading File
Finding Sources
Reading File
Finding Sources
Reading File
Loading Image
Here is the complete, exam-ready explanation of Bias for PSM, based directly on Park's Textbook of Preventive & Social Medicine:
BIAS - Complete Notes for PSM Exam
Definition
Bias is any systematic error in the determination of the association between exposure and disease. It reflects some type of non-comparability between the study and control groups, and the relative risk estimate may increase or decrease as a result.
Key word: SYSTEMATIC - meaning it goes in one direction consistently (unlike random error).
MASTER CLASSIFICATION (Remember: S-I-C)
| Category | What goes wrong |
|---|---|
| Selection Bias | Wrong people selected |
| Information Bias | Wrong data collected |
| Confounding | Third variable distorts |
1. SELECTION BIAS
Simple idea: The people who enter the study are not representative of the true population.
Park's classic example: A UK study showed perinatal mortality of 5.4/1000 in home births vs 27.8/1000 in hospital births. One might wrongly conclude "hospitals are unsafe" - but the bias arises because high-risk mothers go to hospitals, not low-risk ones. "Like is not being compared with like."
Sub-types:
a) Berkesonian Bias (Berkson's Bias)
- Named after Dr. Joseph Berkson
- Occurs in hospital-based case-control studies
- Hospital patients are not representative of the general population because different diseases have different hospitalization rates
- Example: If you study the link between lung disease and smoking using hospital patients, controls already have higher smoking rates (since hospitalized people are sicker overall), so you underestimate the real association
- Remember: Hospital cases + Hospital controls = Berkson's bias
b) Volunteer/Healthy Worker Bias
- People who volunteer for studies tend to be healthier/more health-conscious
- People who join occupational studies are healthier than general population
c) Participation Bias (Non-response bias)
- Those who refuse to participate differ systematically from those who do
2. INFORMATION BIAS (Observation Bias)
Simple idea: The data collected is systematically wrong or different between groups.
Sub-types:
a) Recall Bias (most common in Case-Control studies)
- Cases (sick people) recall past exposures more carefully than controls (healthy people)
- Example: Mothers who had a child with a birth defect will remember every drug/exposure during pregnancy; healthy mothers won't recall as carefully
- Direction: Cases over-report exposure → artificially inflated Odds Ratio
b) Interviewer Bias (Interviewer's Bias)
- Occurs when the interviewer knows the hypothesis and knows who is a case
- The interviewer may probe cases more thoroughly about the suspected causal factor than controls
- Check: Compare average time taken to interview a case vs. a control
- Prevention: Double-blinding
c) Observer Bias
- The investigator measuring the outcome knows which group the patient is in
- May unconsciously rate outcomes favourably for the treatment group
- Prevention: Blinding (single, double, or triple blind trials)
d) Subject Variation (Placebo Effect)
- Participants may subjectively report improvement just because they know they received a new treatment
- Prevention: Placebo-controlled, blinded trials
3. CONFOUNDING BIAS
Simple idea: A third variable (confounder) is mixed up with both the exposure and the disease, creating a false association.
Definition of a Confounding Factor: One that is:
- Associated with the exposure under investigation
- Also independently associated with the disease
- Distributed unequally in study and control groups
Classic example from Park's:
- Yudkin found patients with MI ate more sugar → concluded sugar causes heart disease
- But Bennett found heavy cigarette smokers also drink more sugary drinks
- Cigarette smoking was the confounder - it is related both to sugar intake and to CHD
- Once smoking was controlled for, the sugar-CHD association disappeared
Another example: Altitude appears associated with endemic goitre. The confounder is iodine deficiency, which is common to both high altitudes and goitre.
Controlling Confounding:
| Method | Stage | Used In |
|---|---|---|
| Randomization | Design | RCTs |
| Matching | Design | Case-control, Cohort |
| Restriction | Design | Any |
| Stratification | Analysis | Any |
| Multivariate analysis | Analysis | Any |
4. LEAD TIME BIAS
Where it occurs: Screening studies
Simple idea: Screening detects disease earlier, so survival time appears longer - but the patient dies at the same time. You just started counting earlier!
Definition: Lead time = period from detection of disease by screening to the time it would have been clinically diagnosed without screening.
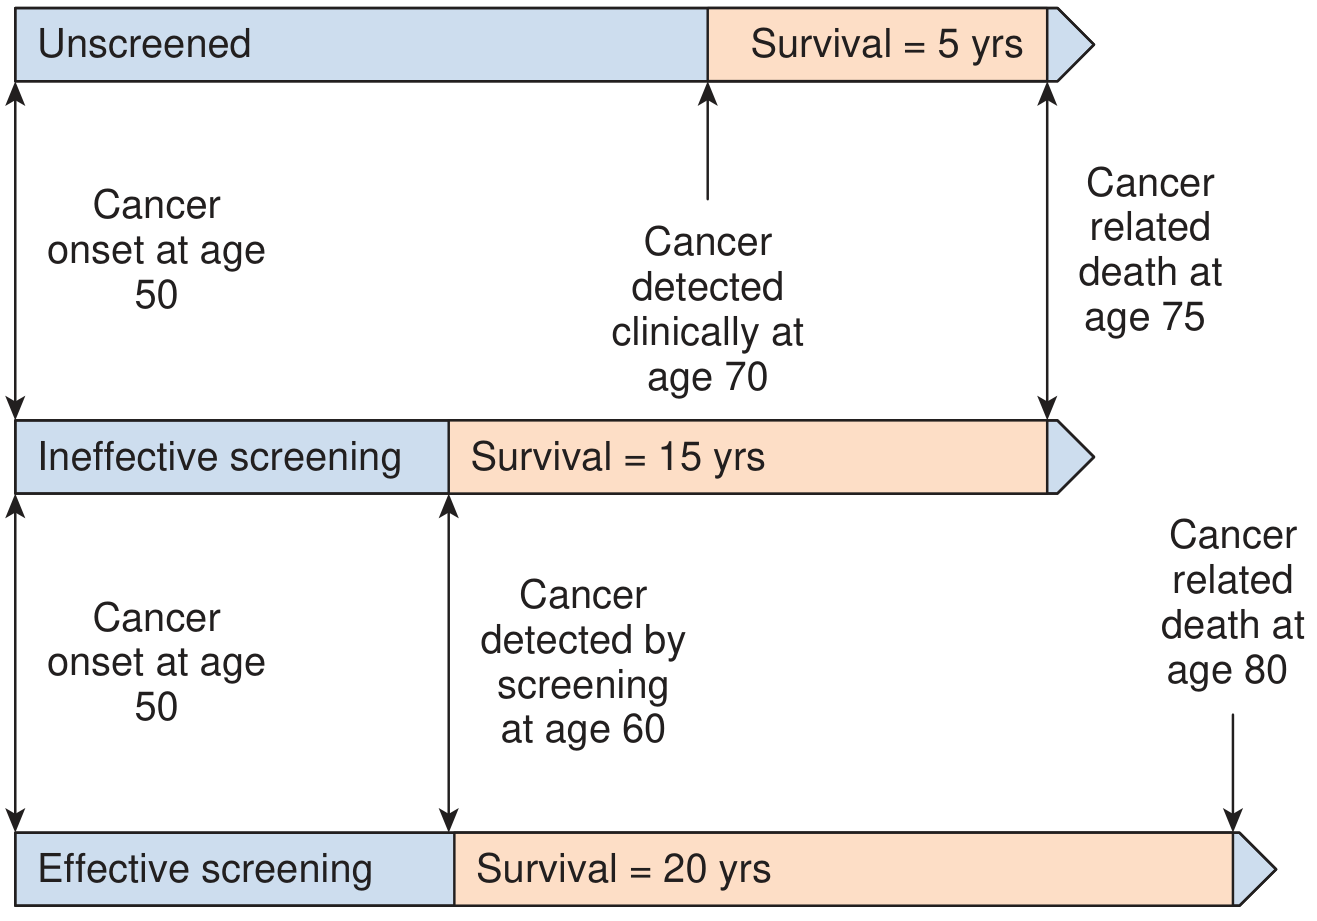
From the diagram: Without screening, cancer detected at 70, death at 75 → survival = 5 years. With (ineffective) screening, detected at 60, death still at 75 → survival appears = 15 years. The extra 10 years is pure lead-time bias - the patient didn't actually live longer!
Real-world example: PSA testing in prostate cancer and CT scans detecting kidney cancer incidentally have increased measured 5-year survival rates, but population mortality from these cancers has not changed - classic lead-time bias.
5. LENGTH BIAS (Length-Time Bias)
Where it occurs: Screening programs
Simple idea: Screening preferentially picks up slow-growing (indolent) cancers because they have a longer pre-symptomatic phase. Aggressive fast-growing cancers are missed between screening rounds. So screened patients appear to survive longer - not because screening helps, but because they had less aggressive disease to begin with.
Think of it this way:
- A rapidly growing tumor may appear between two screening rounds (interval cancer) - never caught by screening
- A slowly growing tumor stays detectable for years - always caught by screening
- The screened group is therefore enriched with good-prognosis cancers
6. HEALTHY VOLUNTEER BIAS
People who volunteer for trials or screening are generally healthier, more motivated, and have better outcomes than the general population. This makes the intervention look more effective than it really is.
QUICK EXAM SUMMARY TABLE
| Bias | Study Type | Key Feature | Prevention |
|---|---|---|---|
| Berkesonian bias | Case-control (hospital) | Hospital admission rates differ | Use population controls |
| Recall bias | Case-control | Cases remember more | Blind interviewer; use records |
| Interviewer bias | Case-control | Interviewer probes cases more | Double-blind design |
| Observer bias | Clinical trial | Assessor knows group allocation | Blinding |
| Selection bias | Any | Non-representative groups | Randomization |
| Confounding | Any | Third variable distorts | Matching, randomization, multivariate analysis |
| Lead-time bias | Screening | Earlier detection = apparent longer survival | Compare cause-specific mortality, not survival |
| Length bias | Screening | Slow tumors preferentially detected | Randomized screening trials |
EXAM MNEMONICS
- "B-R-S-I-C-L-L" for types: Berkesonian, Recall, Selection, Interviewer, Confounding, Lead-time, Length-time
- Berkesonian = Berkson's hospital bias (named after Dr. Berkson)
- Lead time = you started the clock earlier, not lived longer
- Length bias = lazy tumors get caught, aggressive ones escape
- Confounding = 3rd wheel messing up a couple's relationship
Sources: Park's Textbook of Preventive and Social Medicine (pp. 81, 86, 100); Campbell Walsh Wein Urology, p. 136
This is a shared conversation. Sign in to Orris to start your own chat.