
Cardiac cycle with ecg co relation
- P wave - atrial depolarization → atrial contraction
- PR interval - AV node delay (allows ventricular filling)
- QRS complex - ventricular depolarization → ventricular contraction (systole begins)
- ST segment - ventricular plateau (isovolumetric contraction / early ejection)
- T wave - ventricular repolarization → ventricular relaxation (diastole begins)
cardiac cycle ECG correlation pressure volume Wiggers diagram
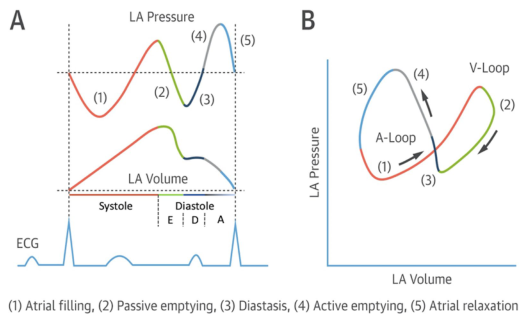
Summary : This figure illustrates the left atrial (LA) pressure-volume relationship during the cardiac cycle, showing both time-course traces and a pressure-volume loop, with key phases of atrial function annotated and correlated with the ECG. line plot and loop diagram: # Panel A: LA Pressure and Volume Traces • Top trace: LA Pressure (y-axis, arbitrary units) over time. • Middle trace: LA Volume (y-axis, arbitrary units) over time. • Bottom trace: ECG waveform for temporal reference. • X-axis: Cardiac cycle phases, with systole and diastole labeled; diastole further subdivided into E, D, and A phases. • Five phases are color-coded and numbered: – (1) Atrial filling (red) – (2) Passive emptying (green) – (3) Diastasis (black) – (4) Active emptying (blue) – (5) Atrial relaxation (gray) • Vertical dashed lines demarcate transitions between phases. # Panel B: LA Pressure-Volume Loop • X-axis: LA Volume (arbitrary units). • Y-axis: LA Pressure (arbitrary units). • The loop is traced in a counterclockwise direction, with arrows indicating the sequence. • The same five phases (1–5) are color-coded as in Panel A. • The loop is divided into two segments: A-Loop (phases 1, 3, 4, 5) and V-Loop (phase 2). # Design Encodings : • Distinct colors for each phase (red, green, black, blue, gray). • Arrows on the loop indicate the direction of the cardiac cycle. • ECG trace provides timing reference for the pressure and volume changes. # Analysis : • The LA pressure and volume traces show cyclical changes corresponding to atrial filling, emptying, and relaxation. • The pressure-volume loop visually summarizes the dynamic relationship between LA pressure and volume, with distinct segments for passive and active phases. • The figure highlights the temporal coordination between atrial events and the ECG, emphasizing the mechanical and electrical coupling in the cardiac cycle.
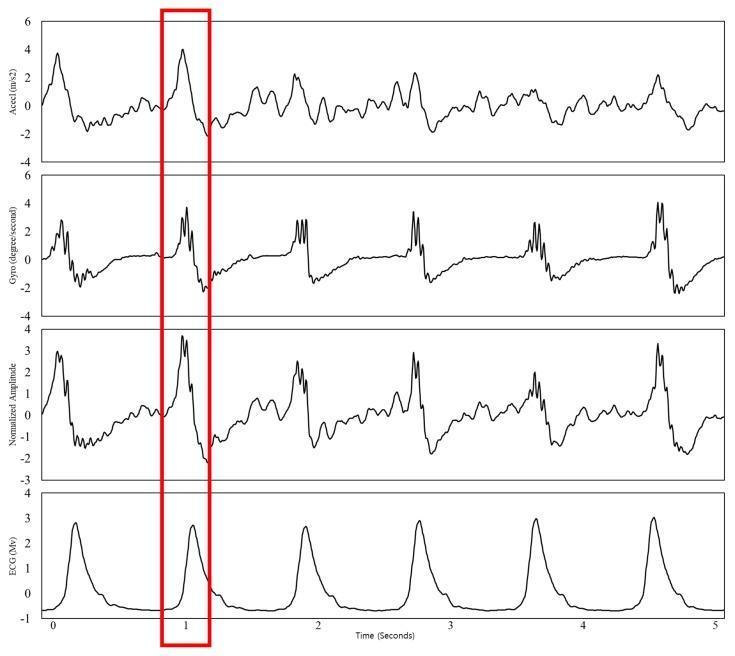
This physiological signal diagram illustrates the temporal correlation between mechanical and electrical cardiac activity over a 5-second interval. The figure consists of four vertically stacked, time-synchronized plots sharing a common horizontal axis (Time in Seconds). From top to bottom, the waveforms represent: 1) Accelerometer data (Accel in m/s²), 2) Gyroscope data (Gyro in degrees/second), 3) Normalized Amplitude (representing the ensemble averaging of the motion sensors), and 4) Electrocardiogram (ECG in mV). A vertical red box highlights a specific epoch around the 1-second mark, demonstrating that the mechanical peaks in the seismocardiogram (SCG) and gyrocardiogram (GCG) signals correspond directly with the R-wave peak of the ECG. This visualization is used to demonstrate the efficacy of multi-axis MEMS sensors in capturing cardiac-induced chest vibrations and their synchronization with the heart's electrical cycle, which is essential for non-invasive heart rate monitoring and hemodynamic assessment.
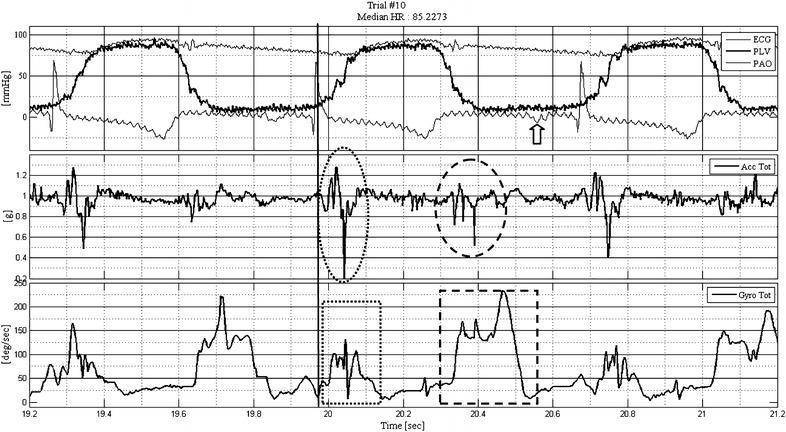
A three-panel physiological waveform diagram illustrating the temporal relationship between cardiac hemodynamics and motion sensor signals. The upper panel displays a synchronized Electrocardiogram (ECG), Left Ventricular Pressure (PLV), and Aortic Pressure (PAO). A vertical arrow highlights the P wave, while a vertical line marks the R wave, corresponding to the onset of ventricular systole where PLV rises and eventually equilibrates with PAO. The middle panel shows the total composite accelerometer (Acc Tot) signal, with a dotted ellipse identifying the systolic tension onset signal (STOS) and a dashed ellipse highlighting the diastolic acceleration component. The lower panel displays the total angular velocity (Gyro Tot) signal measured in degrees per second, with a dotted box marking the systolic gyroscopic activity and a dashed box outlining the diastolic phase. These waveforms demonstrate that mechanical motion signals from accelerometers and gyroscopes correlate with specific phases of the cardiac cycle, such as systolic contraction and diastolic filling, as defined by the concurrent pressure and ECG traces.
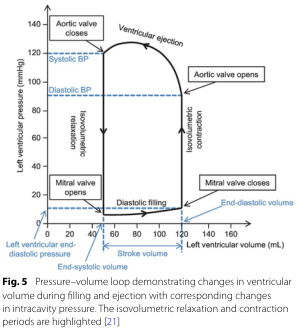
Summary : This figure shows a pressure–volume loop for the left ventricle, illustrating how ventricular volume and pressure change during the cardiac cycle, with key phases and valve events annotated. The isovolumetric relaxation and contraction periods are highlighted, and systolic/diastolic blood pressures are marked. pressure–volume loop diagram: # Title & Axes : • No explicit title on the figure, but the legend describes it as a "Pressure–volume loop demonstrating changes in ventricular volume during filling and ejection with corresponding changes in intracavity pressure." • X-axis: "Left ventricular volume (mL)" with tick marks at 0, 20, 40, 60, 80, 100, 120, 140, 160. • Y-axis: "Left ventricular pressure (mmHg)" with tick marks at 0, 20, 40, 60, 80, 100, 120, 140. • Additional axis labels: "Left ventricular end-diastolic pressure" (blue, left), "End-diastolic volume" (blue, bottom right), "Stroke volume" (black, bottom center). # Phases & Events : • Isovolumetric relaxation: vertical line at low volume, pressure drops, labeled. • Diastolic filling: horizontal line at low pressure, volume increases, labeled. • Isovolumetric contraction: vertical line at high volume, pressure rises, labeled. • Ventricular ejection: curved line, volume decreases as pressure peaks and falls, labeled. • Valve events: – Mitral valve opens (bottom left corner, low pressure/volume). – Mitral valve closes (bottom right corner, high volume/low pressure). – Aortic valve opens (top right corner, high volume/high pressure). – Aortic valve closes (top left corner, low volume/high pressure). # Blood Pressure Markers : • Systolic BP: horizontal dashed blue line at ~120 mmHg. • Diastolic BP: horizontal dashed blue line at ~80 mmHg. # Design Encodings : • Black solid lines for the loop. • Blue dashed lines for blood pressure markers. • Blue text for end-diastolic volume/pressure. • Labeled arrows for direction of phases and valve events. # Analysis : • The loop traces the cardiac cycle, starting at low pressure/volume (end-systolic), filling during diastole, rising sharply during isovolumetric contraction, ejecting blood during ventricular ejection, and dropping pressure during isovolumetric relaxation. • Systolic and diastolic blood pressures are marked, showing the pressure range during ejection. • The width of the loop (horizontal distance) represents stroke volume. • The figure clearly distinguishes the four main phases and the timing of valve openings/closings, providing a comprehensive view of ventricular mechanics during a heartbeat.
Wiggers diagram cardiac cycle phases aortic left ventricular pressure ECG heart sounds
A three-panel physiological waveform diagram illustrating the temporal relationship between cardiac hemodynamics and motion sensor signals. The upper panel displays a synchronized Electrocardiogram (ECG), Left Ventricular Pressure (PLV), and Aortic Pressure (PAO). A vertical arrow highlights the P wave, while a vertical line marks the R wave, corresponding to the onset of ventricular systole where PLV rises and eventually equilibrates with PAO. The middle panel shows the total composite accelerometer (Acc Tot) signal, with a dotted ellipse identifying the systolic tension onset signal (STOS) and a dashed ellipse highlighting the diastolic acceleration component. The lower panel displays the total angular velocity (Gyro Tot) signal measured in degrees per second, with a dotted box marking the systolic gyroscopic activity and a dashed box outlining the diastolic phase. These waveforms demonstrate that mechanical motion signals from accelerometers and gyroscopes correlate with specific phases of the cardiac cycle, such as systolic contraction and diastolic filling, as defined by the concurrent pressure and ECG traces.
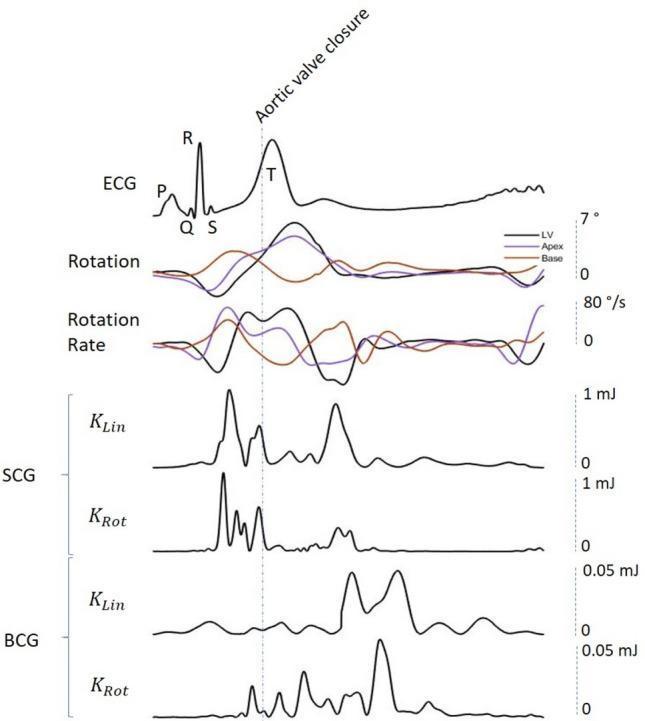
This physiological signal diagram illustrates the temporal synchronization of cardiac mechanical and electrical events over a single heart cycle. The visualization includes seven aligned waveforms: (a) a standard lead ECG with labeled P-Q-R-S-T complexes; (b) Left Ventricular (LV) rotation mechanics showing apical (purple), basal (brown), and net LV twist (black) in degrees; (c) corresponding rotation rates in degrees per second; (d-e) Seismocardiogram (SCG) representing linear (KLin) and rotational (KRot) kinetic energy in millijoules (mJ); and (f-g) Ballistocardiogram (BCG) also representing KLin and KRot energy. A vertical dashed line indicates Aortic Valve Closure (AVC). The diagram highlights key pathophysiological relationships: SCG energy peaks bimodal, occurring during the ejection phase (pre-AVC) and early diastole (post-AVC), while BCG energy peaks appear almost exclusively during the diastolic phase (post-AVC). This chart serves as an educational tool for understanding the relationship between electrical conduction, myocardial rotational mechanics, and the kinetic energy generated by cardiac micro-accelerations and body displacements.
Summary : This figure shows a pressure–volume loop for the left ventricle, illustrating how ventricular volume and pressure change during the cardiac cycle, with key phases and valve events annotated. The isovolumetric relaxation and contraction periods are highlighted, and systolic/diastolic blood pressures are marked. pressure–volume loop diagram: # Title & Axes : • No explicit title on the figure, but the legend describes it as a "Pressure–volume loop demonstrating changes in ventricular volume during filling and ejection with corresponding changes in intracavity pressure." • X-axis: "Left ventricular volume (mL)" with tick marks at 0, 20, 40, 60, 80, 100, 120, 140, 160. • Y-axis: "Left ventricular pressure (mmHg)" with tick marks at 0, 20, 40, 60, 80, 100, 120, 140. • Additional axis labels: "Left ventricular end-diastolic pressure" (blue, left), "End-diastolic volume" (blue, bottom right), "Stroke volume" (black, bottom center). # Phases & Events : • Isovolumetric relaxation: vertical line at low volume, pressure drops, labeled. • Diastolic filling: horizontal line at low pressure, volume increases, labeled. • Isovolumetric contraction: vertical line at high volume, pressure rises, labeled. • Ventricular ejection: curved line, volume decreases as pressure peaks and falls, labeled. • Valve events: – Mitral valve opens (bottom left corner, low pressure/volume). – Mitral valve closes (bottom right corner, high volume/low pressure). – Aortic valve opens (top right corner, high volume/high pressure). – Aortic valve closes (top left corner, low volume/high pressure). # Blood Pressure Markers : • Systolic BP: horizontal dashed blue line at ~120 mmHg. • Diastolic BP: horizontal dashed blue line at ~80 mmHg. # Design Encodings : • Black solid lines for the loop. • Blue dashed lines for blood pressure markers. • Blue text for end-diastolic volume/pressure. • Labeled arrows for direction of phases and valve events. # Analysis : • The loop traces the cardiac cycle, starting at low pressure/volume (end-systolic), filling during diastole, rising sharply during isovolumetric contraction, ejecting blood during ventricular ejection, and dropping pressure during isovolumetric relaxation. • Systolic and diastolic blood pressures are marked, showing the pressure range during ejection. • The width of the loop (horizontal distance) represents stroke volume. • The figure clearly distinguishes the four main phases and the timing of valve openings/closings, providing a comprehensive view of ventricular mechanics during a heartbeat.
Cardiac Cycle with ECG Correlation
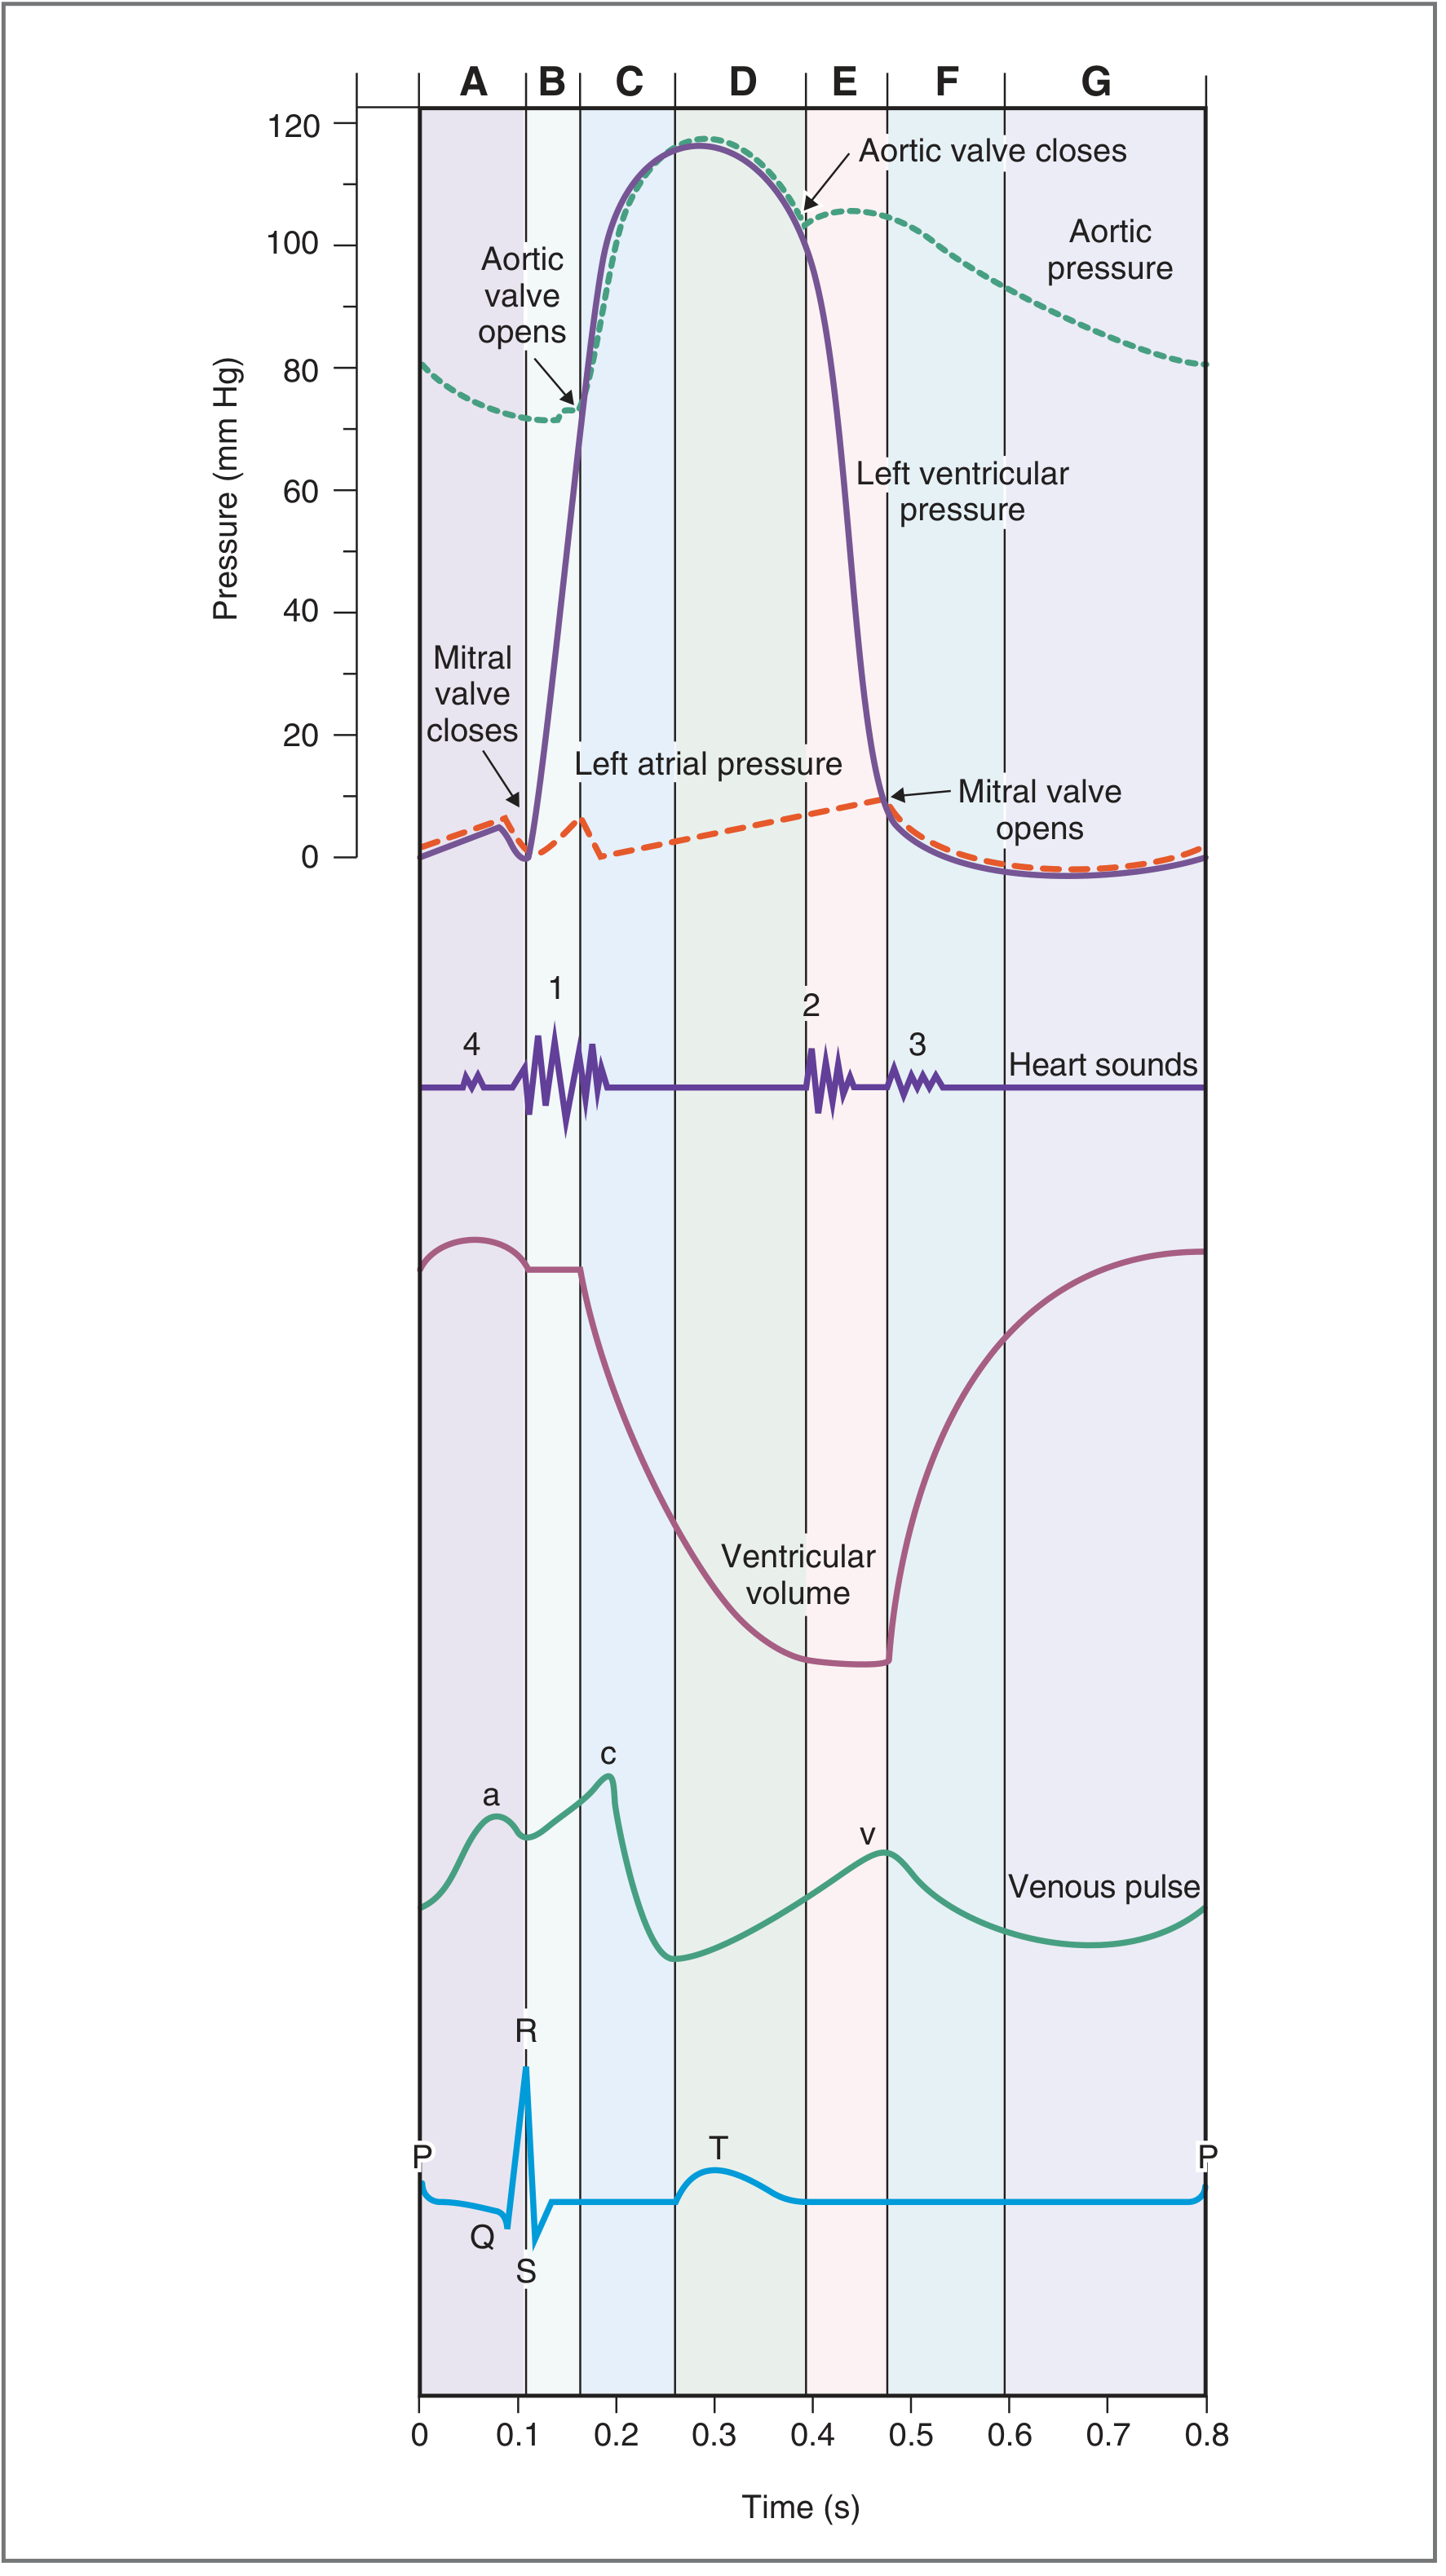
The 7 Phases - ECG Correlation
Phase A - Atrial Systole
| Parameter | Event |
|---|---|
| ECG | P wave (atrial depolarization) |
| Mechanical | Atria contract; final 20-30% of ventricular filling occurs |
| Pressures | Left atrial pressure rises |
| Valves | Mitral valve open; aortic valve closed |
| Heart Sound | S4 (normally inaudible; heard in stiff/hypertrophied ventricle) |
| Venous pulse | a wave (atrial contraction reflected back to jugular vein) |
Key concept: The PR interval represents the AV nodal delay (~0.1 sec), which allows the atria to finish contracting and fill the ventricles before ventricular systole begins.
Phase B - Isovolumetric Ventricular Contraction (IVC)
| Parameter | Event |
|---|---|
| ECG | QRS complex (ventricular depolarization) |
| Mechanical | Ventricles contract; pressure rises sharply |
| Volume | Constant - ALL valves are closed |
| Valves | Mitral valve closes (LV pressure > LA pressure) |
| Heart Sound | S1 ("lub") - closure of mitral (then tricuspid) valve |
| Venous pulse | c wave - bulging of tricuspid valve into right atrium |
This is the period of maximum pressure build-up with no blood movement. LV pressure rises from ~0 to ~80 mmHg.
Phase C - Rapid Ventricular Ejection
| Parameter | Event |
|---|---|
| ECG | ST segment |
| Mechanical | Most of stroke volume (~70%) ejected into aorta |
| Volume | Ventricular volume falls sharply (EDV ~130 mL → ESV ~50 mL) |
| Pressures | LV pressure peaks (~120 mmHg); aortic pressure rises to peak |
| Valves | Aortic valve opens (LV pressure > aortic pressure) |
| Heart Sound | None |
Phase D - Reduced Ventricular Ejection
| Parameter | Event |
|---|---|
| ECG | T wave begins (ventricular repolarization starts) |
| Mechanical | Blood continues ejecting but at a slower rate |
| Volume | Continues to fall (slowly) |
| Pressures | Aortic pressure begins to fall as "runoff" exceeds ejection |
| Valves | Aortic valve still open |
Phase E - Isovolumetric Ventricular Relaxation (IVR)
| Parameter | Event |
|---|---|
| ECG | After T wave ends (ventricles fully repolarized) |
| Mechanical | Ventricles relax; pressure falls dramatically |
| Volume | Constant - ALL valves are closed again |
| Valves | Aortic valve closes (LV pressure < aortic pressure) |
| Heart Sound | S2 ("dub") - closure of aortic (then pulmonic) valve |
| Aortic pressure | Shows dicrotic notch (incisura) at the moment of aortic valve closure |
Physiological splitting of S2 occurs on inspiration: increased venous return delays pulmonic valve closure relative to aortic valve closure.
Phase F - Rapid Ventricular Filling
| Parameter | Event |
|---|---|
| ECG | Electrically silent (between T wave and next P wave) |
| Mechanical | Ventricle fills passively; ~70-80% of filling occurs here |
| Volume | Rises rapidly |
| Pressures | LV pressure remains low (compliant ventricle) |
| Valves | Mitral valve opens (LV pressure < LA pressure) |
| Heart Sound | S3 - normal in children; indicates volume overload (CHF, MR, TR) in adults |
| Venous pulse | v wave (atrial filling while tricuspid is closed) → y descent (when tricuspid opens) |
Phase G - Reduced Ventricular Filling (Diastasis)
| Parameter | Event |
|---|---|
| ECG | Electrically silent |
| Mechanical | Slow, passive filling continues; atria and ventricles in equilibrium |
| Heart Sound | None |
This phase shortens or disappears as heart rate increases.
ECG-Cardiac Cycle Summary Table
| ECG Feature | Duration | Mechanical Correlation |
|---|---|---|
| P wave | ~80 ms | Atrial depolarization → atrial contraction |
| PR interval | 120-200 ms | AV nodal delay; ventricular filling completes |
| QRS complex | <120 ms | Ventricular depolarization → IVC begins, S1 |
| ST segment | Variable | Ventricular plateau; rapid ejection |
| T wave | ~160 ms | Ventricular repolarization; reduced ejection → IVR begins |
| QT interval | 350-440 ms | Entire ventricular systole (IVC + ejection) |
| TP interval | Variable | Ventricular diastole (IVR + filling) |
Pressure-Volume Loop
- Bottom right corner → Mitral valve closes (end-diastole; EDV ~130 mL)
- Left vertical line (rising) → Isovolumetric contraction
- Top left corner → Aortic valve opens; ejection begins
- Top right curve → Ventricular ejection (volume falls)
- Top left corner → Aortic valve closes (end-systole; ESV ~50 mL)
- Left vertical line (falling) → Isovolumetric relaxation
- Bottom left corner → Mitral valve opens; filling begins
- Width of the loop = Stroke Volume (~80 mL)
Jugular Venous Pulse (JVP) Waves - ECG Correlation
| Wave | Cause | ECG Timing |
|---|---|---|
| a wave | Atrial contraction | After P wave |
| c wave | Tricuspid bulging + carotid artefact | At QRS |
| x descent | Atrial relaxation + tricuspid pulled down during systole | ST segment |
| v wave | Venous filling while tricuspid is closed | T wave |
| y descent | Tricuspid opens; blood flows into ventricle | After T wave |
Key Points to Remember
- Electrical event always precedes the mechanical event - depolarization triggers contraction; repolarization triggers relaxation.
- IVC and IVR are periods when all valves are closed - volume is fixed but pressure is changing.
- S1 = mitral/tricuspid closure (start of IVC, at QRS); S2 = aortic/pulmonic closure (start of IVR, after T wave).
- At high heart rates, diastole is preferentially shortened - diastasis disappears first, then rapid filling shortens. This is why tachycardia impairs ventricular filling.
- The QT interval represents total ventricular systole. A prolonged QT = prolonged action potential = arrhythmia risk.
Coronary circulation from millers in a simple format
coronary artery anatomy left right LAD circumflex diagram
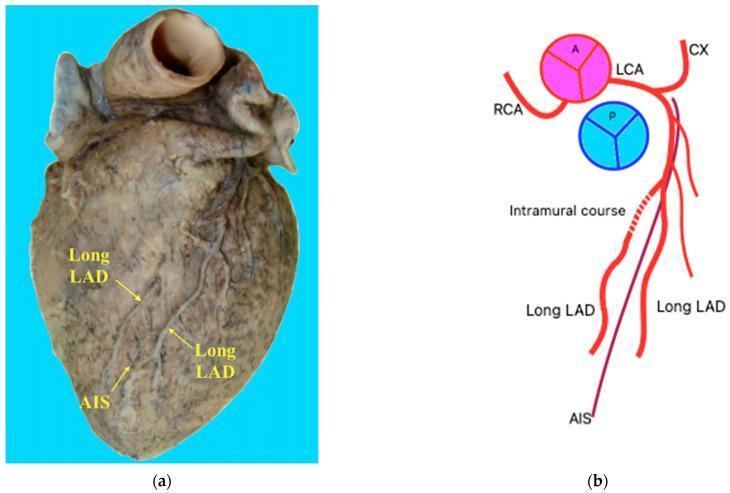
This educational image consists of a clinical photograph (a) and a schematic diagram (b) illustrating a dual left anterior descending (LAD) coronary artery variant. The photograph displays a dissected human heart specimen in the anterior view, highlighting the course of the coronary vasculature. Labeled structures include the Anterior Interventricular Sulcus (AIS) and two distinct 'Long LAD' branches descending parallel to each other. The schematic representation details the origin of these vessels from the Left Coronary Artery (LCA), alongside the Right Coronary Artery (RCA) and Circumflex Artery (CX). A critical anatomical feature demonstrated is the 'intramural course' of the right-sided LAD branch, where a portion of the vessel is embedded within the myocardium (myocardial bridge) before resurfacing. This variant is clinically significant for cardiothoracic surgery and interventional cardiology, as it represents a deviation from standard coronary anatomy (specifically resembling Pellegrini Type XIII) that can impact diagnostic interpretation and surgical planning for revascularization.
Summary : This figure presents a schematic diagram and three echocardiographic images illustrating the anatomical relationship and visualization of the coronary arteries and aorta.
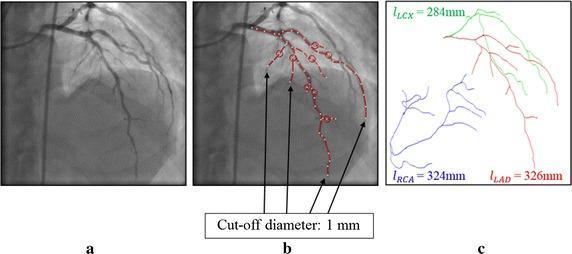
This figure illustrates the process of measuring coronary artery lengths for OCT-FFR simulation using coronary X-ray angiography (CAG). Panel (a) presents a raw clinical diagnostic image of the left coronary arterial tree. Panel (b) shows the same angiogram with an overlay of red circles and connecting lines, indicating the vessel segments selected for length calculation based on a minimum cut-off diameter of 1 mm. Panel (c) provides a segmented anatomical diagram and quantitative data representing the total lengths of the primary coronary arteries. In this panel, the Left Anterior Descending artery (LAD) is color-coded red with a measured length of 326 mm, the Left Circumflex artery (LCX) is green at 284 mm, and the Right Coronary Artery (RCA) is blue at 324 mm. This visualization demonstrates the methodology for estimating regional coronary resistance based on vascular anatomy to support hemodynamic modeling and fractional flow reserve (FFR) calculations in cardiology.
myocardial oxygen supply demand determinants coronary perfusion
Coronary Circulation - Miller's Anesthesia (10th Ed.)
1. Coronary Anatomy
Two Main Coronary Arteries
AORTA
├── Left Main Coronary Artery (LMCA)
│ ├── Left Anterior Descending (LAD)
│ │ ├── Diagonal branches → anterolateral wall of LV
│ │ ├── Septal branches → interventricular septum, bundle branches, Purkinje system
│ │ └── Terminates at apex of LV
│ └── Left Circumflex (LCx)
│ ├── Obtuse marginal branches (1-3) → lateral wall of LV
│ └── Sinus node artery in 45% of patients
│
└── Right Coronary Artery (RCA)
├── Acute marginal branches → right anterior wall of RV
├── AV node artery (from dominant artery)
└── Sinus node artery in 55% of patients
Coronary Dominance
| Dominance | Who Gives PDA? | % Population |
|---|---|---|
| Right dominant | RCA gives posterior descending artery (PDA) | 85% |
| Left dominant | LCx gives PDA | 15% |
The dominant artery also gives rise to the AV node artery, which supplies the AV node, Bundle of His, and proximal bundle branches.
2. Coronary Blood Flow - Key Facts
| Feature | Detail |
|---|---|
| When does flow occur? | 70-80% during diastole |
| Why not systole? | Ventricular contraction increases intramyocardial pressure → compresses coronary vessels |
| Coronary perfusion pressure (CPP) for LV | Aortic diastolic pressure - LVEDP |
| Oxygen extraction at rest | Already near-maximal |
| How does O2 supply increase with demand? | Only by increasing coronary blood flow (can't extract more) |
Clinical pearl: High LVEDP (e.g., in heart failure) directly reduces subendocardial perfusion. The subendocardium is the most vulnerable zone.
3. Determinants of Myocardial Oxygen Supply
O2 Supply = Oxygen Content × Coronary Blood Flow
- Coronary perfusion pressure (CPP = Ao diastolic pressure - LVEDP)
- Coronary vascular resistance (autoregulated)
- Duration of diastole - longer diastole = more flow time (key reason tachycardia is dangerous)
- Hemoglobin level (primary carrier)
- PaO2 (dissolved O2 is minor)
- Oxyhemoglobin dissociation curve position:
- Leftward shift (alkalosis, hypothermia, low 2,3-DPG) → less O2 released to tissues
4. Determinants of Myocardial Oxygen Demand
| Determinant | Mechanism |
|---|---|
| Heart rate | Most important - increases demand AND reduces diastolic supply time |
| Afterload (wall tension) | ↑ BP → ↑ wall stress → ↑ O2 need |
| Contractility (inotropy) | More forceful contraction = more O2 consumed |
| Preload | ↑ ventricular volume → ↑ wall tension (Laplace) |
Tachycardia is doubly dangerous - it increases demand while simultaneously cutting diastolic filling time (reducing supply). This is the rationale for using beta-blockers as first-line anti-ischemic agents.
5. Coronary Autoregulation
- Coronary vessels maintain constant flow over a wide range of perfusion pressures (~50-150 mmHg)
- Achieved by metabolic autoregulation: adenosine, CO2, and H+ are the key local vasodilators released when O2 demand rises
- Distal to a coronary stenosis: vessels are already maximally dilated → autoregulation is lost → flow becomes pressure-dependent
- This is why perfusion pressure manipulation becomes critical in patients with CAD
6. Supply vs. Demand Imbalance → Ischemia
| Cause of Ischemia | Mechanism |
|---|---|
| Hypotension | ↓ CPP → ↓ coronary flow |
| Tachycardia | ↑ demand + ↓ diastolic time |
| Anemia | ↓ O2 content of blood |
| Coronary vasoconstriction / spasm | ↓ supply |
| ↑ Afterload / hypertension | ↑ demand |
| ↑ LVEDP | ↓ subendocardial perfusion |
Monitoring for Ischemia (Perioperatively):
- ECG - ST-segment changes (most common method)
- TEE - regional wall motion abnormalities (earlier and more sensitive sign)
7. Coronary Steal
- Vasodilated normal vessel "steals" blood from the fixed-resistance collateral pathway
- Relevant in patients with significant CAD and collateral circulation
Quick Summary Table
| Topic | Key Point |
|---|---|
| Main coronary arteries | LMCA (→ LAD + LCx) and RCA |
| Dominant vessel | RCA in 85%, LCx in 15% |
| Flow timing | 70-80% in diastole |
| CPP for LV | Ao diastolic - LVEDP |
| Most dangerous hemodynamic change | Tachycardia (↑ demand + ↓ supply simultaneously) |
| Most vulnerable zone | Subendocardium |
| Best anti-ischemic drug class | Beta-blockers |
| Ischemia monitoring | ECG (ST changes) + TEE (wall motion) |
In detail about coronary artery
coronary artery anatomy heart anterior posterior view labeled diagram
right coronary artery left coronary artery branches supply territory
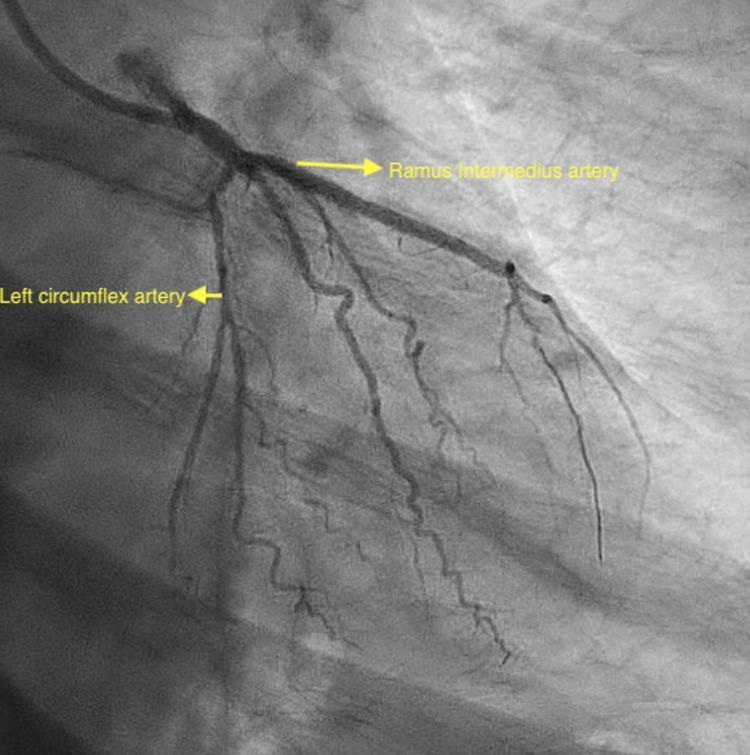
This diagnostic image is a coronary angiogram captured in the right anterior oblique (RAO) caudal projection, providing a specific view of the left coronary system. The image features the left circumflex (LCx) artery and a prominent ramus intermedius (RI) artery, both clearly labeled with yellow arrows. A key educational finding in this image is the absence of the left anterior descending (LAD) artery from its typical anatomical origin at the left main bifurcation, indicating a congenital coronary artery anomaly. The image demonstrates the vessels post-percutaneous coronary intervention (PCI), where the RI artery appears patent following the placement of a drug-eluting stent to treat in-stent thrombosis. This visual material is highly relevant for cardiology training in identifying anomalous coronary origins and understanding the nuances of coronary anatomy during invasive catheterization. The anatomical variants shown illustrate how the ramus intermedius can supply territory typically served by other major branches when anomalies are present.
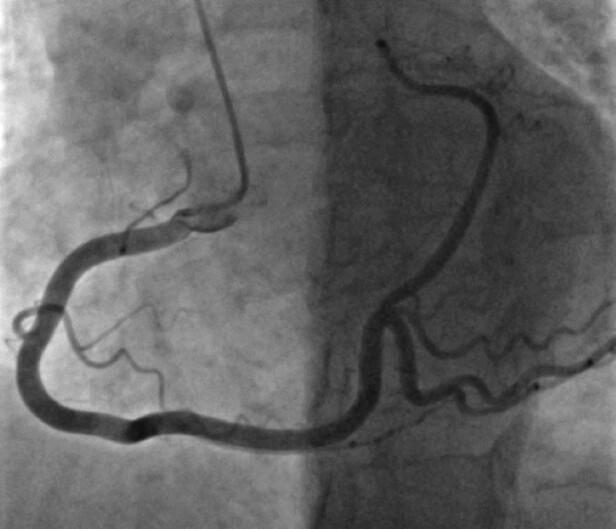
This diagnostic image is a coronary angiogram (fluoroscopic x-ray) demonstrating a right-dominant coronary circulation. The primary focus is the Right Coronary Artery (RCA), which follows a characteristic 'C-shaped' trajectory within the right atrioventricular groove. The vessel exhibits typical anatomy, bifurcating at the crux of the heart into two significant terminal branches: the Posterior Descending Artery (PDA), which travels inferiorly to supply the posterior interventricular septum, and a prominent Posterolateral (PL) branch that travels toward the lateral wall, occupying the territory usually associated with the Left Circumflex Artery (LCX). The image displays the branching pattern and vessel morphology essential for assessing coronary artery disease. A subtle luminal irregularity or darkening is visible along the horizontal segment of the main vessel before the distal bifurcation, which may indicate atherosclerotic plaque or a focal stenosis. This visual serves as an educational example of coronary dominance and normal vs. variant coronary anatomy during cardiac catheterization.
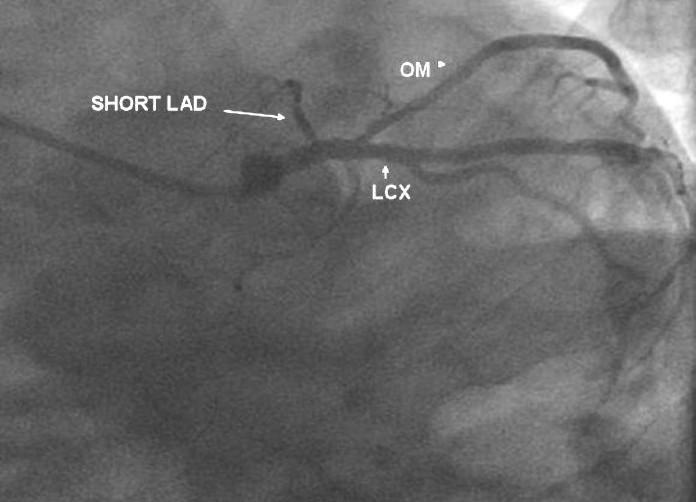
This diagnostic coronary angiogram, captured in a Left Anterior Oblique (LAO) cranial projection, illustrates a congenital coronary anomaly known as Type IV Dual LAD. The image displays the left coronary system following contrast injection. A 'SHORT LAD' (Left Anterior Descending) artery is seen arising from the left main coronary trunk; it is notably truncated, terminating high in the anterior interventricular sulcus and giving rise to small septal branches. Parallel to this, the 'LCX' (Left Circumflex) artery exhibits a normal course, following the atrioventricular groove and giving off a prominent 'OM' (Obtuse Marginal) branch. This visual evidence supports the Spindola-Franco classification of dual LAD systems, where a short LAD originates from the left side and a longer, anomalous LAD (not shown in this specific frame) typically arises from the right coronary artery or right sinus to supply the distal territory. The imaging modality is X-ray fluoroscopy, crucial for interventional cardiology and surgical planning.
Coronary Arteries - Detailed
1. Origin
| Artery | Origin | Sinus |
|---|---|---|
| Left Main Coronary Artery (LMCA) | Left coronary sinus of Valsalva | Posterior-left |
| Right Coronary Artery (RCA) | Right coronary sinus of Valsalva | Anterior-right |
The LMCA courses between the body of the left atrium and the main pulmonary artery for ~1 cm before bifurcating.
2. Left Coronary Artery System
Left Main Coronary Artery (LMCA)
- Length: a few mm to several cm (highly variable)
- Supplies 75-100% of the left ventricle via its branches
- Significant LM stenosis carries extraordinarily high mortality risk - isolated LM disease occurs in only 4-6% of cases; most have concurrent multivessel disease
A. Left Anterior Descending Artery (LAD)
- Courses anterolaterally relative to the pulmonary trunk
- Runs along the anterior interventricular groove toward the apex
- Often forms an anastomosis with the PDA at the apex
| Branch | Course | Territory Supplied |
|---|---|---|
| Diagonal branches | Course obliquely over the LV free wall | Anterolateral wall of LV |
| Septal perforators | Penetrate into the interventricular septum | Anterior 2/3 of IVS, bundle branches, Purkinje system |
| LAD itself | Terminates at / wraps around the LV apex | Anterior wall, apex |
B. Left Circumflex Artery (LCx)
- Travels in the left atrioventricular groove
- Gives off obtuse marginal branches (1-3) traveling toward the apex, then terminates as the left posterolateral branch
| Branch | Territory |
|---|---|
| Obtuse marginal branches | Lateral wall of LV |
| Posterolateral branch | Inferolateral/posterior LV wall |
| Sinus node artery | In 45% of patients |
| PDA (left dominant) | Posterior IVS and inferior LV wall (in 8-15%) |
3. Right Coronary Artery System
- Ostium diameter: 2-3 mm
- Runs obliquely rightward in the right atrioventricular groove
- Principal blood supply to the RV free wall
| Branch | Course | Territory |
|---|---|---|
| Acute marginal artery (AMA) | Traverses the acute margin toward the apex | Lateral wall of RV; anastomoses with LAD at apex |
| Sinus node artery | Ascends to SA node | SA node in 55% of patients |
| AV node artery (AVNA) | Descends from dominant artery at crux | AV node, Bundle of His, proximal bundle branches |
| PDA (posterior descending artery) | Runs in the inferior interventricular groove | Inferior IVS, inferior free wall, septal papillary muscle of mitral valve |
| Right posterolateral artery | Terminal RCA branch | Posterior LV wall |
4. Coronary Dominance
| Dominance | PDA from | % Population | Mortality implication |
|---|---|---|---|
| Right dominant | RCA | 85% | Reference |
| Left dominant | LCx | 8% | HR 1.13 for mortality vs right dominant |
| Codominant | Both RCA + LCA | 7% | Same as right dominant |
Left dominance carries slightly higher mortality: if LCx/LMCA is compromised, it takes down both the lateral wall AND the posterior IVS (via PDA).
5. Myocardial Territory Supplied - 17 Segment Model
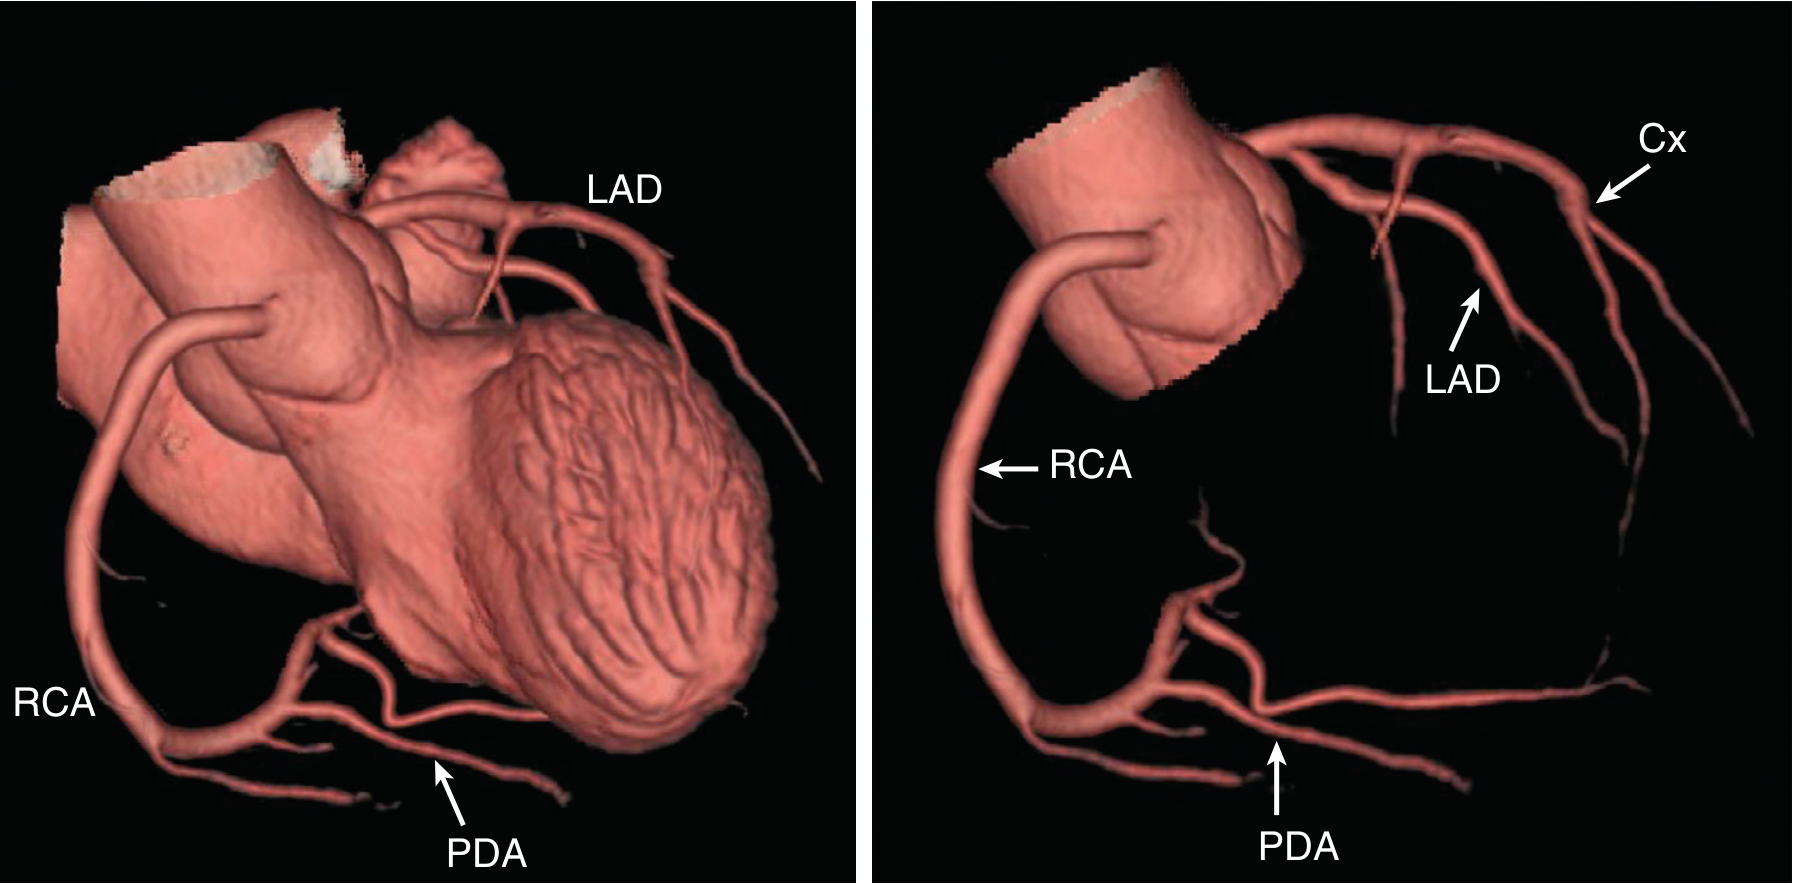
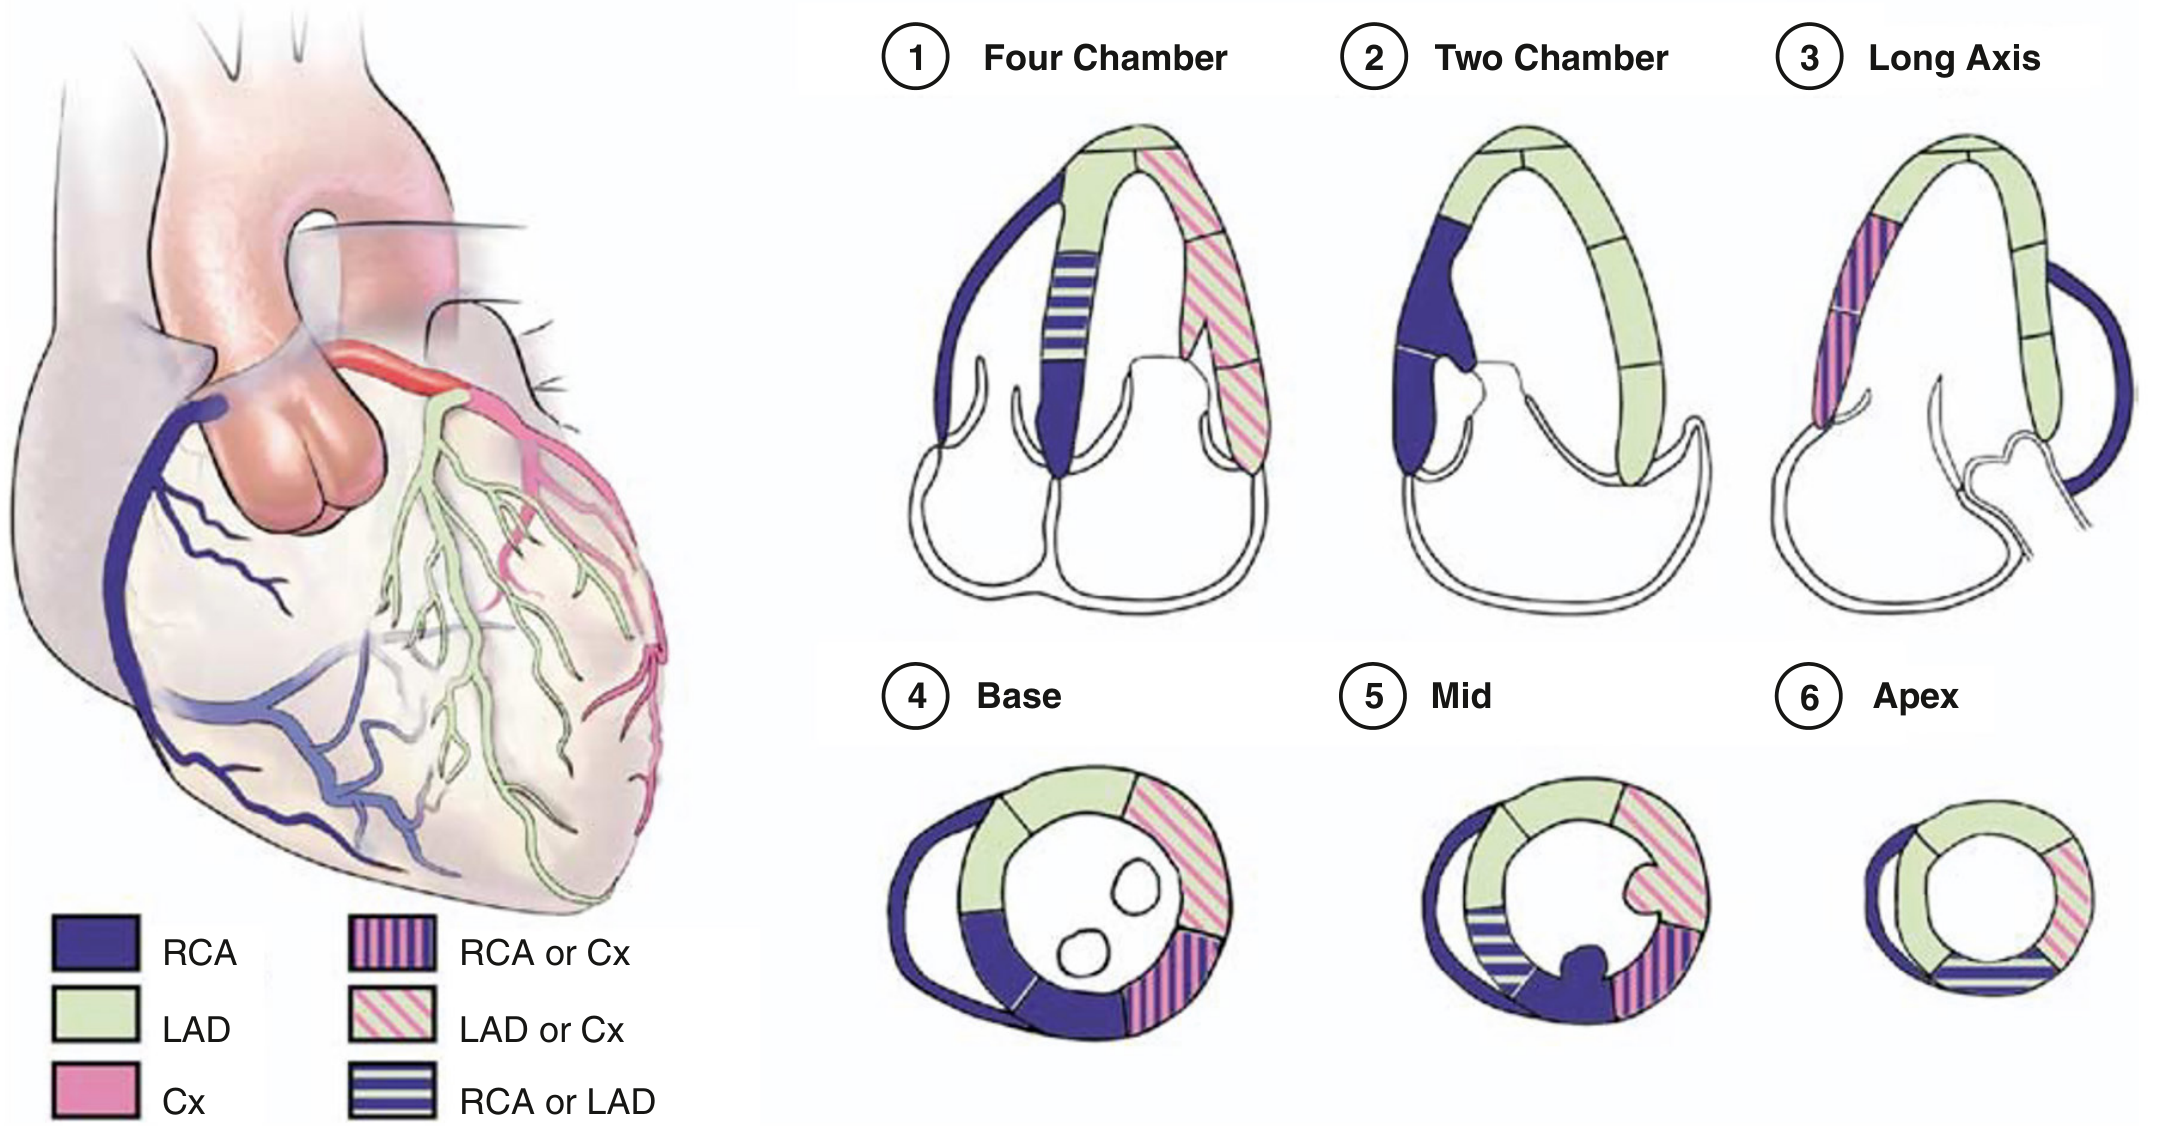
| LV Wall Segment | Primary Supply | Variable Supply |
|---|---|---|
| Anterior wall | LAD (diagonal branches) | - |
| Anterior IVS | LAD (septal perforators) | - |
| Lateral wall | LCx (obtuse marginals) | LAD or RCA |
| Inferior wall | PDA (from RCA usually) | - |
| Inferior IVS | PDA | - |
| Inferolateral/posterior wall | LCx or RCA extension | Variable |
| Apex | LAD + PDA | Most variable zone |
6. Conduction System Blood Supply
| Conduction Structure | Primary Supply | Artery Source |
|---|---|---|
| SA node | RCA (55%) or LCx (45%) | Dominant supply varies |
| AV node | From dominant artery | RCA (85%) or LCx (15%) |
| Bundle of His | AV node artery | Dominant artery |
| Right bundle branch | LAD (septal perforators) | |
| Left bundle branch (anterior fascicle) | LAD | |
| Left bundle branch (posterior fascicle) | Dual supply - LAD + RCA/PDA | Most protected |
Clinical implication: RCA occlusion (right dominant) → blocks AV node artery → AV block (Mobitz I / complete heart block). LAD proximal occlusion → blocks bundle branches → LBBB or RBBB.
7. Venous Drainage
| Venous System | Drains Into | What It Drains |
|---|---|---|
| Coronary sinus (largest) | Right atrium | Most of LV and part of RV |
| Anterior cardiac veins | Right atrium directly | RV anterior wall |
| Thebesian veins | Directly into cardiac chambers | Small amount; inner myocardium |
8. Pathophysiology of Coronary Artery Disease (CAD)
Atherogenesis - Step by Step
Risk factors (HTN, hyperlipidemia, smoking, DM)
↓
Endothelial Dysfunction
→ ↓ Nitric oxide (NO) → vasoconstriction + inflammation
↓
Monocyte adhesion → transmigrate into intima
→ Differentiate into macrophages
→ Ingest oxidized LDL → Foam cells
↓
Fatty streak → Fibrous plaque
T-cells secrete TNF-α, IL-6 → further inflammation
MMPs degrade fibrous cap → plaque instability
↓
Stable plaque = gradual lumen narrowing (stable angina)
Unstable plaque = fibrous cap rupture → thrombus → ACS
CAD Consequences by Severity
| Stenosis | Physiological Effect |
|---|---|
| <50% | Usually no flow limitation; autoregulation intact |
| 50-70% | Reduced flow reserve; symptoms on exertion |
| >70% | Significant flow limitation at rest |
| >90% | Critical stenosis; resting ischemia |
| >50% LMCA | Very high mortality risk |
9. Clinical Correlations
Occlusion Consequences
| Artery Occluded | Area Infarcted | ECG Changes | Complications |
|---|---|---|---|
| Proximal LAD | Anterior + anterior IVS + apex | ST↑ V1-V4 | LBBB, cardiogenic shock |
| RCA (right dominant) | Inferior wall + RV | ST↑ II, III, aVF | AV block, RV infarct |
| LCx | Lateral wall | ST↑ I, aVL, V5-V6 | Often ECG-silent |
| LMCA | Massive LV | ST↑ widespread / aVR | Cardiogenic shock, death |
Why the Subendocardium is Most Vulnerable
- Furthest from epicardial supply arteries
- Myocardial contraction compresses inner-layer vessels during systole
- Most dependent on diastolic perfusion
- First to become ischemic when CPP drops
10. Summary at a Glance
AORTA
├── LMCA (left coronary sinus)
│ ├── LAD (anterior IVS groove → apex)
│ │ ├── Diagonal branches → anterolateral LV
│ │ └── Septal perforators → IVS, bundle branches
│ └── LCx (left AV groove)
│ ├── Obtuse marginals (1-3) → lateral LV
│ ├── SA node artery (45%)
│ └── PDA if left dominant (8-15%)
│
└── RCA (right coronary sinus → right AV groove)
├── Acute marginal artery → RV lateral wall
├── SA node artery (55%)
├── AV node artery → AV node, Bundle of His
├── PDA (right dominant, 85%) → inferior IVS + inferior LV
└── Right posterolateral artery → posterior LV
Ppt on ambulatory Anaesthesia from millers for a seminar