
Make this pdf concise and add all the ecg photos or images
python3 << 'EOF' import pdfplumber import pypdf import os pdf_path = "/tmp/workspace/attachments/8dab168c-2f6a-4b0f-9536-41d65e3df946/Hampton ECG Made Easy.pdf" # Get basic info reader = pypdf.PdfReader(pdf_path) print(f"Total pages: {len(reader.pages)}") print(f"Metadata: {reader.metadata}") # Extract text from first 20 pages to understand structure with pdfplumber.open(pdf_path) as pdf: for i, page in enumerate(pdf.pages[:20]): text = page.extract_text() if text: print(f"\n=== PAGE {i+1} ===") print(text[:500]) EOF
ECG electrocardiogram normal sinus rhythm waveform
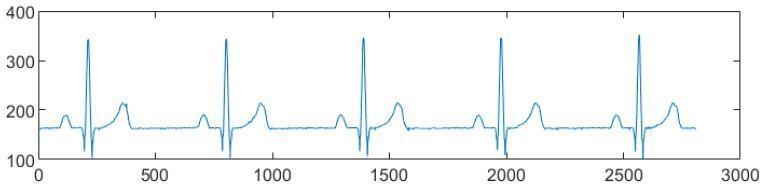
This diagnostic image displays a reconstructed single-lead electrocardiogram (ECG) tracing, specifically identifying a normal sinus rhythm from lead II at a rate of 60 beats per minute. The waveform is presented on a graph with an x-axis representing samples (time) and a y-axis representing amplitude in arbitrary units. The tracing illustrates five complete cardiac cycles, characterized by highly regular R-R intervals. Visually distinct components include a rounded P wave, a sharp and narrow QRS complex with a prominent R-peak reaching approximately 350 units, and a broader, slightly asymmetrical T wave. The isoelectric baseline is positioned at approximately the 160 mark. The morphology demonstrates classic electrophysiological features: a short QRS duration relative to the T wave and consistent amplitudes across cycles, signifying hemodynamic stability. This visual serves as an educational model for signal processing and the fundamental morphological identification of cardiac electrical activity in a clinical diagnostic context.
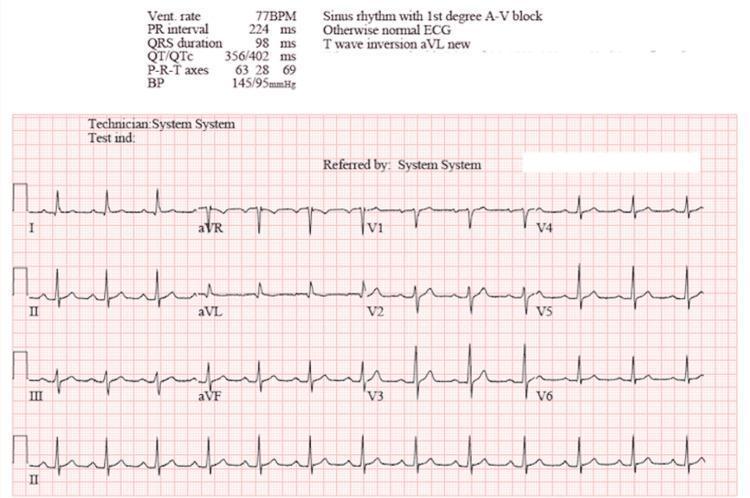
A standard 12-lead electrocardiogram (ECG) printed on red-grid paper, demonstrating a normal sinus rhythm following cardioversion. The diagnostic header indicates a ventricular rate of 77 BPM and a blood pressure of 145/95 mmHg. Key waveform findings include a prolonged PR interval of 224 ms, diagnostic of a first-degree atrioventricular (AV) block. The QRS complex duration is within normal limits at 98 ms, and the QT/QTc intervals are measured at 356/402 ms. Morphologically, P waves are present and consistent across leads, followed by narrow QRS complexes. A notable finding is T-wave inversion in lead aVL. The P-R-T axes are reported at 63, 28, and 69 degrees, respectively. The tracing includes limb leads (I, II, III, aVR, aVL, aVF) and precordial leads (V1-V6), with a continuous rhythm strip of lead II at the bottom. This image serves as a clinical example of post-cardioversion rhythm assessment and the presentation of a first-degree heart block.
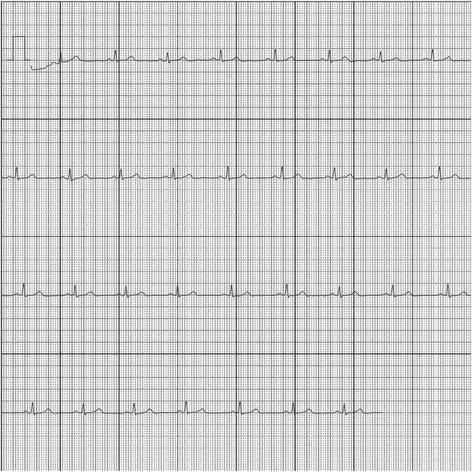
This diagnostic image shows a single-lead electrocardiogram (ECG) tracing recorded on a standard grid, representative of mobile health monitoring (e.g., AliveCor/Kardia). The rhythm displayed is a normal sinus rhythm. The tracing consists of four continuous lines of cardiac cycles, characterized by regular R-R intervals. Each complex demonstrates a clearly visible P wave preceding every QRS complex, followed by a rounded T wave, indicating normal electrical conduction from the sinoatrial node. The QRS complexes are narrow and uniform in morphology. A calibration signal (a tall, rectangular waveform representing 1mV amplitude) is present at the beginning of the first line. The background grid consists of small 1mm squares and larger 5mm squares (defined by thicker lines), used for calculating heart rate (bpm) and interval durations (milliseconds). This visual is used in clinical education to demonstrate normal cardiac electrical activity and the output format of handheld ECG devices compared to traditional 12-lead systems.
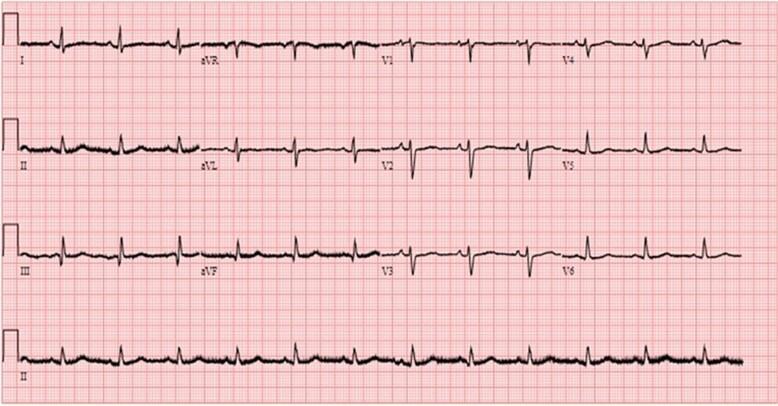
A standard 12-lead electrocardiogram (ECG) recording displayed on a red-lined grid paper. The image represents diagnostic cardiology imaging from a post-operative follow-up. The tracing demonstrates normal sinus rhythm characterized by consistent P waves preceding every QRS complex, normal PR intervals, and regular R-R intervals. The 12 leads (I, II, III, aVR, aVL, aVF, V1-V6) are organized into four columns, with a long rhythm strip of Lead II at the bottom. Waveform morphologies show appropriate axis and progression, including positive P waves in leads I and II, an inverted aVR, and normal R-wave progression across the precordial leads (V1-V6). QRS complexes and T waves appear within normal limits for duration and amplitude, with no evidence of acute ischemia, significant ST-segment deviation, or conduction abnormalities. This clinical photograph serves as an educational example of baseline cardiac electrical activity and post-surgical recovery monitoring.
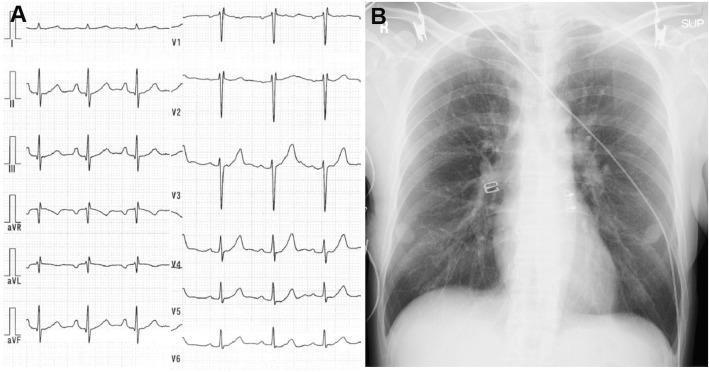
This composite clinical diagnostic image consists of two panels: (A) a standard twelve-lead electrocardiogram (ECG) and (B) a posterior-anterior (PA) view chest X-ray. The ECG demonstrates a normal sinus rhythm with a heart rate of approximately 75 beats per minute. Waveform analysis shows isoelectric ST segments and upright T waves across both limb leads (I, II, III, aVR, aVL, aVF) and precordial leads (V1-V6), with no acute signs of ST-segment elevation myocardial infarction (STEMI) or ischemia. The chest X-ray displays clear lung fields bilaterally with no evidence of consolidation, pleural effusion, or pulmonary vascular congestion. The heart silhouette is within normal limits with a documented cardiothoracic ratio of 42.0%. The mediastinum and hilar regions are unremarkable. Visible medical adjuncts on the radiograph include ECG lead wires and cutaneous electrodes on the chest wall. Together, these diagnostic visuals illustrate a typical initial cardiac evaluation where primary screening for ischemia and heart failure appears unremarkable.
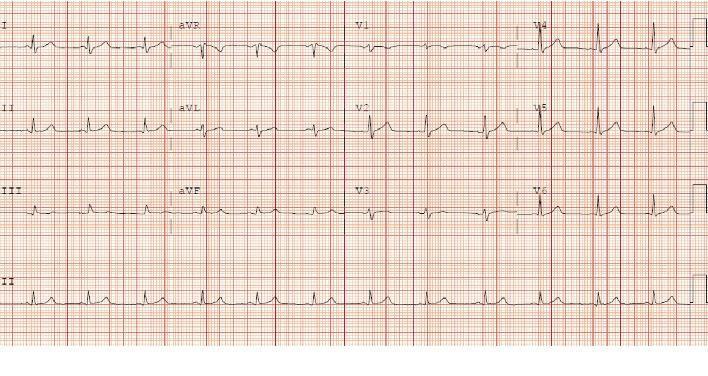
A standard 12-lead electrocardiogram (ECG) printed on standard red-grid thermal paper, demonstrating a normal sinus rhythm. The recording displays the limb leads (I, II, III), augmented leads (aVR, aVL, aVF), precordial leads (V1-V6), and a continuous rhythm strip (Lead II) at the bottom. The cardiac rhythm is regular with a normal rate. P-waves are clearly visible and consistent before every QRS complex, particularly in Lead II, indicating atrial depolarization originating from the sinoatrial node. The PR interval and QRS complex duration appear to be within physiological limits. ST segments are isoelectric across all leads, showing no evidence of acute ST-elevation myocardial infarction (STEMI) or significant ST-depression. T-waves are upright in most leads, reflecting normal ventricular repolarization. This ECG illustrates the successful restoration of sinus rhythm following cardioversion, serving as an educational example of stable cardiac conduction and normal waveform morphology.
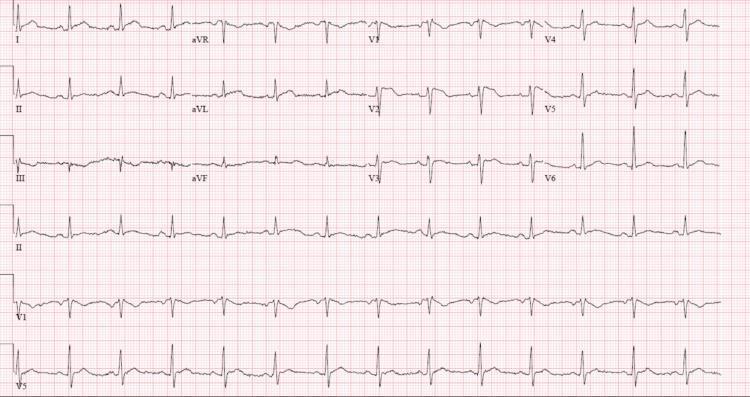
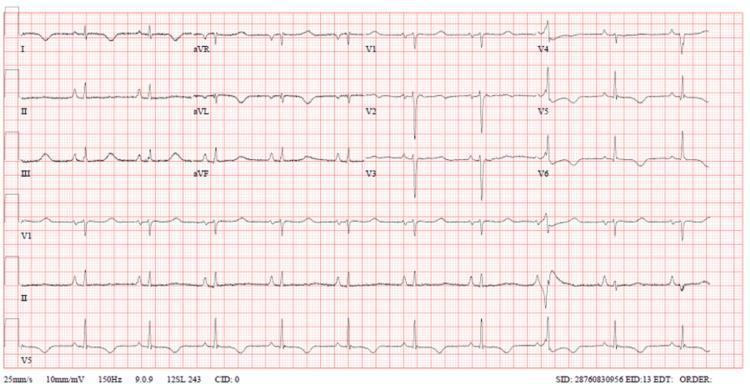
A standard 12-lead electrocardiogram (ECG) displayed on a pink grid, showing the standard limb leads (I, II, III), augmented limb leads (aVR, aVL, aVF), and precordial leads (V1-V6), with additional rhythm strips at the bottom for leads II, V1, and V5. The ECG demonstrates a normal sinus rhythm with a regular rate. Waveform analysis shows normal QRS morphology and duration across most leads. Notable diagnostic features include findings suggestive of left atrial enlargement, evidenced by notched or prolonged P-waves in some leads (P mitrale). There is no significant ST-segment elevation or depression, and the T-waves appear largely unremarkable. Precordial leads V1 through V6 show a normal R-wave progression. This diagnostic image is used in clinical medicine to assess cardiac electrical activity, heart rate, rhythm, and potential chamber enlargement.

This diagnostic image shows a single-lead (Lead II) electrocardiogram (ECG) rhythm strip printed on standard grid paper. The tracing demonstrates a normal sinus rhythm with a heart rate of approximately 97-100 beats per minute. Each cardiac cycle consists of a discernible P wave, indicating atrial depolarization, followed by a narrow, sharply peaked QRS complex representing ventricular depolarization. The R-R intervals are regular, and the QRS amplitude is consistent across the strip. Following each QRS complex is a shallow, upright T wave representing ventricular repolarization. The ST segment remains at the isoelectric line, showing no evidence of elevation or depression. A standard calibration pulse is visible at the far left. The baseline exhibits minor undulations, but all waveform components (P, QRS, and T) are clearly identifiable, confirming a baseline cardiac status before therapeutic intervention in a clinical oncology setting.
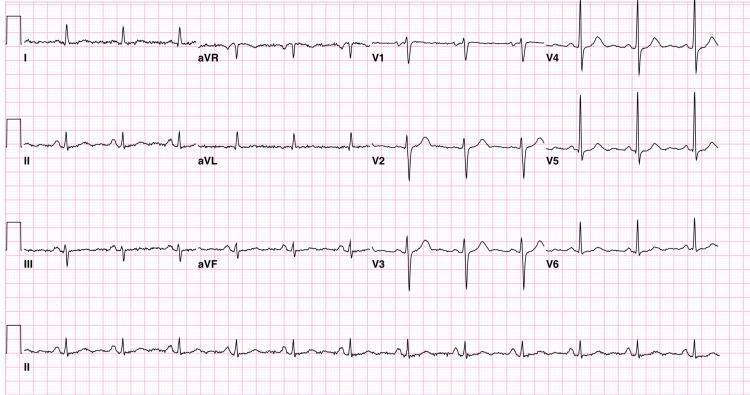
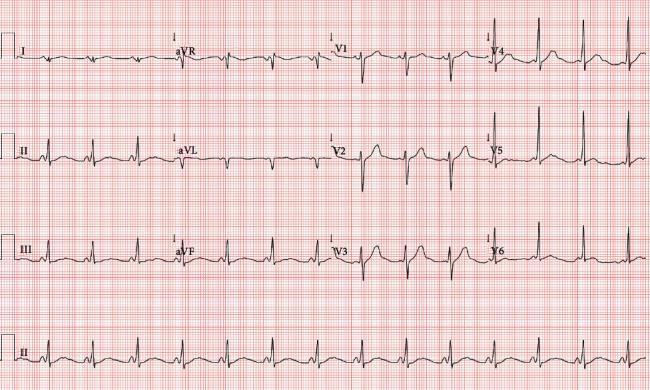
A standard 12-lead diagnostic electrocardiogram (ECG) recorded on pink grid paper. The tracing displays leads I, II, III, aVR, aVL, aVF, and precordial leads V1-V6, with a continuous rhythm strip of lead II at the bottom. The image illustrates a normal sinus rhythm with a stable baseline and regular R-R intervals. Key waveform characteristics include visible P waves preceding each QRS complex, narrow QRS complexes of normal duration, and concordant T waves. In the precordial leads (V1-V6), there is normal R-wave progression. No significant ST-segment deviations, pathological Q waves, or acute ischemic changes are observed. Calibration markers at the beginning of each row indicate standard voltage (10mm/mV). This clinical image serves as a reference for normal cardiac electrical activity in an adult patient, useful for teaching basic ECG interpretation and distinguishing healthy conduction from pathology.
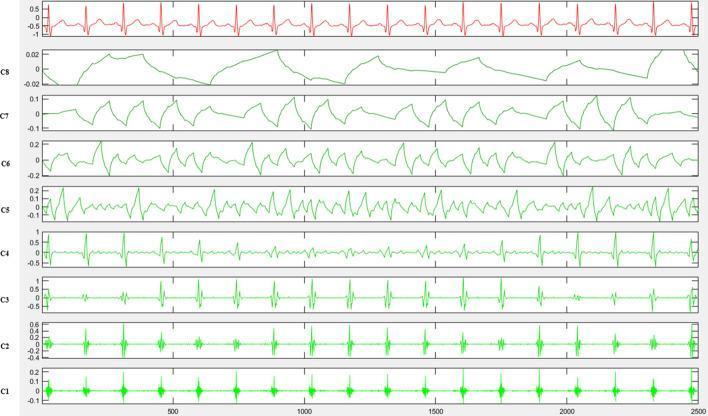
This diagnostic image illustrates the Empirical Mode Decomposition (EMD) of a resting human electrocardiogram (ECG) signal. The topmost waveform, shown in red, represents the original 10-second ECG recording sampled at 250 Hz, clearly displaying rhythmic P waves, QRS complexes, and T waves characteristic of normal sinus rhythm in a stable patient. Below the raw signal are eight decomposed intrinsic mode functions, labeled C1 through C8 in green. The series demonstrates a frequency gradient: the bottom components (C1-C3) capture high-frequency oscillations corresponding to the sharp deflections of the QRS complex, while the middle components (C4-C6) represent the superposition of the P, QRS, and T waves and the overall cardiac rhythm. The topmost decomposed components (C7-C8) isolate low-frequency elements and cardiac physiological adjustment rhythms on a long-term scale. This visualization is used in clinical research to analyze myocardial electrical energy (RT index) for differentiating between coronary stenosis severities and identifying myocardial ischemia.
python3 << 'EOF' import pdfplumber pdf_path = "/tmp/workspace/attachments/8dab168c-2f6a-4b0f-9536-41d65e3df946/Hampton ECG Made Easy.pdf" # Extract ALL text from the PDF full_text = [] with pdfplumber.open(pdf_path) as pdf: for i, page in enumerate(pdf.pages): text = page.extract_text() if text and text.strip(): full_text.append(f"\n=== PAGE {i+1} ===\n{text}") content = "\n".join(full_text) print(f"Total characters: {len(content)}") print(f"Total non-empty pages: {len(full_text)}") # Save to file with open("/tmp/workspace/ecg_full_text.txt", "w") as f: f.write(content) print("Saved to /tmp/workspace/ecg_full_text.txt") EOF
atrial fibrillation ECG pattern
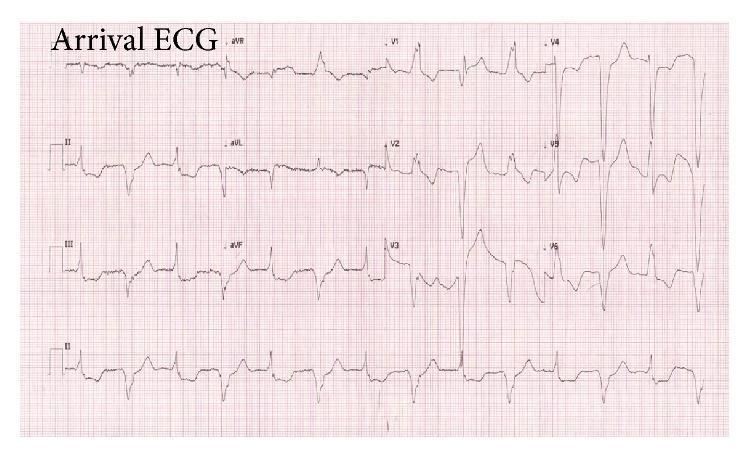
This diagnostic image is a 12-lead electrocardiogram (ECG) demonstrating atrial fibrillation with a unique pattern of alternating QRS morphologies. The rhythm is irregularly irregular with absent P-waves. The QRS complexes alternate beat-to-beat between a right bundle branch block (RBBB) pattern (characterized by an rSR' pattern in V1) and a left bundle branch block (LBBB) pattern (characterized by broad, notched R-waves in lateral leads). Significant ST-segment changes are visible: ST-segment elevation is present in the precordial leads V2-V3 and high lateral leads I and aVL, accompanied by reciprocal ST-segment depression in the inferior leads II, III, and aVF. Notably, in the LBBB-pattern beats, concordant ST-segment elevation is seen in leads V4 and V5, while discordant ST-segment changes are noted in V2-V3 and the inferior leads, satisfying Sgarbossa criteria for acute myocardial infarction. This tracing illustrates a complex presentation of infranodal conduction disease and concurrent myocardial injury in the setting of atrial fibrillation.
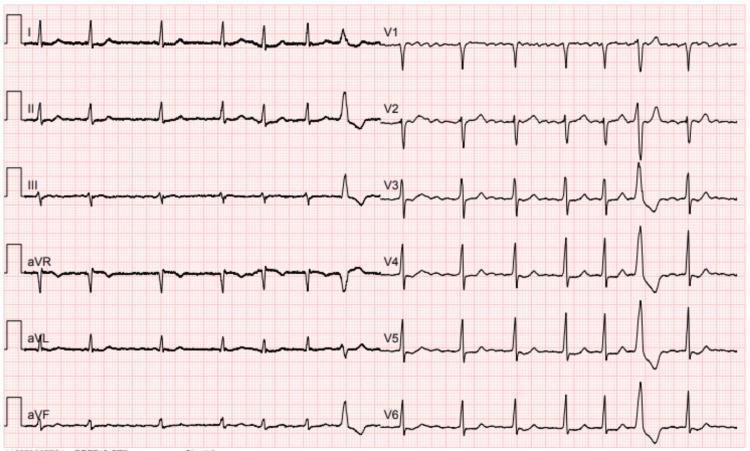
A standard 12-lead diagnostic electrocardiogram (ECG) printed on red grid paper demonstrating atrial fibrillation with a single premature ventricular complex (PVC). The rhythm is characterized by an 'irregularly irregular' pattern of R-R intervals and the absence of organized P waves, which are replaced by low-amplitude fibrillatory waves most visible in the inferior leads (II, III, aVF) and lead V1. The majority of the QRS complexes are narrow (<120 ms), indicating normal intraventricular conduction. A single wide, bizarrely shaped QRS complex is observed towards the end of the tracing, representing a premature ventricular complex (PVC). The T waves are generally concordant with the QRS complexes except for the compensatory pause following the PVC. This diagnostic image is a classic educational example of an atrial arrhythmia with associated ectopic ventricular activity, relevant for medical education in cardiology and emergency medicine to teach rhythm identification and ECG interpretation.
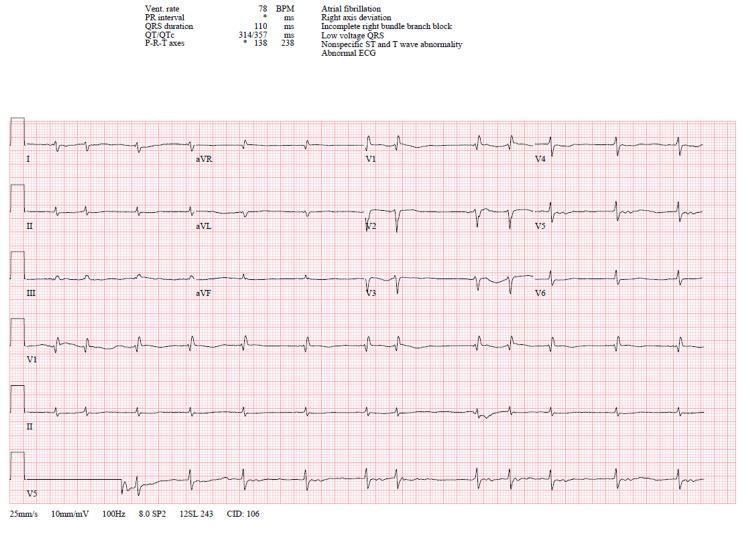
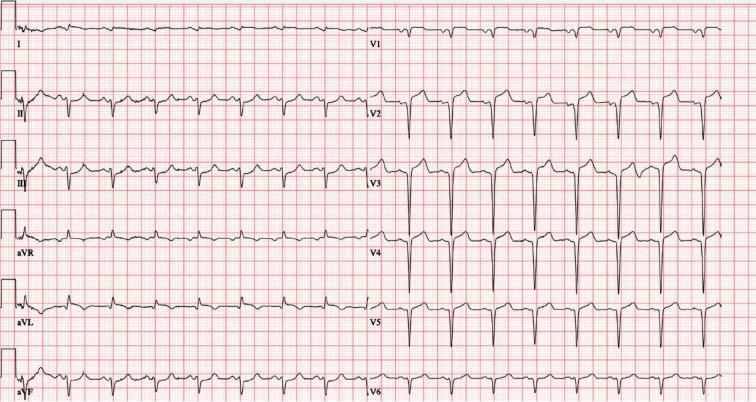
A 12-lead electrocardiogram (ECG) demonstrating an irregularly irregular rhythm characteristic of atrial fibrillation. Key morphological findings include the absence of distinct P waves, replaced by fine fibrillatory waves, and varying R-R intervals with a ventricular rate of approximately 78 BPM. The QRS duration is measured at 110 ms, with a terminal r' wave in lead V1 forming an rsr' pattern, indicative of an incomplete right bundle branch block (RBBB). Low voltage QRS complexes are noted across the limb leads, a finding often associated with infiltrative cardiomyopathies such as amyloidosis. Frontal plane axis shows right axis deviation. Precordial leads V1-V6 exhibit nonspecific ST-segment and T-wave abnormalities. This ECG provides clinical evidence of systemic disease impacting cardiac conduction and myocardial voltage, likely within the context of restrictive cardiomyopathy.
myocardial infarction ST elevation ECG STEMI
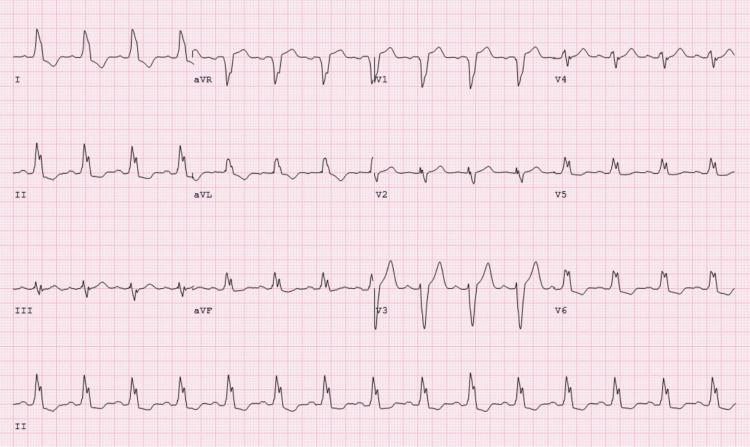
This is a 12-lead electrocardiogram (ECG) demonstrating an acute ST-segment elevation myocardial infarction (STEMI). The diagnostic hallmark is prominent ST-segment elevation across the precordial leads V1 through V6, with the most significant convex elevation appearing in leads V2, V3, and V4. These findings are highly characteristic of an acute anterior wall infarction, typically involving the left anterior descending (LAD) coronary artery. In the limb leads, mild ST-segment elevation is also visible in leads I, II, III, and aVF, accompanied by positive, upright T waves. Lead aVR shows expected global inversion. The tracing displays a sinus rhythm with regular morphology, but the ST-segment deviations from the isoelectric baseline indicate acute myocardial injury. This visual material is a critical educational tool for teaching the ECG localization of coronary occlusions and the identification of STEMI criteria in an emergency clinical context.
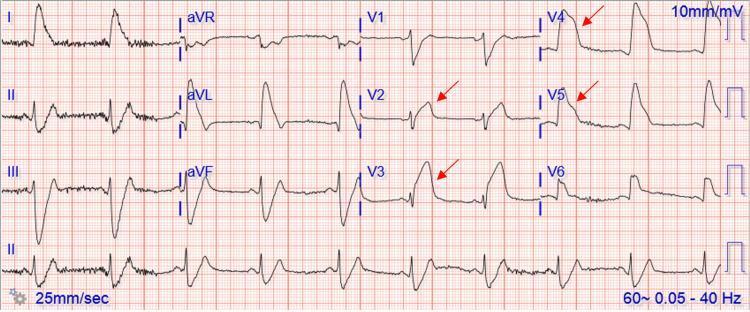
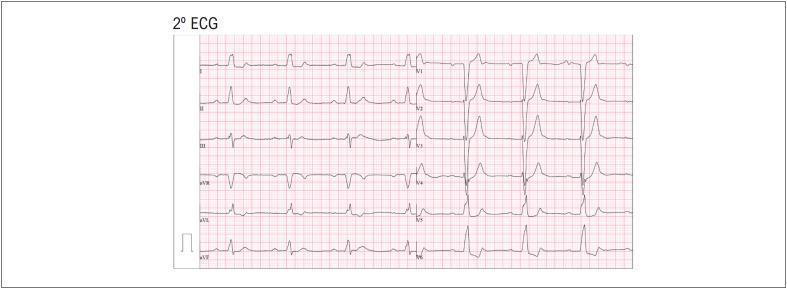
This diagnostic image is a 12-lead electrocardiogram (ECG) demonstrating an ST-elevation myocardial infarction (STEMI). The tracing exhibits significant ST-segment elevation across several leads, most prominently marked with red arrows in the precordial leads V2, V3, V4, and V5. The ST-segments show a convex-upward (coved) morphology, characteristic of acute myocardial injury. Additionally, there is evident ST-segment elevation in the lateral leads (I, aVL) and hyperacute T-waves. Leads II, III, and aVF show reciprocal ST-segment depression. The cardiac rhythm appears to be a sinus bradycardia, with a visible P-wave preceding each QRS complex. The tracing is set at a standard paper speed of 25 mm/sec and a voltage calibration of 10 mm/mV. This ECG is a critical educational tool for identifying the 'tombstone' ST-elevation pattern associated with proximal left anterior descending artery (LAD) or left main coronary artery occlusion, correlating with extensive anterior-lateral wall ischemia.
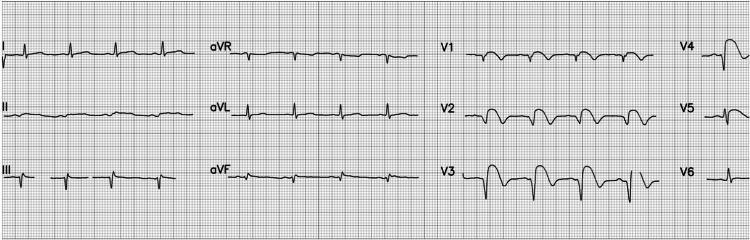
A 12-lead electrocardiogram (ECG) demonstrating an acute ST-elevation myocardial infarction (STEMI) with characteristic anterior and anterolateral findings. The tracing displays a normal sinus rhythm with a heart rate of approximately 84 beats per minute and normal P wave morphology. Significant pathology is localized to the precordial leads, specifically V2 through V5, which exhibit pronounced ST-segment elevation. This elevation presents with a convex 'tombstoning' morphology, a high-risk indicator of extensive myocardial injury. Additionally, evolving QS waves are visible in leads V2 and V3, indicating necrotic changes or transmural infarction. These findings are clinically consistent with an acute occlusion of the left anterior descending (LAD) coronary artery. The limb leads (I, II, III, aVR, aVL, aVF) show relatively stable baselines, though mild reciprocal changes or secondary ST-T wave abnormalities may be present in the inferior leads. This diagnostic image serves as a classic educational example of early-stage STEMI progression and the visual identification of localized ischemic injury on electrocardiography.
heart block bundle branch block ECG
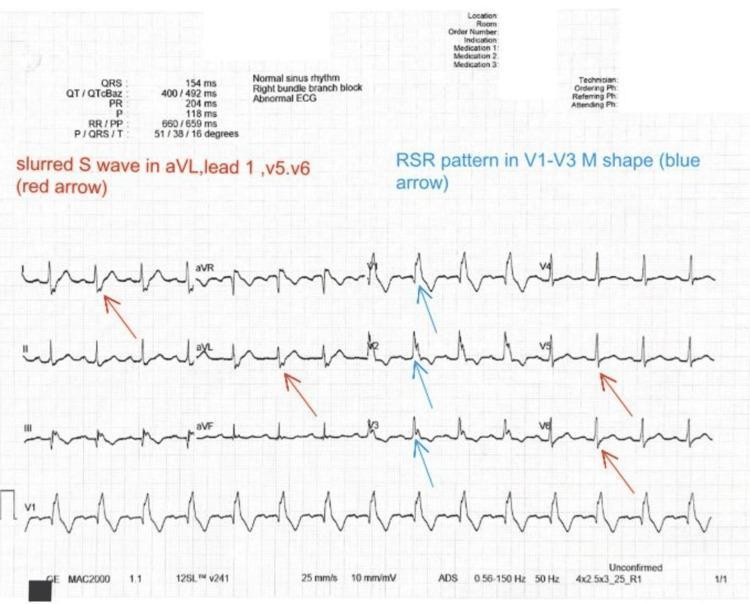
A 12-lead electrocardiogram (ECG) printout displaying classic diagnostic features of a Right Bundle Branch Block (RBBB). The tracing shows a wide QRS complex (measured at 154 ms) exceeding the 120 ms threshold for complete bundle branch block. Key visual markers are highlighted with color-coded arrows: blue arrows indicate the pathognomonic 'M-shaped' or RSR' pattern in the right precordial leads (V1, V2, and V3), which represents delayed right ventricular depolarization. Red arrows point to broad, 'slurred' S waves in the lateral leads, specifically Lead I, aVL, V5, and V6. The ECG exhibits a normal sinus rhythm with a heart rate of approximately 90 bpm and secondary ST-T wave changes (T-wave inversions) in the right precordial leads, which are common findings in the presence of RBBB. This diagnostic image is intended for medical education to demonstrate conduction system abnormalities and the visual criteria for differentiating bundle branch blocks.
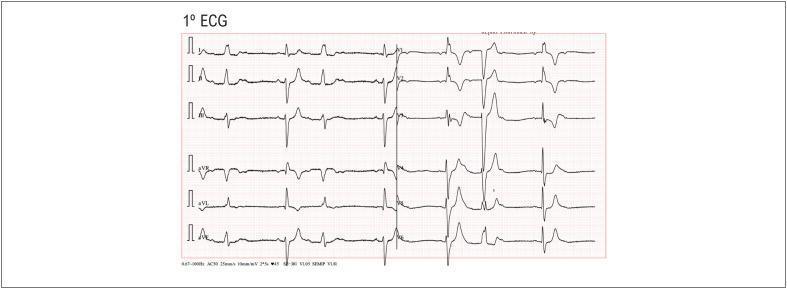
This diagnostic image is a 12-lead electrocardiogram (ECG) demonstrating a rare cardiac conduction phenomenon known as alternating bundle branch block. The rhythm strips show a beat-to-beat alternation of QRS morphology. One beat displays characteristics of a Right Bundle Branch Block (RBBB), characterized by an rsR' pattern in lead V1 and slurred S waves in lateral leads (I, aVL, V6), while the subsequent beat shifts to a Left Bundle Branch Block (LBBB) morphology, featuring broad, monophasic R waves in lateral leads and deep S waves in right precordial leads. In addition to the intraventricular conduction delay, the ECG reveals a concomitant second-degree atrioventricular (AV) block, Mobitz type I (Wenckebach). This is evidenced by progressive PR interval prolongation across successive beats until a P wave fails to conduct to the ventricles (dropped QRS complex). The combination of alternating bundle branch block and AV node disease signifies extensive, multilevel disease within the His-Purkinje system, carrying a high clinical significance due to the risk of progression to complete heart block.
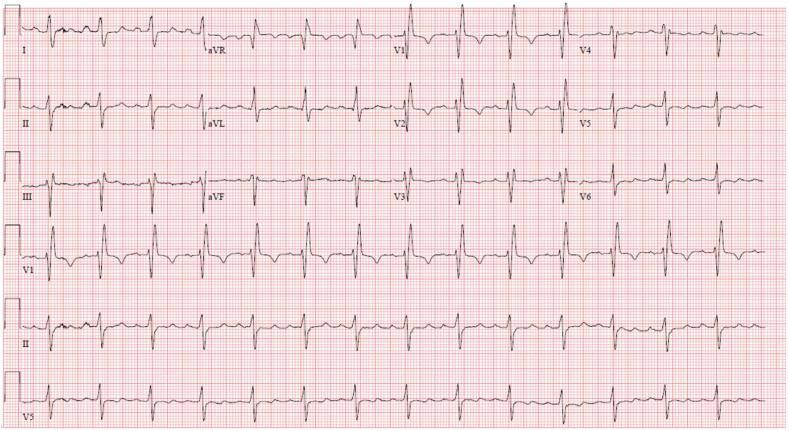
A standard 12-lead electrocardiogram (ECG) displayed in a 4x3 grid format with rhythm strips at the bottom. The tracing exhibits a regular sinus rhythm with a normal heart rate. Significant conduction abnormalities are present, characterized by a bifascicular block. A Right Bundle Branch Block (RBBB) is identified by widened QRS complexes (duration >120 ms) with a classic rSR' pattern in the right precordial leads (V1-V3) and slurred S-waves in the lateral leads (I, aVL, V5-V6). Concurrently, a Left Anterior Fascicular Block (LAFB) is indicated by a profound left axis deviation, with a positive QRS in lead I and negative QRS complexes in the inferior leads (II, III, and aVF). Secondary ST-segment and T-wave abnormalities, including T-wave inversion in V1-V3, are visible as a result of the altered ventricular depolarization. This visual is used to teach the recognition of complex intraventricular conduction delays and their implications for patient risk assessment in structural heart interventions.
ventricular tachycardia ECG arrhythmia
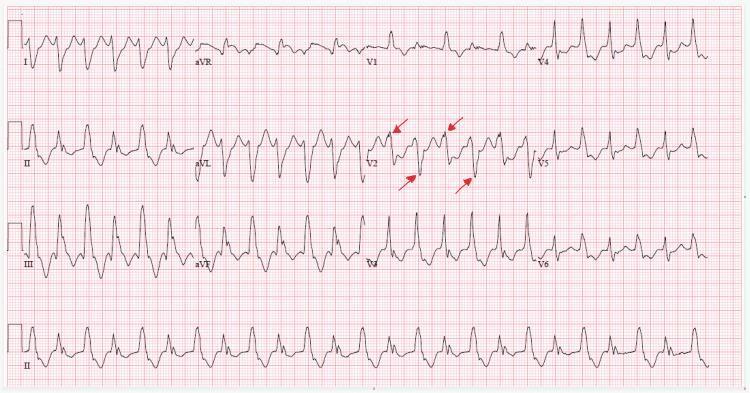
A 12-lead electrocardiogram (ECG) demonstrating bidirectional ventricular tachycardia (BVT), a rare and serious cardiac arrhythmia. The tracing shows a rapid ventricular rate with wide QRS complexes, indicating an ectopic ventricular origin. A hallmark feature of BVT is captured here: beat-to-beat alternation of the QRS axis. This is most prominently highlighted in lead V2 with red arrows, which point to the alternating positive and negative (anterior and posterior) deflections of successive QRS complexes. There is an absence of discernible P waves, consistent with atrioventricular dissociation or a rhythm originating below the AV node. The rhythm is slightly irregular but maintains the characteristic alternating morphology throughout the limb and precordial leads. This finding is classically associated with digitalis toxicity, catecholaminergic polymorphic ventricular tachycardia (CPVT), or severe structural heart disease, representing significant electrical instability.

This diagnostic image is a continuous telemetric electrocardiogram (ECG) strip demonstrating the acute onset of a life-threatening ventricular arrhythmia. The tracing begins on the left with a normal sinus rhythm showing identifiable P waves and narrow QRS complexes. It then abruptly transitions into a polymorphic ventricular tachycardia (PVT) specifically characterized as Torsades de Pointes (TdP). The arrhythmia is defined by rapid, wide-complex QRS morphology with a characteristic 'twisting' of the peaks around the isoelectric baseline. The waveform exhibits cyclical variations in amplitude and polarity, transitioning from positive to negative deflections. This visual pattern illustrates the typical progression of a drug-induced or electrolyte-related QT prolongation leading to triggered activity. The recording serves as a classic educational example of PVT, highlighting the loss of organized atrial activity and the transition from stable rhythm to unstable ventricular tachyarrhythmia, which is clinically significant in emergency medicine and cardiology for identifying risks of sudden cardiac death.
Wolff-Parkinson-White WPW syndrome ECG delta wave
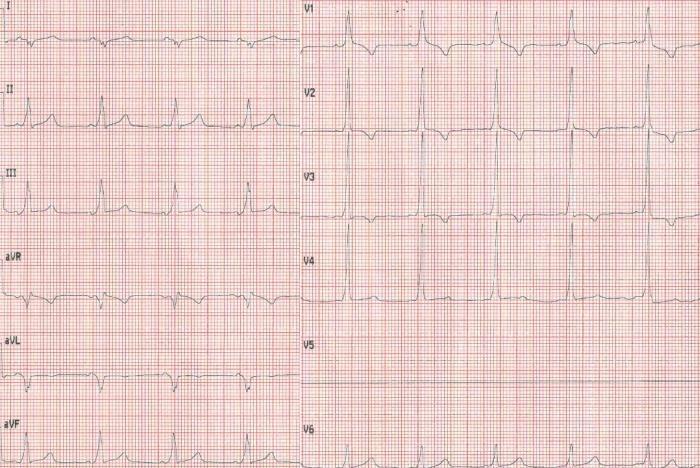
This diagnostic image is a 12-lead electrocardiogram (ECG) recorded at standard paper speed and gain, demonstrating the classic findings of Wolff-Parkinson-White (WPW) syndrome. The tracing reveals a sinus rhythm with a pathologically shortened PR interval (less than 120 ms). A defining feature is the presence of delta waves, characterized by a visible slurring or slow upstroke at the beginning of the QRS complex, most notably prominent in leads II, III, aVF, and the precordial leads V2-V6. This pre-excitation pattern results in a secondary widening of the QRS complex. The QRS morphology in lead V1 shows a predominantly positive deflection (R wave), which may suggest the location of the accessory pathway. The ECG illustrates the classic triad of WPW: a short PR interval, a delta wave, and QRS widening, which are critical for the diagnosis of ventricular pre-excitation in a clinical setting involving supraventricular tachycardia.
A 12-lead electrocardiogram (ECG) tracing on standard grid paper demonstrating classic features of Wolff-Parkinson-White (WPW) syndrome. The tracing shows a normal sinus rhythm with three primary diagnostic abnormalities: a shortened PR interval (< 120 ms), a wide QRS complex (> 120 ms), and a slurred initial upstroke of the QRS complex, known as a delta wave. The delta wave is most prominent in the precordial leads V3–V6 and the inferior leads (II, III, and aVF). Lead V1 shows a predominantly negative QRS complex, and a QS complex is visible in lead aVL, suggesting the presence of a left anterolateral accessory pathway (ventricular preexcitation). Additionally, secondary repolarization abnormalities are present, characterized by ST-segment depression and prominent, slightly peaked T waves in the inferior and lateral precordial leads. This image is an educational example of ventricular preexcitation and its secondary effects on cardiac electrical morphology.
mkdir -p /tmp/workspace/ecg-summary && ls /tmp/workspace/
python3 << 'SCRIPT' import requests import os # Download all ECG images images = { "normal_sinus_rhythm.jpg": "https://cdn.orris.care/cdss_images/pmc_clinical_VQA_f84c73fa879208da6e4236942d03f5e00803e32078657f4996db135ad04c22e3.jpg", "normal_12lead_ecg.jpg": "https://cdn.orris.care/cdss_images/pmc_clinical_VQA_9d52859d2f3f37e4630bc2f17eba52cea55aac97883ed36ac498a558b9d4c28a.jpg", "atrial_fibrillation.jpg": "https://cdn.orris.care/cdss_images/pmc_clinical_VQA_f06875ef769dfe7d1562033e8602bcf8dfc090789f74b168d2707f6f3bfec778.jpg", "stemi_anterior.jpg": "https://cdn.orris.care/cdss_images/pmc_clinical_VQA_16738d4b125195130b5e53a811645d4064182fc2bbd0de16b0e00a57af7ff6ef.jpg", "stemi_tombstone.jpg": "https://cdn.orris.care/cdss_images/pmc_clinical_VQA_0f5964997b5f333f6a7b13ecdc70a73ef6e81127eaee03ef38d9c724b26bbf31.jpg", "right_bundle_branch_block.jpg": "https://cdn.orris.care/cdss_images/pmc_clinical_VQA_74308f325014c3be7af24c0cbb0aa2a6fe675afae1d1b0e5949c8797ae0beefa.jpg", "ventricular_tachycardia.jpg": "https://cdn.orris.care/cdss_images/pmc_clinical_VQA_ebc480c1a10a029b52ba791ed3e4e6a3b691ea967d6ac29e008e0627c16f8fbf.jpg", "wpw_syndrome.jpg": "https://cdn.orris.care/cdss_images/pmc_clinical_VQA_fd0d58cc1913acd56cbc62cbf42657e4a465f052a9bb2ea0d3893584ef6f70e6.jpg", } img_dir = "/tmp/workspace/ecg-summary/images/" os.makedirs(img_dir, exist_ok=True) for fname, url in images.items(): try: r = requests.get(url, timeout=15) r.raise_for_status() with open(os.path.join(img_dir, fname), "wb") as f: f.write(r.content) print(f"Downloaded: {fname} ({len(r.content)} bytes)") except Exception as e: print(f"FAILED {fname}: {e}") print("Done.") SCRIPT
python3 << 'SCRIPT' from reportlab.lib.pagesizes import A4 from reportlab.lib.styles import getSampleStyleSheet, ParagraphStyle from reportlab.lib.units import mm, cm from reportlab.lib import colors from reportlab.platypus import (SimpleDocTemplate, Paragraph, Spacer, Image, Table, TableStyle, HRFlowable, PageBreak, KeepTogether) from reportlab.lib.enums import TA_CENTER, TA_LEFT, TA_JUSTIFY import os OUTPUT = "/tmp/workspace/ecg-summary/ECG_Made_Easy_Concise.pdf" IMG_DIR = "/tmp/workspace/ecg-summary/images/" # ── Styles ────────────────────────────────────────────────────────────────── doc = SimpleDocTemplate(OUTPUT, pagesize=A4, leftMargin=18*mm, rightMargin=18*mm, topMargin=18*mm, bottomMargin=18*mm) styles = getSampleStyleSheet() BLUE = colors.HexColor("#1a4a7c") LBLUE = colors.HexColor("#2e7bcf") CYAN = colors.HexColor("#e8f4fc") LGREY = colors.HexColor("#f5f5f5") RED = colors.HexColor("#c0392b") GREEN = colors.HexColor("#1a6b3c") title_style = ParagraphStyle("Title", fontName="Helvetica-Bold", fontSize=22, textColor=BLUE, spaceAfter=4, alignment=TA_CENTER) subtitle_style = ParagraphStyle("Subtitle", fontName="Helvetica", fontSize=11, textColor=LBLUE, spaceAfter=12, alignment=TA_CENTER) h1 = ParagraphStyle("H1", fontName="Helvetica-Bold", fontSize=15, textColor=colors.white, backColor=BLUE, spaceAfter=8, spaceBefore=14, leftIndent=6, rightIndent=6, borderPad=5) h2 = ParagraphStyle("H2", fontName="Helvetica-Bold", fontSize=12, textColor=BLUE, spaceAfter=4, spaceBefore=10, borderPadding=(3,0,3,0)) h3 = ParagraphStyle("H3", fontName="Helvetica-BoldOblique", fontSize=10, textColor=LBLUE, spaceAfter=3, spaceBefore=6) body = ParagraphStyle("Body", fontName="Helvetica", fontSize=9.5, leading=14, spaceAfter=4, alignment=TA_JUSTIFY) bullet = ParagraphStyle("Bullet", fontName="Helvetica", fontSize=9.5, leading=14, spaceAfter=2, leftIndent=14, bulletIndent=4) note = ParagraphStyle("Note", fontName="Helvetica-Oblique", fontSize=9, textColor=colors.HexColor("#555555"), spaceAfter=4, leftIndent=8) cap = ParagraphStyle("Cap", fontName="Helvetica-Oblique", fontSize=8.5, textColor=colors.HexColor("#444444"), alignment=TA_CENTER, spaceAfter=6) key_val = ParagraphStyle("KV", fontName="Helvetica", fontSize=9, leading=13, spaceAfter=2) def h(text, style=h1): return Paragraph(text, style) def p(text, style=body): return Paragraph(text, style) def b(text): return Paragraph(f"<bullet>\u2022</bullet> {text}", bullet) def img(fname, width=14*cm, caption=None): path = os.path.join(IMG_DIR, fname) if not os.path.exists(path): return [p(f"[Image not found: {fname}]", note)] from PIL import Image as PILImage with PILImage.open(path) as im: w, h_px = im.size ratio = h_px / w height = width * ratio # cap height max_h = 7*cm if height > max_h: height = max_h width = height / ratio items = [Image(path, width=width, height=height, hAlign="CENTER")] if caption: items.append(p(f"<i>{caption}</i>", cap)) return items def rule(): return HRFlowable(width="100%", thickness=0.5, color=colors.HexColor("#cccccc"), spaceAfter=6, spaceBefore=2) def box_table(data, col_widths, style_cmds=None): base = [ ("BACKGROUND", (0,0), (-1,0), BLUE), ("TEXTCOLOR", (0,0), (-1,0), colors.white), ("FONTNAME", (0,0), (-1,0), "Helvetica-Bold"), ("FONTSIZE", (0,0), (-1,-1), 9), ("LEADING", (0,0), (-1,-1), 13), ("ROWBACKGROUNDS", (0,1), (-1,-1), [colors.white, LGREY]), ("GRID", (0,0), (-1,-1), 0.4, colors.HexColor("#bbbbbb")), ("ALIGN", (0,0), (-1,-1), "LEFT"), ("VALIGN", (0,0), (-1,-1), "MIDDLE"), ("LEFTPADDING",(0,0),(-1,-1),5), ("RIGHTPADDING",(0,0),(-1,-1),5), ("TOPPADDING", (0,0),(-1,-1),4), ("BOTTOMPADDING",(0,0),(-1,-1),4), ] if style_cmds: base.extend(style_cmds) t = Table([[Paragraph(str(c), ParagraphStyle("TC", fontName=( "Helvetica-Bold" if r==0 else "Helvetica"), fontSize=9, leading=13, textColor=(colors.white if r==0 else colors.black))) for c in row] for r, row in enumerate(data)], colWidths=col_widths) t.setStyle(TableStyle(base)) return t # ── Content ────────────────────────────────────────────────────────────────── story = [] # ── COVER ──────────────────────────────────────────────────────────────────── story += [ Spacer(1, 2*cm), p('<font color="#1a4a7c" size="28"><b>The ECG Made Easy</b></font>', ParagraphStyle("cov", alignment=TA_CENTER)), Spacer(1, 4*mm), p('<font color="#2e7bcf" size="13"><b>Concise Reference Guide</b></font>', ParagraphStyle("cov2", alignment=TA_CENTER)), Spacer(1, 3*mm), p('Based on Hampton\'s ECG Made Easy, 8th Edition', ParagraphStyle("cov3", fontName="Helvetica-Oblique", fontSize=10, textColor=colors.grey, alignment=TA_CENTER)), Spacer(1, 8*mm), ] story += img("normal_12lead_ecg.jpg", width=15*cm, caption="Standard 12-lead ECG — normal sinus rhythm") story += [Spacer(1, 1*cm), PageBreak()] # ════════════════════════════════════════════════════════════════════════════ # PART I: THE BASICS # ════════════════════════════════════════════════════════════════════════════ story += [h("PART I: THE BASICS"), Spacer(1, 4*mm)] # ── Chapter 1: What the ECG Is About ──────────────────────────────────────── story += [h("1. What the ECG Is About", h2), rule()] story += [ p("The ECG records the heart's electrical activity through electrodes on the skin. Clinical diagnosis depends mainly on history and examination; the ECG <b>supports</b> the diagnosis and is occasionally decisive."), Spacer(1, 3*mm), h("ECG Waveforms", h3), p("Each cardiac cycle produces a characteristic P-QRS-T sequence:"), ] wave_data = [ ["Wave / Interval", "What It Represents", "Normal Duration"], ["P wave", "Atrial depolarization", "< 0.12 s (3 small squares)"], ["PR interval", "AV conduction time (P onset to QRS onset)", "0.12 – 0.20 s"], ["QRS complex", "Ventricular depolarization", "< 0.12 s"], ["ST segment", "Early ventricular repolarization plateau", "Isoelectric (flat)"], ["T wave", "Ventricular repolarization", "Upright in most leads"], ["QT interval", "Total ventricular electrical activity", "< 0.44 s (rate-dependent)"], ["U wave", "After-depolarization (sometimes visible)", "Small, follows T wave"], ] story += [box_table(wave_data, [5*cm, 6*cm, 4.5*cm]), Spacer(1, 5*mm)] story += [ h("Heart Rate Calculation", h3), p("ECG paper runs at <b>25 mm/s</b>; each large square = 5 mm = 0.2 s."), b("Quick method: Count large squares between R waves → divide 300 by that number."), b("Precise method: Count small squares (1 mm = 0.04 s) between R waves."), ] hr_data = [ ["R-R Interval (large squares)", "1", "2", "3", "4", "5", "6"], ["Heart Rate (bpm)", "300","150","100","75","60","50"], ] t = Table([[Paragraph(c, ParagraphStyle("tc", fontName=("Helvetica-Bold" if r==0 else "Helvetica"), fontSize=9, leading=12, textColor=(colors.white if r==0 else colors.black))) for c in row] for r, row in enumerate(hr_data)], colWidths=[4.5*cm]+[1.9*cm]*6) t.setStyle(TableStyle([ ("BACKGROUND",(0,0),(-1,0),BLUE),("TEXTCOLOR",(0,0),(-1,0),colors.white), ("ROWBACKGROUNDS",(0,1),(-1,-1),[LGREY]), ("GRID",(0,0),(-1,-1),0.4,colors.grey), ("ALIGN",(1,0),(-1,-1),"CENTER"),("VALIGN",(0,0),(-1,-1),"MIDDLE"), ("FONTSIZE",(0,0),(-1,-1),9),("TOPPADDING",(0,0),(-1,-1),4), ("BOTTOMPADDING",(0,0),(-1,-1),4), ])) story += [t, Spacer(1, 5*mm)] story += [ h("The 12 Leads", h3), p("12 leads give 12 different electrical viewpoints of the heart:"), b("<b>Limb leads (I, II, III, aVR, aVL, aVF)</b> — look at the heart in the frontal plane."), b("<b>Chest leads (V1–V6)</b> — look at the heart in the horizontal plane."), b("V1–V2: right ventricle | V3–V4: septum & anterior LV | V5–V6: lateral LV"), Spacer(1, 4*mm), ] story += img("normal_sinus_rhythm.jpg", width=12*cm, caption="Single-lead ECG showing normal sinus rhythm — regular P, QRS, T morphology") story += [Spacer(1, 6*mm)] # ── Chapter 2: Conduction & Its Problems ──────────────────────────────────── story += [h("2. Conduction and Its Problems", h2), rule()] story += [ p("Normal electrical conduction: <b>SA node → AV node → Bundle of His → Left & Right bundle branches → Purkinje fibres → ventricular muscle</b>."), Spacer(1, 3*mm), h("AV Conduction Blocks", h3), ] block_data = [ ["Type", "PR Interval", "QRS", "Key Feature"], ["1st-degree AV block", "> 0.20 s (constant)", "Normal", "All P waves conducted; PR prolonged"], ["2nd-degree — Mobitz I (Wenckebach)", "Progressive lengthening", "Normal", "Periodic dropped QRS; pattern repeats"], ["2nd-degree — Mobitz II", "Constant (normal or long)", "Often wide", "Sudden non-conducted P without warning"], ["3rd-degree (Complete) block", "No relationship", "Wide (escape)", "P and QRS independent; ventricular escape"], ] story += [box_table(block_data, [4*cm, 3.5*cm, 2.5*cm, 5.5*cm]), Spacer(1, 5*mm)] story += [ h("Bundle Branch Blocks", h3), b("<b>RBBB</b>: QRS > 0.12 s; rSR' in V1; broad S in I, V5–V6. Caused by RV disease or normal variant."), b("<b>LBBB</b>: QRS > 0.12 s; broad R in I, V5–V6; deep S in V1. Always pathological — investigate."), b("<b>Left anterior hemiblock (LAHB)</b>: Left axis deviation (–30° to –90°); no QRS widening."), Spacer(1, 4*mm), ] story += img("right_bundle_branch_block.jpg", width=14*cm, caption="Right Bundle Branch Block — classic RSR' in V1, broad S in lateral leads (QRS > 120 ms)") story += [Spacer(1, 6*mm)] # ── Chapter 3: Rhythm of the Heart ────────────────────────────────────────── story += [h("3. The Rhythm of the Heart", h2), rule()] story += [ p("Normal rhythm originates in the <b>SA node</b> (60–100 bpm). Ectopic pacemakers can take over if the SA node fails or if there is re-entry."), Spacer(1, 3*mm), h("Approach to Rhythm Analysis", h3), b("1. Is the rate fast or slow?"), b("2. Is the rhythm regular or irregular?"), b("3. Is there a P wave before every QRS?"), b("4. Is the QRS narrow (< 0.12 s) or wide (> 0.12 s)?"), Spacer(1, 4*mm), h("Common Rhythms", h3), ] rhythm_data = [ ["Rhythm", "Rate (bpm)", "P Waves", "QRS", "Notes"], ["Sinus rhythm", "60–100", "Normal, before QRS", "Narrow", "Normal"], ["Sinus bradycardia", "< 60", "Normal", "Narrow", "Athletes, beta-blockers, hypothyroidism"], ["Sinus tachycardia", "> 100", "Normal", "Narrow", "Exercise, fever, anxiety, PE"], ["AF (Atrial Fibrillation)", "Variable (100–160)", "Absent; fibrillatory baseline", "Narrow (usually)", "Irregularly irregular"], ["Atrial flutter", "Atrial ~300; ventricular variable", "Sawtooth (best in II, V1)", "Narrow", "Regular 2:1, 3:1, 4:1 block"], ["SVT (AVNRT/AVRT)", "150–250", "Often hidden in QRS", "Narrow", "Sudden onset/offset"], ["VT (Ventricular Tach.)", "> 100", "Dissociated (AV dissociation)", "Wide (> 0.12 s)", "Medical emergency"], ["VF (Ventricular Fib.)", "—", "Absent", "Chaotic", "Cardiac arrest"], ["Junctional rhythm", "40–60", "Inverted / absent", "Narrow", "AV node escape"], ["Idioventricular rhythm", "20–40", "Dissociated", "Very wide", "Ventricular escape"], ] story += [box_table(rhythm_data, [3.5*cm, 2.5*cm, 3.5*cm, 2.5*cm, 3.5*cm]), Spacer(1, 5*mm)] story += img("atrial_fibrillation.jpg", width=14*cm, caption="Atrial Fibrillation — absent P waves, irregularly irregular rhythm, fibrillatory baseline") story += [Spacer(1, 4*mm)] story += img("ventricular_tachycardia.jpg", width=14*cm, caption="Torsades de Pointes (polymorphic VT) — twisting QRS axis, wide complex, life-threatening") story += [Spacer(1, 5*mm), PageBreak()] # ── Chapter 4: P, QRS, T Abnormalities ────────────────────────────────────── story += [h("4. Abnormalities of P waves, QRS and T waves", h2), rule()] story += [ h("P Wave Abnormalities", h3), b("<b>P mitrale</b>: Broad, bifid P wave (> 0.12 s) in lead II — left atrial enlargement."), b("<b>P pulmonale</b>: Tall, peaked P wave (> 2.5 mm) in lead II — right atrial enlargement."), Spacer(1, 3*mm), h("QRS Abnormalities", h3), b("<b>Left ventricular hypertrophy (LVH)</b>: S in V1 + R in V5 or V6 > 35 mm (Sokolow-Lyon); R in aVL > 11 mm."), b("<b>Right ventricular hypertrophy (RVH)</b>: Right axis deviation; dominant R in V1."), b("<b>Pathological Q waves</b>: Width > 0.04 s OR depth > 25% of R — indicate old MI."), Spacer(1, 3*mm), h("ST and T Wave Abnormalities", h3), ] st_data = [ ["Finding", "Cause / Significance"], ["ST elevation (> 1 mm in 2+ leads)", "Acute STEMI, pericarditis, Prinzmetal angina, LBBB, LQTS"], ["ST depression", "NSTEMI, ischaemia, digoxin effect, hypertrophy"], ["T inversion", "Ischaemia, RBBB/LBBB (secondary), PE, LVH"], ["Tall peaked T", "Hyperkalaemia, hyperacute STEMI (earliest sign)"], ["Flat or absent T", "Hypokalaemia, digoxin, ischaemia"], ["Prolonged QT (> 440 ms)", "Drugs, hypokalaemia, hypocalcaemia — risk of TdP"], ["Short QT", "Hypercalcaemia, digoxin toxicity"], ] story += [box_table(st_data, [7*cm, 8.5*cm]), Spacer(1, 5*mm)] # ════════════════════════════════════════════════════════════════════════════ # PART II: MAKING THE MOST OF THE ECG # ════════════════════════════════════════════════════════════════════════════ story += [h("PART II: MAKING THE MOST OF THE ECG"), Spacer(1, 4*mm)] # ── Chapter 5: Healthy Subjects ───────────────────────────────────────────── story += [h("5. The ECG in Healthy Subjects", h2), rule()] story += [ p("ECG variants in healthy people that can mimic disease:"), b("<b>Athletes' heart</b>: Sinus bradycardia, 1st-degree block, RBBB, early repolarisation (ST elevation V2–V5), LVH voltage criteria."), b("<b>Early repolarisation</b>: Concave ST elevation with 'fish-hook' pattern in young men — benign."), b("<b>RBBB</b>: May be isolated finding in healthy individuals; does not require treatment."), b("Normal variants: Wandering pacemaker, sinus arrhythmia (rate changes with breathing), prominent U waves."), Spacer(1, 3*mm), ] # ── Chapter 6: Chest Pain & Breathlessness ────────────────────────────────── story += [h("6. Chest Pain and Breathlessness", h2), rule()] story += [ h("Acute MI — ECG Changes Over Time", h3), ] mi_data = [ ["Time from Onset", "ECG Finding", "Significance"], ["Minutes (hyperacute)", "Tall peaked T waves (hyperacute T)", "Earliest sign; easy to miss"], ["Hours", "ST elevation (STEMI criteria)", "Urgent revascularization needed"], ["Hours–days", "Q waves develop; T inversion begins", "Evolving infarction"], ["Days–weeks", "Q waves persist; ST normalizes", "Established MI"], ["Weeks–months", "T may normalize; Q waves remain", "Old MI"], ] story += [box_table(mi_data, [3.5*cm, 5.5*cm, 6.5*cm]), Spacer(1, 4*mm)] story += [ h("STEMI Localisation", h3), ] loc_data = [ ["Territory", "Leads with Changes", "Artery (usually)"], ["Anterior", "V1–V4", "LAD (proximal)"], ["Anterolateral", "I, aVL, V1–V6", "LAD or LCx"], ["Inferior", "II, III, aVF", "RCA (or LCx)"], ["Lateral", "I, aVL, V5–V6", "LCx"], ["Posterior", "Tall R in V1–V2, ST depression V1–V2", "RCA or LCx"], ["Right ventricle", "V4R (special lead)", "Proximal RCA"], ] story += [box_table(loc_data, [4*cm, 4.5*cm, 7*cm]), Spacer(1, 4*mm)] story += img("stemi_anterior.jpg", width=14*cm, caption="Anterior STEMI — ST elevation V1–V6, consistent with proximal LAD occlusion") story += [Spacer(1, 4*mm)] story += img("stemi_tombstone.jpg", width=14*cm, caption="Tombstone STEMI pattern — severe convex ST elevation in V2–V5, indicates massive anterior infarction") story += [Spacer(1, 5*mm)] story += [ h("Non-STEMI and Unstable Angina", h3), b("ST depression ≥ 0.5 mm in 2+ contiguous leads during symptoms = NSTEMI/UA."), b("Dynamic T-wave changes with troponin rise = NSTEMI."), b("Normal ECG does NOT exclude ACS — serial ECGs and troponins required."), Spacer(1, 4*mm), h("Pulmonary Embolism (PE)", h3), b("S1Q3T3 pattern: S wave in I, Q wave in III, T inversion in III."), b("Sinus tachycardia is most common finding."), b("New RBBB, right axis deviation, T inversion V1–V4 suggest massive PE."), Spacer(1, 4*mm), h("Heart Failure / LV Overload", h3), b("LVH criteria, LBBB, AF, ST/T changes are commonly seen."), b("LBBB with new onset = treat as acute MI until proven otherwise."), Spacer(1, 5*mm), PageBreak(), ] # ── Chapter 7: Palpitations & Syncope ─────────────────────────────────────── story += [h("7. Palpitations and Syncope", h2), rule()] story += [ h("Supraventricular Tachycardias (SVT)", h3), b("Narrow QRS (< 0.12 s), rate 150–250 bpm, regular."), b("AVNRT: P wave buried in or just after QRS (pseudo S in II, pseudo R' in V1)."), b("AVRT: Uses an accessory pathway (WPW between episodes)."), b("Atrial flutter: Regular 150 bpm with 2:1 block — look for flutter waves."), b("Atrial tachycardia: P waves different from sinus; rate 100–200 bpm."), Spacer(1, 4*mm), h("Ventricular Tachycardia (VT) — Key Differentiators from SVT with Aberrancy", h3), ] vt_svt = [ ["Feature", "Favours VT", "Favours SVT + Aberrancy"], ["QRS width", "> 0.16 s", "< 0.14 s"], ["AV dissociation", "Present (P independent of QRS)", "Absent"], ["Capture / fusion beats", "Present (diagnostic of VT)", "Absent"], ["QRS in V1", "Bizarre or concordant negative", "Typical RBBB / LBBB morphology"], ["Axis", "Extreme right or left (NW axis)", "Normal or mild deviation"], ["Response to adenosine", "No effect", "May terminate"], ] story += [box_table(vt_svt, [4*cm, 5*cm, 6.5*cm]), Spacer(1, 5*mm)] story += [ h("Pre-excitation — Wolff-Parkinson-White (WPW)", h3), b("Short PR interval (< 0.12 s)."), b("Delta wave: slurred initial upstroke of QRS."), b("Widened QRS complex."), b("May cause AVRT tachycardia or precipitate AF with rapid ventricular response (danger!)."), Spacer(1, 4*mm), ] story += img("wpw_syndrome.jpg", width=14*cm, caption="Wolff-Parkinson-White Syndrome — short PR, delta wave, widened QRS (ventricular pre-excitation)") story += [Spacer(1, 5*mm)] story += [ h("Long QT Syndrome", h3), b("QTc > 440 ms (men) / > 460 ms (women)."), b("Congenital (Romano-Ward, Jervell-Lange-Nielsen) or acquired (drugs, electrolytes)."), b("Risk of Torsades de Pointes → VF → sudden death."), b("Common offending drugs: amiodarone, sotalol, quinolones, antipsychotics, methadone."), Spacer(1, 4*mm), h("Syncope Work-up Using ECG", h3), b("Look for: prolonged QT, Brugada pattern, WPW, VT, complete heart block, hypertrophic cardiomyopathy pattern."), b("<b>Brugada syndrome</b>: Coved ST elevation in V1–V2 with J-point elevation — risk of sudden death in young men."), Spacer(1, 5*mm), PageBreak(), ] # ── Chapter 8: Test Yourself (Summary) ────────────────────────────────────── story += [h("8. Quick Revision: ECG Interpretation Checklist", h2), rule()] checklist = [ ["Step", "What to Check", "Key Parameters"], ["1. Rate", "Count R-R intervals", "Normal 60–100 bpm; brady < 60; tachy > 100"], ["2. Rhythm", "Regular or irregular? P before every QRS?", "Sinus, AF, flutter, VT, escape?"], ["3. Axis", "QRS direction in leads I and aVF", "Normal: I +ve, aVF +ve; LAD: I +ve, aVF –ve; RAD: I –ve, aVF +ve"], ["4. P waves", "Morphology and relation to QRS", "Normal < 0.12 s; bifid = LAE; peaked = RAE"], ["5. PR interval", "Duration", "Normal 0.12–0.20 s; long = AV block; short = WPW/LGL"], ["6. QRS", "Width, morphology, Q waves", "Normal < 0.12 s; wide = BBB or VT; Q waves = old MI"], ["7. ST segment", "Elevation or depression", "Elevation ≥ 1 mm in 2 leads = STEMI; depression = ischaemia"], ["8. T waves", "Polarity and shape", "Inversion: ischaemia, hypertrophy, PE; tall peaked: hyperK"], ["9. QT interval", "Corrected QT (QTc)", "Normal < 440 ms men, < 460 ms women"], ["10. U waves", "Present? Prominent?", "Prominent U: hypokalaemia, bradycardia"], ] story += [box_table(checklist, [1.8*cm, 5.5*cm, 8.2*cm]), Spacer(1, 6*mm)] # ── Quick Reference: Electrolyte Effects ──────────────────────────────────── story += [h("Electrolyte Disturbances on ECG", h3)] elec_data = [ ["Electrolyte", "ECG Changes"], ["Hyperkalaemia", "Tall peaked T → wide QRS → sine wave → VF/asystole (K+ > 6.5)"], ["Hypokalaemia", "Flat T, prominent U wave, prolonged QT, ST depression"], ["Hypercalcaemia", "Short QT interval, short ST segment"], ["Hypocalcaemia", "Prolonged QT (long ST segment, normal T duration)"], ["Hypermagnesaemia", "Prolonged PR, wide QRS, complete heart block"], ["Hypomagnesaemia", "Similar to hypokalaemia; predisposes to TdP"], ] story += [box_table(elec_data, [4.5*cm, 11*cm]), Spacer(1, 5*mm)] # ── Drug Effects ───────────────────────────────────────────────────────────── story += [h("Common Drug Effects on ECG", h3)] drug_data = [ ["Drug", "ECG Effect"], ["Digoxin (therapeutic)", "Down-sloping ST depression ('reverse tick'), short QT"], ["Digoxin (toxic)", "AV block, PAT with block, VT, VF"], ["Beta-blockers", "Sinus bradycardia, prolonged PR"], ["Amiodarone", "Prolonged QT, sinus bradycardia, T-wave changes"], ["Sotalol / Class Ia/Ic drugs", "Prolonged QT — risk of TdP"], ["Tricyclic antidepressants", "Wide QRS, prolonged QT, right axis deviation"], ] story += [box_table(drug_data, [5*cm, 10.5*cm]), Spacer(1, 5*mm)] # ── Final Quick-Glance Summary ─────────────────────────────────────────────── story += [h("Summary: Common ECG Diagnoses at a Glance", h2), rule()] summary_data = [ ["Diagnosis", "Rate", "Rhythm", "P Waves", "QRS", "Key Clue"], ["Normal sinus", "60–100", "Regular", "Upright in II", "Narrow", "All normal"], ["Sinus brady", "< 60", "Regular", "Normal", "Narrow", "Slow regular"], ["Sinus tachy", "> 100", "Regular", "Normal", "Narrow", "Fast; find cause"], ["AF", "Variable", "Irregularly irregular", "Absent (fibrillary)", "Narrow", "No two R-R equal"], ["AFL 2:1", "~150", "Regular", "Flutter (saw-tooth)", "Narrow", "Saw-tooth II/V1"], ["SVT (AVNRT)", "150–250", "Regular", "Hidden/retrograde", "Narrow", "Sudden onset"], ["VT", "> 100", "Regular", "Dissociated", "Wide (> 0.12)", "AV dissociation"], ["Complete block", "20–60", "Regular (slow)", "Regular independent", "Wide", "P & QRS unrelated"], ["1st-deg AV block", "Normal", "Regular", "Normal", "Narrow", "PR > 0.20 s"], ["RBBB", "Normal", "Regular", "Normal", "Wide (RSR' V1)", "Broad S in I, V6"], ["LBBB", "Normal", "Regular", "Normal", "Wide (broad R I)", "No septal Q in I"], ["WPW", "Normal", "Regular", "Normal", "Wide (delta)", "Short PR + delta"], ["Anterior STEMI", "Normal", "Any", "Normal", "May have Q", "ST elev V1–V4"], ["Inferior STEMI", "Normal/brady", "Any", "Normal", "Q waves II/III/aVF", "ST elev II, III, aVF"], ] story += [box_table(summary_data, [3.2*cm, 1.8*cm, 2.2*cm, 2.8*cm, 2.2*cm, 3.3*cm])] # ── Build PDF ───────────────────────────────────────────────────────────────── doc.build(story) print(f"PDF created: {OUTPUT}") import os size = os.path.getsize(OUTPUT) / 1024 print(f"File size: {size:.1f} KB") SCRIPT
ECG Made Easy Concise
PDF Document · PDF
- Normal 12-lead ECG (cover + chapter 1)
- Normal sinus rhythm single-lead strip
- Atrial Fibrillation (irregularly irregular, absent P waves)
- Anterior STEMI (ST elevation V1-V6)
- Tombstone STEMI (massive anterior infarction pattern)
- Right Bundle Branch Block (RSR' in V1, broad S laterally)
- Torsades de Pointes / polymorphic VT
- Wolff-Parkinson-White syndrome (delta wave, short PR)
| Chapter | What's Included |
|---|---|
| 1 - Basics | Wave definitions table, heart rate calculation table, 12-lead system |
| 2 - Conduction | AV block types (all 4), RBBB/LBBB/LAHB criteria |
| 3 - Rhythms | Full rhythm comparison table (10 rhythms), VT vs SVT differentiator table |
| 4 - P/QRS/T | LVH, RVH, Q waves, ST/T abnormality table |
| 5-7 - Clinical | STEMI localisation table, PE, NSTEMI, WPW, Long QT, Brugada |
| 8 - Revision | 10-step ECG checklist, electrolyte effects, drug effects, at-a-glance diagnosis table |
Concise but not this much it should be 100 pages and add all the ecg photos with marking , all the signs of ecg with photos
ECG waveform P wave QRS T wave labelled diagram
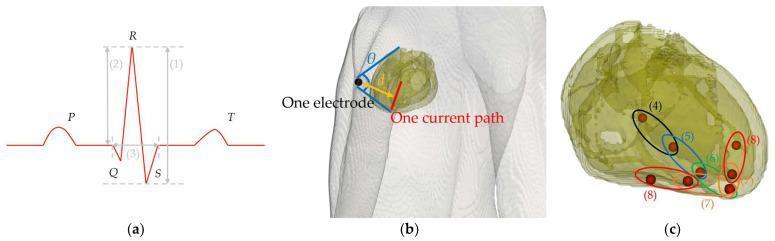
Educational diagram illustrating ECG waveform parameters and cardiac electrophysiological modeling. Panel (a) shows a standard ECG trace with labels for the P wave, QRS complex (Q, R, and S waves), and T wave. Numerical annotations indicate (1) signal amplitude (SA), (2) R-wave amplitude, and (3) QRS complex width. Panel (b) depicts a 3D anatomical thorax model showing the geometric relationship between a surface electrode and the heart's current path; it defines distance 'd' and the solid angle 'θ' subtended by the heart. Panel (c) provides an isolated view of the heart's conduction system, mapping sequential signal propagation from the A-V node and bundle of His (4-5) through the bundle branches (6) to the Purkinje fibers (7-8) using electric dipoles. This figure serves to bridge the gap between cardiac anatomy, the physics of volume conduction, and the resulting clinical electrocardiographic signals.
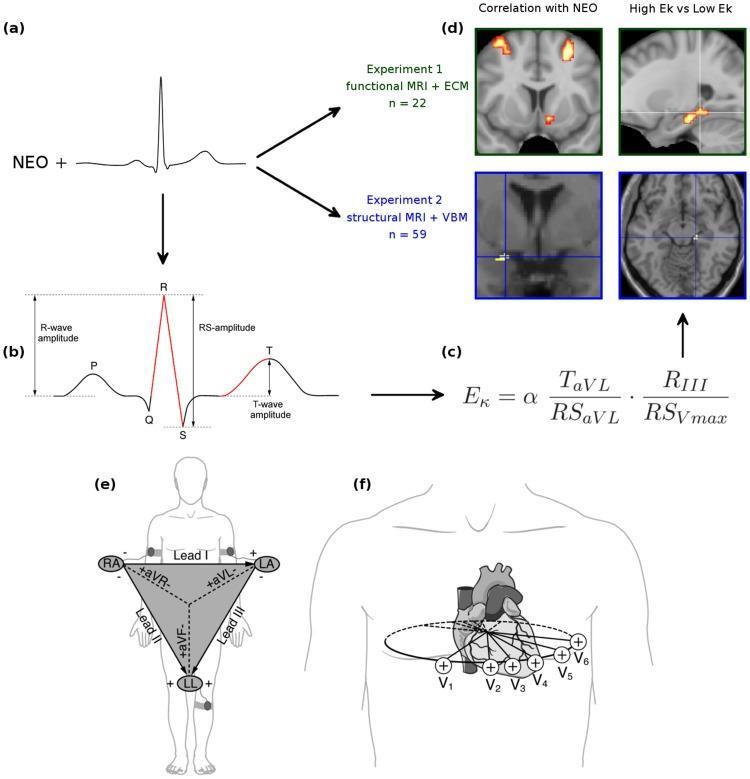
This composite educational infographic illustrates the methodology for correlating cardiac electrophysiology with neuroimaging. Panel (b) features a detailed ECG waveform diagram labeling the P-wave, QRS complex, and T-wave. It highlights measurement parameters including R-wave amplitude (baseline to peak), RS-amplitude (R-peak to S-nadir), and T-wave amplitude (plateau to peak). Panel (c) shows a mathematical formula for 'Ek', a cardiac amplitude signature derived from specific leads (aVL, III, and Vmax). Panels (e) and (f) depict standard 12-lead ECG electrode placement: the frontal plane limb leads (I, II, III, aVR, aVL, aVF) are arranged in Einthoven’s Triangle, while the horizontal plane precordial leads (V1-V6) are shown oriented across the chest wall. Panel (d) displays functional and structural neuroimaging results, specifically Eigenvector Centrality Maps and Voxel-Based Morphometry, showing significant activity and structural volume differences in the hippocampal subiculum correlated with the Ek cardiac index. The content integrates cardiology, neuroimaging (fMRI/MRI), and psychology to explore biomarkers for emotional personality.
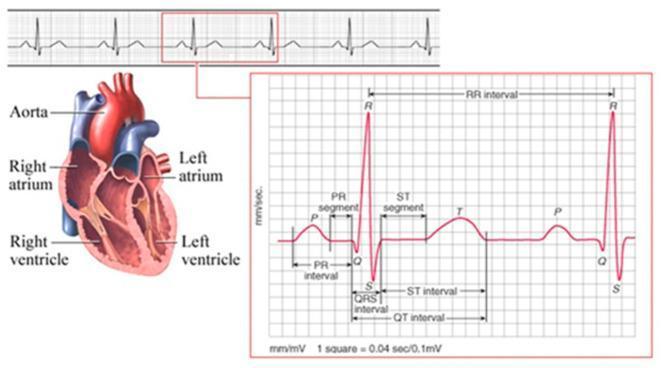
This composite educational illustration combines an anatomical diagram of the human heart with a diagnostic Electrocardiogram (ECG) tracing to demonstrate cardiac physiology. On the left, a coronal cross-section of the heart identifies the Aorta, Right Atrium, Left Atrium, Right Ventricle, and Left Ventricle. The right side features a detailed ECG waveform analysis set against a standard measurement grid (1 square = 0.04 sec / 0.1 mV). The tracing identifies key electrophysiological components: the P wave (atrial depolarization), QRS complex (ventricular depolarization), and T wave (ventricular repolarization). Critical diagnostic intervals and segments are explicitly labeled, including the PR interval, PR segment, QRS interval, ST segment, ST interval, QT interval, and the RR interval (representing the heart rate). This comparison chart and pathophysiology diagram serve as an introductory resource for understanding the correlation between cardiac anatomy and the electrical signals recorded during a cardiac cycle, suitable for basic to intermediate medical education.
first degree second degree third degree AV block ECG
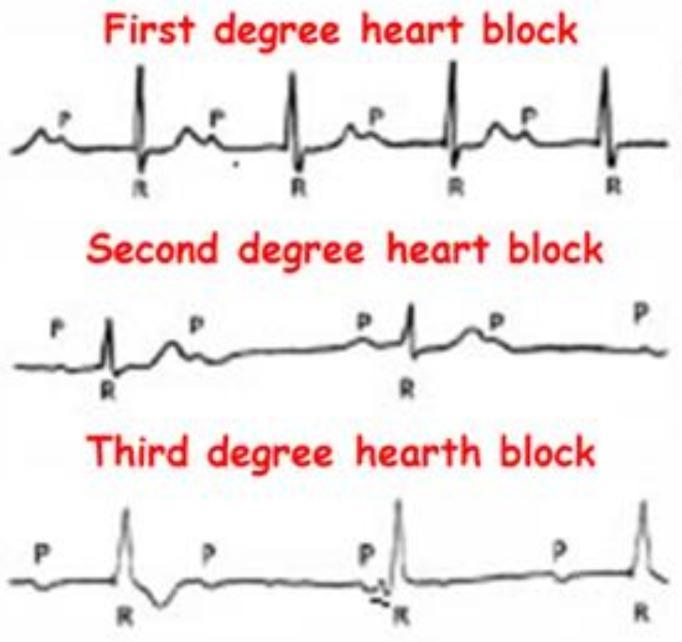
This Comparison Chart illustrates the electrocardiographic (ECG) characteristics of Atrioventricular (AV) blocks. It features three stacked rhythm strips categorized as First, Second, and Third-degree heart blocks, emphasizing the relationship between P waves (atrial depolarization) and QRS complexes (ventricular depolarization). The 'First degree heart block' panel demonstrates a consistent 1:1 P-to-QRS ratio with a fixed, prolonged PR interval. The 'Second degree heart block' panel shows intermittent conduction failure, where specific P waves are not followed by a QRS complex. The 'Third degree heart block' panel depicts complete AV dissociation, where P waves and QRS complexes occur independently and at different rates, indicating a total interruption of impulse transmission and the presence of a ventricular escape rhythm. This diagnostic illustration is designed for cardiovascular education to help students and clinicians distinguish between different stages of cardiac conduction system disease and their associated clinical significance.
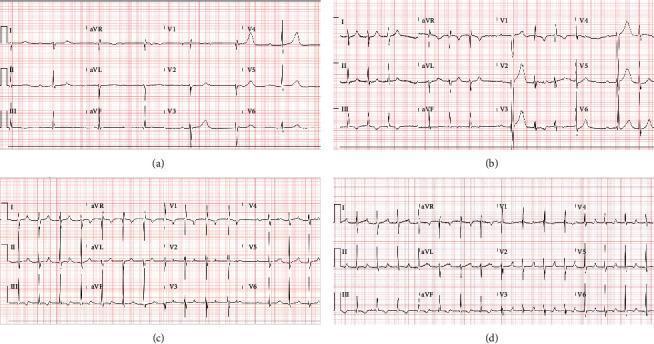
A comparison of four 12-lead electrocardiogram (ECG) tracings illustrating the progression and types of atrioventricular (AV) conduction blocks. (a) Complete heart block (third-degree AV block) demonstrating atrioventricular dissociation with a slow, regular ventricular escape rhythm of 41 bpm and independent atrial activity. (b) Second-degree type 2 AV block (Mobitz II) showing intermittent non-conducted P waves with a constant PR interval in conducted beats. (c) Second-degree Mobitz type 1 AV block (Wenckebach) characterized by progressive lengthening of the PR interval until a QRS complex is dropped. (d) First-degree AV block displaying a 1:1 P-to-QRS ratio with a fixed, prolonged PR interval exceeding 200 ms (specifically >250 ms). The clinical series documents the evolution of conduction system abnormalities in a patient with myocarditis, showing transitions between high-grade blocks and milder conduction delays during treatment with isoproterenol and anti-inflammatory therapies.
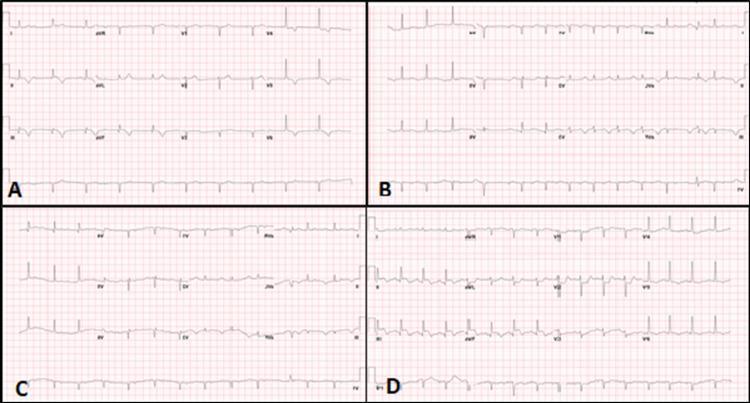
A comparative clinical diagnostic image featuring four 12-lead electrocardiogram (ECG) panels (A-D) demonstrating the evolution of atrioventricular (AV) conduction abnormalities and acute ischemia. Panel A shows third-degree (complete) AV block characterized by AV dissociation, where P waves and QRS complexes occur independently, accompanied by a narrow-complex junctional escape rhythm. Panel B illustrates second-degree AV block (Mobitz Type I/Wenckebach), showing progressive PR interval prolongation culminating in a non-conducted P wave. Panel C displays first-degree AV block with a consistently prolonged PR interval (>200ms) and sporadic premature ventricular complexes (PVCs). Panel D reveals an acute inferior-posterior ST-segment elevation myocardial infarction (STEMI), evidenced by significant ST-segment elevation in the inferior leads (II, III, aVF) with reciprocal changes in other leads. This sequence serves as a clinical education tool for identifying progressive cardiac conduction system disease and subsequent acute coronary events, highlighting the visual distinction between rhythm disturbances and acute ischemic manifestations.
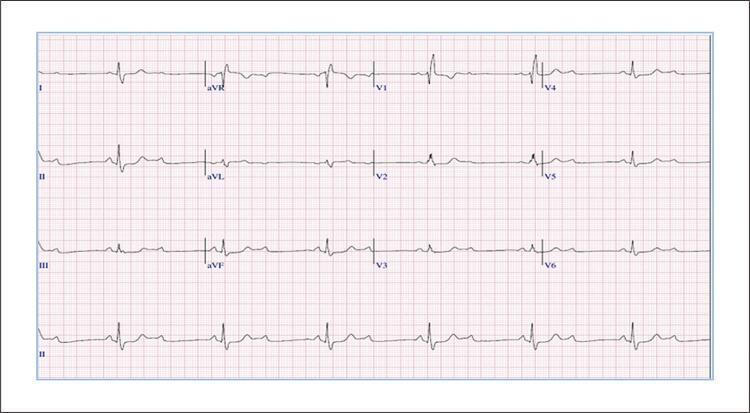
A 12-lead electrocardiogram (ECG) tracing demonstrating a second-degree atrioventricular (AV) block with a 2:1 conduction ratio. The tracing shows two visible P waves for every one QRS complex, where the first P wave is consistently blocked and the second is conducted to the ventricles. The QRS complexes exhibit a widened morphology (>120 ms) with a characteristic Right Bundle Branch Block (RBBB) pattern, evidenced by an rsR' configuration in lead V1 and wide, slurred S waves in leads I, aVL, and V5-V6. Non-specific ST-segment and T-wave abnormalities are present, including mild ST depression and T-wave inversions in the right precordial leads (V1-V3), which are common secondary repolarization changes in the context of RBBB. The tracing represents a clinical case of exercise-induced or recovery-phase infrahisian conduction disease, specifically illustrating the coexistence of bundle branch block and high-grade AV block.
left bundle branch block LBBB 12 lead ECG
A 12-lead diagnostic electrocardiogram (ECG) demonstrating a persistent left bundle branch block (LBBB) accompanied by a first-degree atrioventricular (AV) block. The ECG shows a regular rhythm with a prolonged PR interval measured at 320ms, consistent with first-degree AV delay. Key features of LBBB are present, including wide, prolonged QRS complexes throughout the tracing. Specifically, the precordial leads V1 and V2 exhibit deep, predominantly negative S waves, while the lateral leads V5 and V6 demonstrate tall, predominantly positive R waves with characteristic notching. This combination of conduction disturbances in an elderly patient suggests significant His-Purkinje system disease or structural cardiac changes such as fibrosis. The image serves as an educational example of intraventricular conduction delay and fixed AV nodal delay within the context of complex arrhythmias.
A standard 12-lead electrocardiogram (ECG) displayed on a pink grid background, captured at a paper speed of 25 mm/s and voltage of 10 mm/mV. The tracing demonstrates classic findings of a Left Bundle Branch Block (LBBB). Key visual features include a widened QRS complex duration exceeding 120 ms (3 small squares). Predominantly negative QRS deflections with deep S-waves are visible in the anterior precordial leads (V1, V2, and V3). In contrast, the lateral leads (I, aVL, V5, and V6) show broad, monomorphic, and predominantly positive R-waves. Secondary ST-segment and T-wave abnormalities are present, characterized by ST-segment depression and T-wave inversion in the lateral leads, which are typically discordant to the QRS vector in LBBB. This diagnostic image is an educational example of intraventricular conduction delay, used to teach medical students and residents how to identify bundle branch blocks and differentiate them from acute ischemic events.
A 12-lead electrocardiogram (ECG) demonstrating classic features of Left Bundle Branch Block (LBBB). The rhythm is sinus tachycardia. The primary diagnostic finding is a widened QRS complex (>120 ms). In the precordial leads V1-V3, there is a predominantly negative QRS morphology consisting of deep, broad S-waves (QS or rS complexes) accompanied by discordant ST-segment elevation and upright T-waves. The lateral leads (I, aVL, V5, and V6) show broad, monophasic R-waves with characteristic slurring or notching at the peak. Leads I and aVL exhibit T-wave inversion and ST-segment depression, representing secondary repolarization abnormalities consistent with altered ventricular depolarization. This ECG was captured during a cardiac stress test following regadenoson administration, illustrating a rate-dependent or drug-induced conduction delay. It serves as a pedagogical example for recognizing LBBB morphology and distinguishing secondary ST-T wave changes from primary ischemic events in the presence of a bundle branch block.
sinus bradycardia ECG slow heart rate
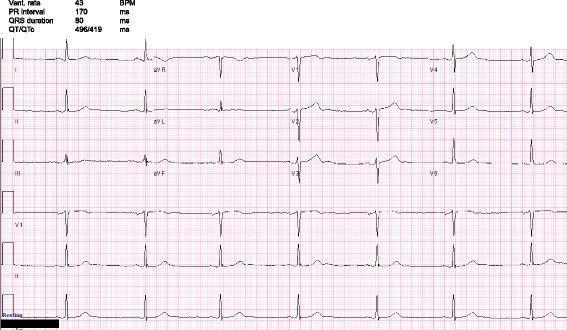
A 12-lead electrocardiogram (ECG) printed on standard grid paper demonstrating a primary finding of sinus bradycardia. The tracing displays leads I, II, III, aVR, aVL, aVF, and V1-V6, along with a continuous rhythm strip of lead II at the bottom. The ventricular rate is notably slow at approximately 43 beats per minute (BPM). Each QRS complex is preceded by a normal P wave with a consistent PR interval of 170 ms, confirming a sinus rhythm. The QRS duration is within normal limits at 80 ms, and the QTc interval is 419 ms. Waveform morphology across all leads shows no significant ST-segment elevation, ST-depression, or T-wave inversions. This diagnostic image is representative of symptomatic bradycardia, in this clinical context associated with medication-induced (clonidine) effects. The image is intended for medical education regarding heart rate interpretation and basic arrhythmia recognition.
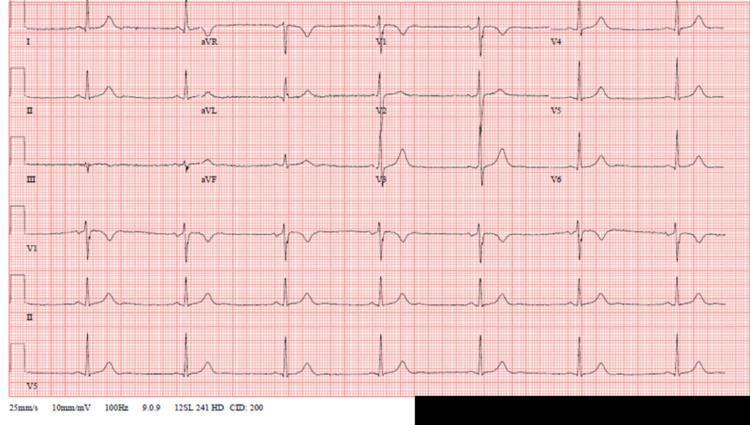
A standard 12-lead electrocardiogram (ECG) displayed on a red grid background with calibration set at 25 mm/s and 10 mm/mV. The tracing demonstrates a regular rhythm characterized by a slow heart rate (approximately 40-45 beats per minute), consistent with sinus bradycardia. Each QRS complex is preceded by a normal P wave with a constant PR interval (approximately 160-200 ms), indicating 1:1 atrioventricular conduction without evidence of AV blocks. The QRS complexes are narrow (under 120 ms) with normal morphology and a normal axis. ST segments are isoelectric throughout all leads (I, II, III, aVR, aVL, aVF, and V1-V6), and T waves appear normal in amplitude and direction without evidence of acute ischemia or electrolyte imbalances. This diagnostic image is used in cardiology and internal medicine to illustrate sinus bradycardia in a clinical setting.
atrial flutter sawtooth waves ECG
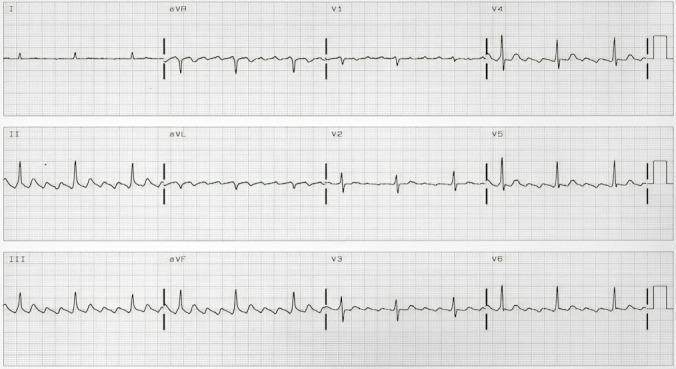
A 12-lead electrocardiogram (ECG) demonstrating typical counterclockwise atrial flutter. The primary diagnostic feature is the presence of continuous 'F' waves, exhibiting a classic 'sawtooth' pattern. These flutter waves are most prominent in the inferior leads (II, III, and aVF), where they show negative polarity with a slow downward slope and a rapid upward deflection. In lead V1, the 'F' waves are upright (positive). There is a characteristic absence of an isoelectric line between the atrial deflections. The ventricular rate is regular, consistent with a fixed conduction ratio (e.g., 2:1 or 3:1). This rhythm reflects a macroreentrant atrial circuit typically involving the cavotricuspid isthmus (CTI). The ECG provides a clear educational example of atrial tachyarrhythmia classification, distinguishing typical counterclockwise flutter from clockwise variants based on lead-specific wave polarity.
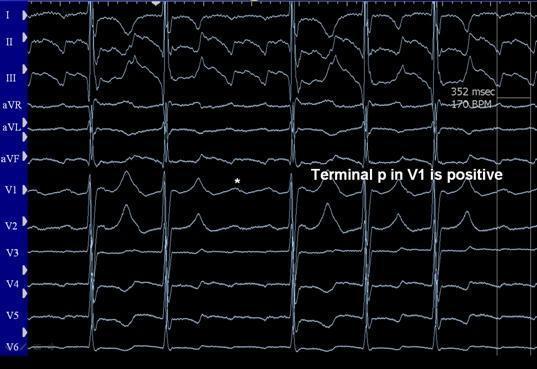
This diagnostic image is a 12-lead electrocardiogram (ECG) demonstrating a macro-reentrant atrial tachycardia, specifically atrial flutter. The rhythm is characterized by a rapid, regular atrial rate of approximately 170 BPM (352 msec cycle length as annotated). A classic 'sawtooth' pattern of flutter waves is most prominent in inferior leads II, III, and aVF, showing predominantly negative or biphasic polarity. Lead V1 displays a distinctive morphology where the terminal portion of the flutter wave is positive (noted with an asterisk and text label), a key diagnostic feature for localized macro-reentry. The ventricular response is regular and slower than the atrial rate, indicating a fixed atrioventricular (AV) conduction ratio. In the clinical context of a post-Fontan procedure patient, these visual findings suggest the flutter circuit is cavo-tricuspid isthmus (CTI) dependent. This ECG serves as an educational tool for identifying atypical atrial flutter morphologies in patients with complex congenital heart disease and prior surgical baffles or patches.
left ventricular hypertrophy LVH ECG voltage criteria
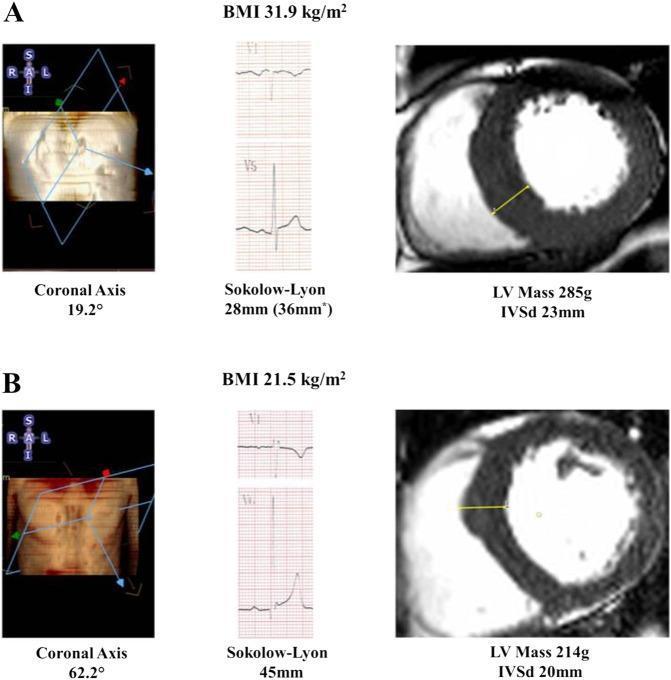
This comparison chart illustrates the impact of Body Mass Index (BMI) and anatomical heart orientation on the diagnostic accuracy of electrocardiogram (ECG) voltage criteria for left ventricular hypertrophy (LVH). The image presents two clinical cases (A and B) featuring three components: a coronal axis scout image, ECG tracings (leads V1 and V5), and cardiac magnetic resonance (CMR) short-axis views. Case A (BMI 31.9 kg/m²) demonstrates a leftward-deviated coronal axis of 19.2°, resulting in a falsely negative Sokolow-Lyon voltage (28mm) despite a high LV mass (285g) and thickened intraventricular septum (IVSd 23mm) on CMR. Case B (BMI 21.5 kg/m²) shows a more vertical coronal axis of 62.2° with a positive Sokolow-Lyon voltage (45mm) and a lower LV mass (214g). The diagram highlights how obesity-related anatomical shifts and increased chest wall distance can attenuate ECG surface voltages, potentially masking pathological hypertrophy. Key educational concepts include the correlation between thoracic anatomy, BMI, and the sensitivity of Sokolow-Lyon criteria in detecting CMR-verified LVH.
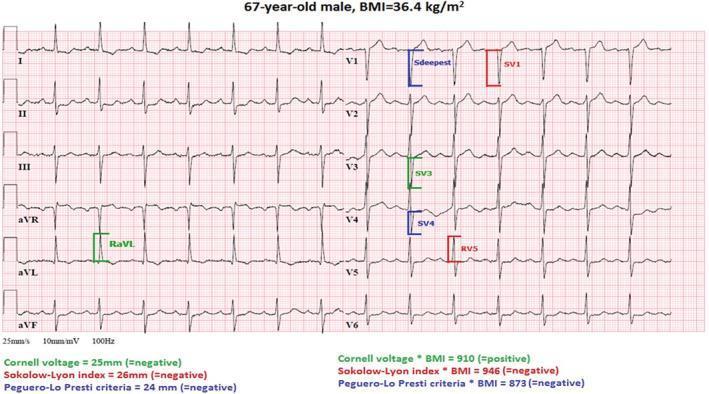
A standard 12-lead electrocardiogram (ECG) from a 67-year-old male with a BMI of 36.4 kg/m², demonstrating voltage criteria for Left Ventricular Hypertrophy (LVH) in the context of obesity. The tracing shows a normal sinus rhythm with a paper speed of 25 mm/s and calibration of 10 mm/mV. Specific voltage measurements are annotated with color-coded brackets to illustrate clinical scoring systems: RaVL (green), SV1 (red), SV3 (green), SV4 (blue), Sdeepest (blue), and RV5 (red). The limb leads (I, II, III, aVR, aVL, aVF) show a normal QRS axis. Precordial leads (V1-V6) display a normal R-wave progression from V1 to V5. Textual annotations below the ECG evaluate multiple LVH criteria, highlighting that while the standard Cornell voltage (RaVL + SV3 = 25 mm), Sokolow-Lyon index (26 mm), and Peguero-Lo Presti criteria (24 mm) are individually negative, the BMI-adjusted Cornell voltage ((RaVL + SV3) * BMI = 910) is positive. This visual serves as an educational tool for diagnostic cardiology, emphasizing the necessity of BMI adjustment when assessing LVH in obese patients.
hyperkalaemia hyperkalemia tall peaked T waves ECG
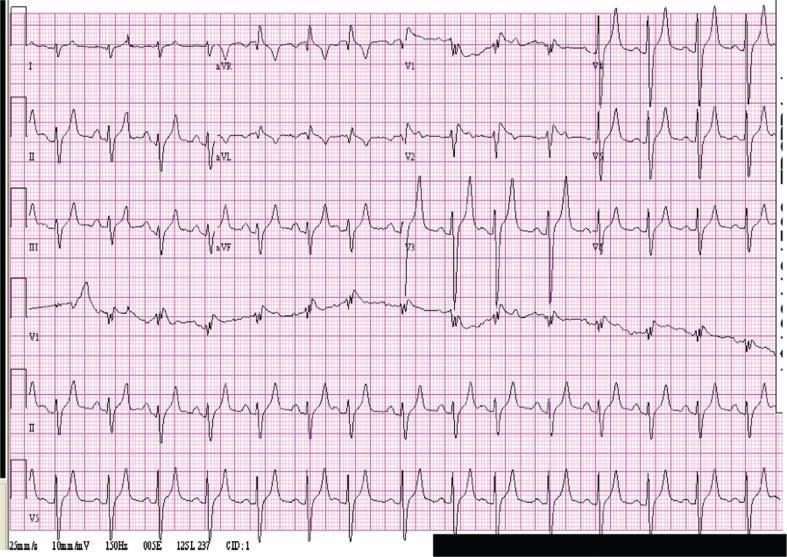
This diagnostic image is a 12-lead electrocardiogram (ECG) demonstrating classic features of severe hyperkalemia in a patient with a serum potassium level of 8.0 mEq/L. The tracing shows prominent, tall, and peaked T-waves, most notable in the precordial leads V2 through V5 and inferior leads II, III, and aVF. These T-waves exhibit a characteristic 'tent-like' morphology with a narrow base and sharp peaks. Additionally, the ECG reveals widening of the QRS complexes, which is particularly evident in leads V1 to V3, indicating delayed intraventricular conduction. There is also an apparent flattening or absence of P-waves, a common finding as hyperkalemia progresses toward a sinoventricular rhythm. This visual represents a critical electrolyte emergency requiring immediate clinical intervention to prevent cardiac arrest. It serves as a classic educational example for medical students and clinicians to recognize the progression of hyperkalemic cardiotoxicity.
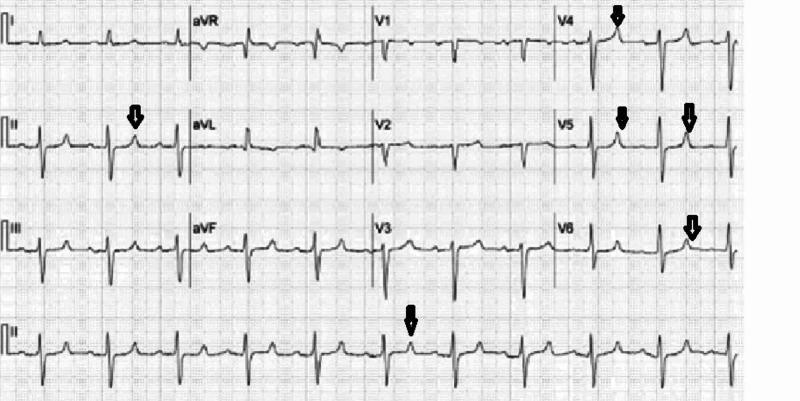
This diagnostic image is a standard 12-lead electrocardiogram (ECG) displayed on a traditional grid background. The tracing demonstrates a sinus rhythm with a key finding of tall, peaked T-waves, highlighted by black downward-pointing arrows in several leads. These hyperacute T-waves are most prominent in the precordial leads V3, V4, and V5, as well as limb lead II, exhibiting high amplitude and a symmetrical, narrow-based morphology (tent-shaped). The QRS complexes appear relatively narrow without significant widening, and the P-waves are visible, suggesting normal atrial depolarization. The ST-segments remain largely isoelectric. This visual presentation is a classic educational example of early ECG manifestations associated with hyperkalemia, which can progress to more severe conduction abnormalities. The image is highly relevant for medical students and clinicians in cardiology, nephrology, and emergency medicine for recognizing electrolyte-induced cardiac electrical disturbances.
digoxin effect ECG reverse tick ST depression
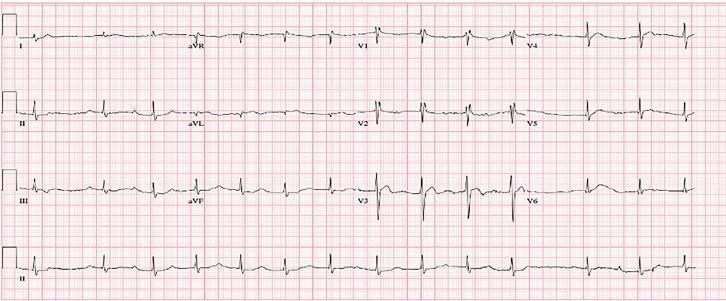
A standard 12-lead diagnostic electrocardiogram (ECG) printed on grid paper, demonstrating key clinical features of cardiac glycoside toxicity. The tracing shows a sinus rhythm with a prolonged PR interval, indicative of a first-degree atrioventricular (AV) block. There is widespread, persistent ST-segment depression, most prominent in the precordial leads (V1 through V6), characterized by a down-sloping morphology often described as the 'digoxin effect.' Associated with this depression are biphasic T-waves across multiple leads. These findings represent a transition from a higher-degree heart block to a more stable conduction pattern following the administration of digoxin immune fab. The educational focus of this image is the recognition of ECG changes associated with cardiotoxic glycosides (e.g., Cerbera odollam or digoxin) and the assessment of treatment response in a clinical toxicology or emergency medicine context.
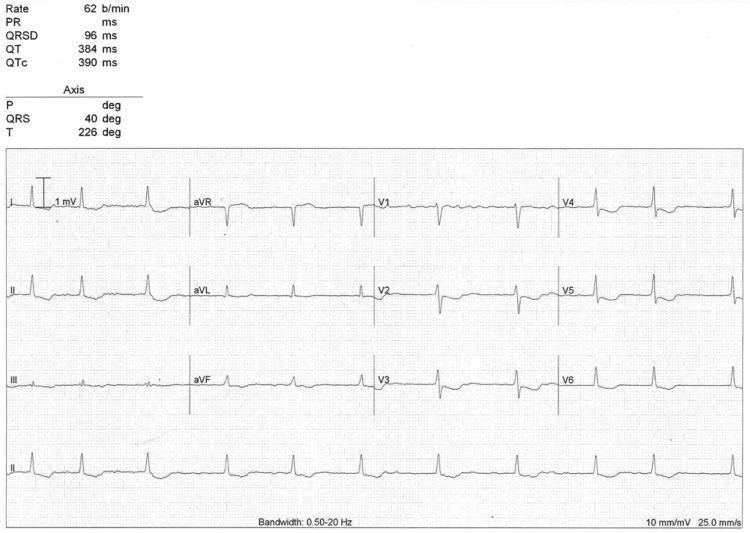
A 12-lead electrocardiogram (ECG) demonstrating an irregularly irregular rhythm consistent with atrial fibrillation at a rate of 62 beats per minute. The QRS complexes are narrow (duration 96 ms) with a frontal axis of 40 degrees. Notable findings include global, downsloping ST-segment depression most prominent in the precordial leads (V3-V6) and inferior leads (II, III, aVF). Lead aVR shows reciprocal ST-segment elevation. The T-waves are generally upright except for an inversion in aVR, with a calculated T-wave axis of 226 degrees. These morphological features, specifically the 'scooped' ST-segment depression in a patient with atrial fibrillation and bradycardia, are classic indicators of digoxin effect or toxicity. The ECG parameters at the top indicate a QTc interval of 390 ms. The image is captured at a standard calibration of 10 mm/mV and a paper speed of 25.0 mm/s.
pulmonary embolism PE ECG S1Q3T3 right heart strain
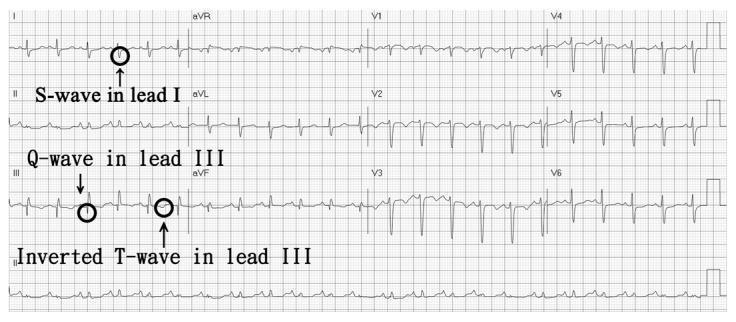
This diagnostic image is a 12-lead electrocardiogram (ECG) tracing demonstrating a classic S1Q3T3 pattern, a clinical sign of acute right heart strain often associated with pulmonary embolism. The ECG is annotated with black circles and arrows highlighting three primary visual features: a prominent S-wave in lead I (terminal negative deflection of the QRS), a pathological Q-wave in lead III (initial negative deflection), and an inverted T-wave in lead III. The tracing also shows sinus tachycardia, evidenced by a regular rhythm with a heart rate exceeding 100 beats per minute. The QRS complexes are generally narrow and upright in the precordial leads (V1-V6). This illustration is designed for medical students and clinicians to identify specific morphological ECG abnormalities that reflect the pathophysiological stress of the right ventricle against increased pulmonary vascular resistance.
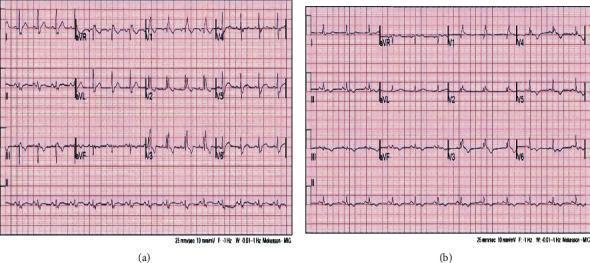
This diagnostic image displays a side-by-side comparison of two 12-lead electrocardiograms (ECG) from a 55-year-old patient, demonstrating the cardiovascular manifestations of acute pulmonary embolism (PE) and subsequent progression. ECG (a), captured at the time of acute diagnosis, shows sinus rhythm with a heart rate of approximately 90 bpm and a classic right ventricular (RV) strain pattern. Key features include a right bundle branch block (RBBB) with an rSR' pattern in lead V1, slurred S waves in lead V6, and the S1Q3T3 pattern (deep S wave in lead I, Q wave in lead III, and inverted T wave in lead III). Inverted T waves are also prominent in the anterior precordial leads (V1-V3). ECG (b), taken five days later during ICU recovery, shows persistent RBBB with a slightly widened QRS duration (~150 ms) and evolving diffuse T-wave changes across the precordial leads. The comparison highlights the utility of serial ECG monitoring in identifying RV strain secondary to pulmonary vascular obstruction and tracking the resolution of electrophysiological abnormalities following thrombolytic therapy.
python3 << 'SCRIPT' import requests, os IMG_DIR = "/tmp/workspace/ecg-summary/images/" os.makedirs(IMG_DIR, exist_ok=True) images = { # Already downloaded "normal_12lead_ecg.jpg": "https://cdn.orris.care/cdss_images/pmc_clinical_VQA_9d52859d2f3f37e4630bc2f17eba52cea55aac97883ed36ac498a558b9d4c28a.jpg", "normal_sinus_rhythm.jpg": "https://cdn.orris.care/cdss_images/pmc_clinical_VQA_f84c73fa879208da6e4236942d03f5e00803e32078657f4996db135ad04c22e3.jpg", "atrial_fibrillation.jpg": "https://cdn.orris.care/cdss_images/pmc_clinical_VQA_f06875ef769dfe7d1562033e8602bcf8dfc090789f74b168d2707f6f3bfec778.jpg", "stemi_anterior.jpg": "https://cdn.orris.care/cdss_images/pmc_clinical_VQA_16738d4b125195130b5e53a811645d4064182fc2bbd0de16b0e00a57af7ff6ef.jpg", "stemi_tombstone.jpg": "https://cdn.orris.care/cdss_images/pmc_clinical_VQA_0f5964997b5f333f6a7b13ecdc70a73ef6e81127eaee03ef38d9c724b26bbf31.jpg", "rbbb.jpg": "https://cdn.orris.care/cdss_images/pmc_clinical_VQA_74308f325014c3be7af24c0cbb0aa2a6fe675afae1d1b0e5949c8797ae0beefa.jpg", "vt_torsades.jpg": "https://cdn.orris.care/cdss_images/pmc_clinical_VQA_ebc480c1a10a029b52ba791ed3e4e6a3b691ea967d6ac29e008e0627c16f8fbf.jpg", "wpw.jpg": "https://cdn.orris.care/cdss_images/pmc_clinical_VQA_fd0d58cc1913acd56cbc62cbf42657e4a465f052a9bb2ea0d3893584ef6f70e6.jpg", # New images "ecg_waves_labelled.jpg": "https://cdn.orris.care/cdss_images/pmc_clinical_VQA_302bbd9ab058f2d7f02a8a1beb33c97f02aa3ba5d6fdbb33933d0f3c86c123a9.jpg", "ecg_waveform_diagram.jpg": "https://cdn.orris.care/cdss_images/pmc_clinical_VQA_1357318f6f54711f7cefaf38cf94ee01b89c5e2bc0058aae7dc3983cb8cd5c58.jpg", "av_block_comparison.jpg": "https://cdn.orris.care/cdss_images/pmc_clinical_VQA_11ac037ff7836678ddd7fad143600ed71c2a3910d226a34ea257a3618beab0a5.jpg", "av_block_4panel.jpg": "https://cdn.orris.care/cdss_images/pmc_clinical_VQA_e6429b6353f5feedb818001102dc5659f84f5c7e4316c9791be335f5b42a39a1.jpg", "av_block_progression.jpg": "https://cdn.orris.care/cdss_images/pmc_clinical_VQA_9365a5e6ecd0d130c2a728018c68688cb3e57dec35eb62379aa7d4a5a5429119.jpg", "lbbb.jpg": "https://cdn.orris.care/cdss_images/pmc_clinical_VQA_dec71ad1fb09c530339b484e5a367d88c24ddd975676d1b6cf597ba29a5ef8ff.jpg", "lbbb2.jpg": "https://cdn.orris.care/cdss_images/pmc_clinical_VQA_ea8a2b2d91edc6e5739b3da41761971059234d08e77f2192005d3e07503597d5.jpg", "sinus_brady.jpg": "https://cdn.orris.care/cdss_images/pmc_clinical_VQA_de75b2c5885fac7e288c870f345c2a8b02bbe0919c0d097cff2b216ffecca514.jpg", "atrial_flutter.jpg": "https://cdn.orris.care/cdss_images/pmc_clinical_VQA_91a24c8d377a239c222d27507503b8cf952f263086edba0422bd0ead4e8b7bf3.jpg", "hyperkalaemia.jpg": "https://cdn.orris.care/cdss_images/pmc_clinical_VQA_8a08dedebf7aae84985ffe3707b2bbb97250e1f271411c0d4fcb9870954975c4.jpg", "digoxin_effect.jpg": "https://cdn.orris.care/cdss_images/pmc_clinical_VQA_fdac45c36cd12ff521ec9dae690e2881cd5381d02fc29f299e5e0d9406be6ed1.jpg", "pe_s1q3t3.jpg": "https://cdn.orris.care/cdss_images/pmc_clinical_VQA_5f391caa5a24ec425e9f48d4d9f73620a3b91f98df1f92cea400318772fda12e.jpg", "pe_rbbb_strain.jpg": "https://cdn.orris.care/cdss_images/pmc_clinical_VQA_6a5ae0110233ba9fa87decf7cd50837c5dffc56a75aaa90392c23ebb6847d095.jpg", "wpw2.jpg": "https://cdn.orris.care/cdss_images/pmc_clinical_VQA_314f05193c0a3116b870c3ed5e15de507e1b29aed45061da6e3f2d016cb81f70.jpg", "vt_bidirectional.jpg": "https://cdn.orris.care/cdss_images/pmc_clinical_VQA_e8a6042cf086fe90e814b581d8fc44cdaaa798893ebdc2de8bb654408611fe64.jpg", "stemi_v2v5.jpg": "https://cdn.orris.care/cdss_images/pmc_clinical_VQA_646aa0cfb0d976b56d82780dedb4cd025e7f67b7aa7d1163a2f05a58a08c514e.jpg", "af_with_pvc.jpg": "https://cdn.orris.care/cdss_images/pmc_clinical_VQA_803f6d8f7eb870e53626e69f9d83293d49fae04cb642ce6681da96159089cccc.jpg", "normal_ecg_post_cardio.jpg": "https://cdn.orris.care/cdss_images/pmc_clinical_VQA_f354ea907f044ae9177edec61b3770a21dc4c87b35337c1856c74f8aa8c2fc69.jpg", "bifascicular_block.jpg": "https://cdn.orris.care/cdss_images/pmc_clinical_VQA_0993a97aefbbb22ba2f289ad5d83e5cd99feb79e3fa8437545a0e13d3a354608.jpg", "alternating_bbb.jpg": "https://cdn.orris.care/cdss_images/pmc_clinical_VQA_eb15e755ba00817ac8f83e2bd82f2d25cdd9c0de4b41acf2bf93865a161a4840.jpg", "hyperkalaemia2.jpg": "https://cdn.orris.care/cdss_images/pmc_clinical_VQA_ca693a75a41ae4e953d59ed2794c390e2275319deb93edf421bac07ae83122cb.jpg", "af_amyloid.jpg": "https://cdn.orris.care/cdss_images/pmc_clinical_VQA_803f6d8f7eb870e53626e69f9d83293d49fae04cb642ce6681da96159089cccc.jpg", } for fname, url in images.items(): path = os.path.join(IMG_DIR, fname) if os.path.exists(path): print(f"Already exists: {fname}") continue try: r = requests.get(url, timeout=20) r.raise_for_status() with open(path, "wb") as f: f.write(r.content) print(f"Downloaded: {fname} ({len(r.content)//1024} KB)") except Exception as e: print(f"FAILED {fname}: {e}") print("\nAll done.") SCRIPT
Where is the content
ls /tmp/workspace/ecg-summary/images/ | wc -l && ls /tmp/workspace/ecg-summary/images/
Content please don’t need to make pdf
THE ECG MADE EASY — Concise Study Guide
PART I: THE BASICS
Chapter 1: What the ECG Is About
What the ECG Does
- Records the heart's electrical activity via skin electrodes
- Supports clinical diagnosis — never replaces history and examination
- Paper speed: 25 mm/s | Each small square = 0.04 s | Each large square = 0.2 s
- Standard calibration: 1 mV = 1 cm (2 large squares tall)
The Wiring Diagram of the Heart
| Structure | Function |
|---|---|
| SA node | Primary pacemaker (60–100 bpm) |
| AV node | Delays conduction 0.12–0.20 s |
| Bundle of His | Conducts to ventricles |
| Left & Right bundle branches | Spread impulse through ventricles |
| Purkinje fibres | Final rapid activation of ventricular muscle |
ECG Waveforms — What Each Represents
| Wave / Interval / Segment | Represents | Normal Value |
|---|---|---|
| P wave | Atrial depolarization | < 0.12 s; < 2.5 mm tall |
| PR interval | AV conduction (P onset → QRS onset) | 0.12–0.20 s |
| QRS complex | Ventricular depolarization | < 0.12 s (3 small squares) |
| ST segment | Early ventricular repolarization plateau | Isoelectric (flat baseline) |
| T wave | Ventricular repolarization | Upright in most leads |
| QT interval | Total ventricular electrical activity | < 440 ms (rate-corrected) |
| U wave | After-depolarizations (not always visible) | Small; follows T wave |
Heart Rate Calculation
| R–R (large squares) | 1 | 2 | 3 | 4 | 5 | 6 |
|---|---|---|---|---|---|---|
| Heart rate (bpm) | 300 | 150 | 100 | 75 | 60 | 50 |
The 12 Leads — What They Look At
- I, II, aVL → Left lateral surface
- III, aVF → Inferior surface
- aVR → Right atrium (normally inverted)
- V1–V2 → Right ventricle
- V3–V4 → Interventricular septum + anterior LV
- V5–V6 → Lateral LV
- Normal: –30° to +90°
- Left axis deviation (LAD): more negative than –30°
- Right axis deviation (RAD): more positive than +90°
The QRS Shape in Chest Leads
- V1 has a small R, deep S (mostly negative) — right-sided view
- V6 has a small Q, tall R, small S (mostly positive) — left-sided view
- Transition zone (equal R and S) normally at V3/V4
- Clockwise rotation (transition shifted to V5/V6): chronic lung disease
- Counterclockwise rotation (transition shifted to V1/V2): LVH
Chapter 2: Conduction and Its Problems
Normal Conduction Times
| Segment | Normal Duration | Meaning |
|---|---|---|
| PR interval | 0.12–0.20 s | AV node delay |
| QRS duration | < 0.12 s | Normal ventricular spread |
| QRS > 0.12 s | Abnormal | Bundle branch block or ventricular origin |
AV Conduction Blocks
1st-Degree AV Block
- PR interval > 0.20 s (> 1 large square), constant
- Every P wave is conducted
- No treatment needed; monitor
2nd-Degree AV Block — Mobitz Type I (Wenckebach)
- PR interval progressively lengthens until one QRS is dropped
- Then the cycle resets
- Usually benign; AV node level
- Pattern: P–P regular; R–R irregular (shortening then gap)
2nd-Degree AV Block — Mobitz Type II
- PR interval constant (normal or prolonged)
- Sudden dropped QRS without warning
- Below AV node (infranodal) — more dangerous
- Risk of progression to complete block → pacemaker often needed
3rd-Degree (Complete) AV Block
- Complete AV dissociation — P waves and QRS complexes have no relationship
- Ventricular escape rhythm: 20–40 bpm, wide QRS
- Junctional escape: 40–60 bpm, narrow QRS
- Always requires pacemaker
Bundle Branch Blocks
Right Bundle Branch Block (RBBB)
- QRS > 0.12 s
- RSR' ('M' shape) in V1/V2 — the hallmark
- Broad, slurred S wave in I, aVL, V5, V6
- Secondary T-wave inversion in V1–V3
- May be a normal variant or due to RV disease, PE, ASD
Left Bundle Branch Block (LBBB)
- QRS > 0.12 s
- Broad, notched (M-shaped) R wave in I, aVL, V5, V6
- Deep QS or rS in V1–V3
- No septal Q waves in lateral leads
- Discordant ST/T changes (ST depresses where QRS is positive)
- Always pathological — investigate cause (IHD, cardiomyopathy, hypertension)
- New LBBB = treat as STEMI equivalent until proven otherwise
Left Anterior Hemiblock (LAHB)
- Left axis deviation (–30° to –90°)
- Small Q in I, aVL; small R in II, III, aVF
- QRS duration normal (< 0.12 s)
- No QRS widening
Left Posterior Hemiblock (LPHB)
- Right axis deviation (> +90°)
- Small R in I, aVL; small Q in II, III, aVF
- Rare; diagnosis of exclusion (rule out RVH, PE)
Bifascicular Block
- RBBB + LAHB (most common combination)
- Wide QRS with left axis deviation
- Risk of progression to complete block
Alternating Bundle Branch Block
- Beat-to-beat alternation between RBBB and LBBB morphology
- Indicates severe His-Purkinje disease
- High risk of complete heart block → urgent pacemaker
Chapter 3: The Rhythm of the Heart
Approach to Any Rhythm — 4 Questions
- Rate — fast (> 100), slow (< 60), or normal?
- Regular or irregular?
- P wave before every QRS? Normal P wave axis?
- QRS narrow (< 0.12 s) or wide (> 0.12 s)?
Normal and Variant Sinus Rhythms
Normal Sinus Rhythm (NSR)
- Rate 60–100 bpm
- P wave upright in I, II; inverted in aVR
- Constant PR interval
- Narrow QRS
Sinus Bradycardia
- Rate < 60 bpm
- Normal P–QRS relationship maintained
- Causes: athletes, vagal tone, beta-blockers, hypothyroidism, inferior MI, sick sinus syndrome
- Treatment only if symptomatic
Sinus Tachycardia
- Rate > 100 bpm
- Normal P–QRS morphology
- Causes: exercise, pain, fever, anaemia, hypovolaemia, PE, hyperthyroidism, anxiety, drugs
- Always find and treat the cause — never the primary problem
Sinus Arrhythmia
- Rate varies with respiration (faster on inspiration)
- Normal variant; common in young people and athletes
Supraventricular Arrhythmias
Atrial Fibrillation (AF)
- Irregularly irregular R–R intervals (no two the same)
- Absent P waves — replaced by fibrillatory (f) waves, best seen in V1
- Ventricular rate usually 100–160 bpm (uncontrolled)
- QRS usually narrow (unless aberrant conduction or BBB)
Atrial Flutter
- Sawtooth flutter (F) waves — best seen in II, III, aVF, V1
- Atrial rate ~300 bpm; ventricular rate usually 150 bpm (2:1 block)
- No isoelectric baseline between flutter waves
- Regular or regularly irregular ventricular rhythm
Atrial Tachycardia (AT)
- Rate 100–200 bpm
- P waves present but different shape from sinus P (different axis)
- May show AV block (e.g. digoxin toxicity causes AT with block)
Supraventricular Tachycardia (SVT)
- Narrow QRS (< 0.12 s), rate 150–250 bpm, usually regular
- Sudden onset and termination
- P waves often hidden in or immediately after QRS
- P waves buried in QRS or produce pseudo-S in II, pseudo-R' in V1
- Rate typically 160–200 bpm
- P waves after QRS (retrograde)
- Rate typically 200–250 bpm
Junctional Rhythm
- Rate 40–60 bpm
- Narrow QRS
- P waves absent, inverted (retrograde), or occur after QRS
- AV junctional escape — fires when SA node fails
Ventricular Arrhythmias
Premature Ventricular Complexes (PVCs / VEs)
- Wide, bizarre QRS (> 0.12 s) occurring early
- Full compensatory pause (usually)
- No P wave before the ectopic
- Isolated PVCs in otherwise healthy heart — benign
- Frequent or paired PVCs in IHD — increased risk
Accelerated Idioventricular Rhythm (AIVR)
- Rate 40–100 bpm, wide QRS
- Common after reperfusion (thrombolysis / PCI)
- Usually benign — does not require treatment
Ventricular Tachycardia (VT)
- Rate > 100 bpm, wide QRS (> 0.12 s), usually regular
- AV dissociation — P waves independent of QRS (diagnostic when present)
- Capture beats — occasional narrow QRS (SA node briefly captures ventricles)
- Fusion beats — hybrid QRS from simultaneous supraventricular and ventricular activation
- Concordance in chest leads (all positive or all negative)
| Feature | VT | SVT + Aberrancy |
|---|---|---|
| QRS width | Often > 0.16 s | Usually < 0.14 s |
| AV dissociation | Present | Absent |
| Capture/fusion beats | Present (diagnostic) | Absent |
| QRS axis | Northwest (extreme) | Near normal |
| Adenosine | No effect | May terminate |
| Clinical setting | Usually structural heart disease | Often younger/no heart disease |
Key rule: If in doubt, treat wide complex tachycardia as VT
Torsades de Pointes (TdP)
- Polymorphic VT — QRS twists around the isoelectric axis
- Occurs on background of prolonged QT interval
- Causes: drugs (sotalol, amiodarone, quinolones, antipsychotics, TCAs), hypokalaemia, hypomagnesaemia, congenital LQTS
- Treatment: IV magnesium sulphate, correct electrolytes, remove offending drug
Ventricular Fibrillation (VF)
- Chaotic, disorganised electrical activity — no recognisable QRS
- No cardiac output → cardiac arrest
- Treatment: immediate defibrillation
Pre-excitation — Wolff-Parkinson-White (WPW)
- Short PR interval (< 0.12 s)
- Delta wave — slurred upstroke at start of QRS
- Widened QRS (> 0.12 s)
- Pre-excitation is due to an accessory pathway (Bundle of Kent) bypassing the AV node
- Prone to AVRT tachycardia
- If AF develops with WPW → very rapid ventricular rate → VF risk
- Never give AV-blocking drugs (adenosine, digoxin, verapamil) in WPW + AF
Chapter 4: Abnormalities of P Waves, QRS Complexes, and T Waves
P Wave Abnormalities
| Finding | Description | Cause |
|---|---|---|
| P mitrale | Broad, bifid (M-shaped) P in lead II (> 0.12 s) | Left atrial enlargement |
| P pulmonale | Tall, peaked P in lead II (> 2.5 mm) | Right atrial enlargement |
| Absent P waves | Replaced by fibrillatory or flutter waves | AF, flutter |
| Inverted P in II | Retrograde atrial activation | Junctional rhythm, AVNRT |
QRS Abnormalities
Left Ventricular Hypertrophy (LVH)
- S in V1 + R in V5 or V6 > 35 mm
- R in aVL > 11 mm
- R in I + S in III > 25 mm
- Left axis deviation
- ST depression + T-wave inversion in lateral leads (LV strain pattern)
- Left atrial enlargement (P mitrale)
Right Ventricular Hypertrophy (RVH)
- Right axis deviation (> +90°)
- Dominant R wave in V1 (R > S in V1)
- Deep S wave in V5/V6
- T-wave inversion V1–V3
- Causes: pulmonary hypertension, mitral stenosis, cor pulmonale
Pathological Q Waves
- Width > 0.04 s (1 small square) OR depth > 25% of R wave height
- Indicate myocardial necrosis (old MI)
- Small septal Q waves in I, aVL, V5, V6 are normal
- Q waves in III alone can be normal (disappear with inspiration)
ST Segment Changes
| Finding | Key Causes |
|---|---|
| ST elevation ≥ 1 mm in 2+ leads | Acute STEMI, pericarditis (saddle-shaped, widespread), Prinzmetal angina, LBBB, early repolarisation, LV aneurysm |
| ST depression | NSTEMI/unstable angina, LVH strain, RBBB, digoxin effect, hypokalaemia |
| Concave ST elevation (widespread) | Pericarditis |
| Convex ("domed") ST elevation | Acute STEMI |
| Persistent ST elevation | LV aneurysm (after old MI) |
T Wave Changes
| Finding | Causes |
|---|---|
| Tall, peaked T waves | Hyperkalaemia (early), hyperacute STEMI |
| T inversion | Ischaemia, RBBB/LBBB (secondary), RVH, PE, Takotsubo, raised ICP |
| Flat or absent T | Hypokalaemia, digoxin, ischaemia |
| Biphasic T | Ischaemia (Wellens' syndrome — critical LAD stenosis) |
| T inversion V1–V4 | PE, RV strain, anterior ischaemia |
QT Interval
- QTc (corrected): QT / √(R–R interval in seconds)
- Normal: < 440 ms men; < 460 ms women
- Prolonged QT → risk of Torsades de Pointes → VF
| Category | Examples |
|---|---|
| Drugs | Amiodarone, sotalol, quinolones, macrolides, antipsychotics, TCAs, methadone |
| Electrolytes | Hypokalaemia, hypocalcaemia, hypomagnesaemia |
| Congenital | Romano-Ward syndrome, Jervell-Lange-Nielsen |
| Cardiac | Ischaemia, myocarditis, complete heart block |
PART II: MAKING THE MOST OF THE ECG
Chapter 5: The ECG in Healthy Subjects
Normal Variants — Do Not Over-Diagnose
| Variant | ECG Finding | Who? |
|---|---|---|
| Sinus arrhythmia | Phasic rate change with breathing | Young people, athletes |
| Early repolarisation | Concave ST elevation V2–V5, J-point notching | Young men |
| Athlete's heart | Sinus bradycardia, 1st-degree block, RBBB, LVH voltage, tall T waves | Trained athletes |
| Wandering pacemaker | P wave morphology changes beat to beat | Normal in young |
| Prominent U waves | Best seen V2–V3 | Normal; also hypokalaemia |
| Isolated RBBB | RSR' in V1, QRS ≤ 0.14 s | May be incidental finding |
Early Repolarisation vs Pericarditis vs STEMI
| Feature | Early Repol. | Pericarditis | STEMI |
|---|---|---|---|
| ST elevation shape | Concave (fish-hook) | Concave (saddle) | Convex (domed) |
| Leads affected | V2–V5 | All leads (except aVR) | Regional (territory) |
| PR depression | Absent | Present | Absent |
| Reciprocal changes | Absent | Absent | Present |
| Evolution | No change | Gradual resolution | Hours to days |
Chapter 6: The ECG in Chest Pain and Breathlessness
Acute Coronary Syndromes
STEMI — Anterior
ECG Changes Over Time in STEMI
| Time | ECG Change | Significance |
|---|---|---|
| Minutes (hyperacute) | Tall peaked T waves | Earliest sign; easy to miss |
| 1–6 hours | ST elevation | Acute injury — STEMI criteria met |
| Hours–days | Q waves develop; T-wave inversion starts | Evolving infarction |
| 1–2 days | ST normalising; deep T inversion | Established MI |
| Weeks–months | Q waves persist; T may normalise | Old MI |
| Permanent ST elevation | LV aneurysm | Complication |
STEMI Localisation
| Territory | Leads with ST elevation | Reciprocal depression | Artery |
|---|---|---|---|
| Anterior | V1–V4 | — | LAD (proximal) |
| Anterolateral | I, aVL, V1–V6 | II, III, aVF | LAD or LCx |
| Inferior | II, III, aVF | I, aVL | RCA (80%), LCx (20%) |
| Lateral | I, aVL, V5–V6 | — | LCx |
| Posterior | Tall R in V1–V2; ST depression V1–V2 | (mirror image) | RCA or LCx |
| Right ventricle | V4R (special right-sided lead) | — | Proximal RCA |
| High lateral | I, aVL | II, III, aVF | Diagonal branch |
Always do right-sided leads (V4R) in inferior STEMI — 30–40% have concurrent RV infarction
NSTEMI and Unstable Angina
- ST depression ≥ 0.5 mm or T-wave inversion in 2+ contiguous leads
- Troponin rise distinguishes NSTEMI from UA
- Normal ECG does NOT exclude ACS — serial ECGs every 15–30 min
Wellens' Syndrome (Critical LAD Stenosis)
- Type A: Biphasic T waves in V2–V3 (de Winter pattern)
- Type B: Deep symmetric T-wave inversion V2–V3 (more common)
- Occurs in pain-free period after ischaemia
- Indicates critical proximal LAD stenosis → urgent angiography
Pericarditis
- Stage 1: Widespread concave (saddle-shaped) ST elevation + PR depression (most specific)
- Stage 2: ST normalisation; PR depression persists
- Stage 3: T-wave inversion (widespread)
- Stage 4: ECG normalises
Key distinguisher: PR depression + concave ST elevation in all leads = pericarditis
Pulmonary Embolism (PE)
- Sinus tachycardia — most common finding
- S1Q3T3 pattern: Deep S in I + Q wave in III + T inversion in III
- New RBBB (incomplete or complete)
- T-wave inversion V1–V4 (right heart strain)
- Right axis deviation
- P pulmonale (right atrial strain)
ECG is often normal in PE — a normal ECG does not exclude it
Heart Failure and LV Dysfunction
- LVH with strain pattern (ST depression, T inversion in lateral leads)
- LBBB (common; indicates widespread LV disease)
- AF (common comorbidity)
- Poor R-wave progression (anterior MI pattern)
Chapter 7: Palpitations and Syncope
Approach to Palpitations
| Symptom description | Likely arrhythmia |
|---|---|
| Regular rapid onset/offset | SVT, VT |
| Irregular | AF, frequent ectopics |
| Single "thump" then pause | PVC |
| Slow and regular | Sinus bradycardia, complete block |
| Exercise-triggered | VT (RVOT tachycardia, catecholaminergic VT), HOCM |
Long QT Syndrome
| Type | Cause |
|---|---|
| LQT1 (congenital) | KCNQ1 mutation; triggered by exercise/swimming |
| LQT2 (congenital) | HERG mutation; triggered by sudden noise |
| LQT3 (congenital) | SCN5A mutation; triggered during sleep/rest |
| Acquired | Drugs, hypokalaemia, hypocalcaemia, hypomagnesaemia |
Brugada Syndrome
- Coved ST elevation ≥ 2 mm in V1–V2, followed by T-wave inversion
- "Shark fin" or "right bundle branch block-like" pattern
- May be unmasked by fever, sodium channel blockers, cocaine
Hypertrophic Cardiomyopathy (HOCM)
- LVH voltage criteria (massive in some cases)
- ST depression and T-wave inversion in lateral leads
- Abnormal (deep) Q waves in lateral and inferior leads — mimic MI
- AF in up to 20%
- Pre-excitation pattern occasionally
Channelopathies and Inherited Arrhythmia Syndromes
| Condition | ECG Sign | Risk |
|---|---|---|
| Long QT syndrome | QTc > 440–460 ms | TdP → VF |
| Brugada syndrome | Coved ST in V1–V2 | VF, SCD |
| CPVT | Normal at rest; bidirectional VT on exercise | VF on exercise |
| Short QT syndrome | QTc < 360 ms; tall peaked T waves | AF, VF |
| ARVC | Epsilon wave in V1–V3; T inversion V1–V3; LBBB morphology VT | VT, SCD |
Chapter 8: Electrolytes and Drugs
Electrolyte Effects on the ECG
Hyperkalaemia (Elevated K⁺)
| K⁺ Level | ECG Change |
|---|---|
| 5.5–6.5 mmol/L | Tall, narrow, peaked ("tented") T waves |
| 6.5–7.5 mmol/L | PR prolongation; P waves flatten/disappear |
| 7.5–8.5 mmol/L | QRS widening; "sine wave" pattern |
| > 8.5 mmol/L | VF or asystole |
Hypokalaemia (Low K⁺)
- Flat or inverted T waves
- Prominent U waves (best seen V2–V3) — U > T wave height
- ST depression
- Prolonged QU interval (often mistaken for long QT)
- Predisposes to TdP and AF
Hypercalcaemia
- Short QT interval (short ST segment, normal T duration)
- J-wave (Osborn wave) in severe cases
- May cause AV block in severe toxicity
Hypocalcaemia
- Prolonged QT due to prolonged ST segment (T wave itself normal)
- Risk of TdP
Hypo/Hypermagnesaemia
- Hypomagnesaemia: similar to hypokalaemia; predisposes to TdP
- Hypermagnesaemia: prolonged PR, wide QRS, complete heart block
Drug Effects on ECG
Digoxin
| Effect | ECG Sign |
|---|---|
| Therapeutic | Down-sloping ("reverse tick" / "scooped") ST depression; short QT; T flattening/inversion |
| Toxicity — bradyarrhythmias | Sinus bradycardia, 1st-degree block, 2nd-degree block, complete block |
| Toxicity — tachyarrhythmias | PAT with block, accelerated junctional rhythm, VT, VF |
| Characteristic toxic rhythm | Atrial tachycardia with AV block |
Digoxin toxicity is precipitated by hypokalaemia, hypomagnesaemia, renal impairment
Beta-Blockers
- Sinus bradycardia
- Prolonged PR interval
- At toxic doses: complete heart block
Amiodarone
- Sinus bradycardia
- Prolonged PR interval
- Prolonged QT (can be marked)
- T-wave changes, U waves
- At therapeutic levels — well tolerated despite QT prolongation
Sotalol / Class Ia / Class Ic Drugs
- QT prolongation (sotalol, quinidine, procainamide)
- QRS widening (flecainide, propafenone, tricyclics)
- Risk of TdP
Tricyclic Antidepressants (Toxicity)
- Wide QRS (> 0.10 s) — most important sign
- Prolonged QT
- Right axis deviation of terminal QRS
- Sinus tachycardia
- Risk of VT/VF
Quick Reference: 10-Step ECG Interpretation
| Step | Check | Normal / Abnormal |
|---|---|---|
| 1. Rate | Count R–R large squares → 300 ÷ n | 60–100 bpm |
| 2. Rhythm | Regular? P before every QRS? | Sinus, AF, flutter, VT |
| 3. Axis | Lead I and aVF direction | Normal: both positive (roughly) |
| 4. P waves | Morphology; relation to QRS | Normal: upright II, inverted aVR, < 0.12 s |
| 5. PR interval | Duration | 0.12–0.20 s |
| 6. QRS width | Duration | < 0.12 s; if wide → BBB or ventricular |
| 7. QRS morphology | Q waves, R progression, axis | No path Q; R grows V1→V6 |
| 8. ST segment | Elevation or depression | Isoelectric; ≥ 1 mm elevation = STEMI |
| 9. T waves | Polarity, size | Upright in I, II, V3–V6; inverted aVR normal |
| 10. QT interval | QTc | < 440 ms men; < 460 ms women |
At-a-Glance ECG Diagnosis Table
| Diagnosis | Rate | Rhythm | P Waves | QRS | Key Sign |
|---|---|---|---|---|---|
| Normal sinus | 60–100 | Regular | Upright II | Narrow | All normal |
| Sinus bradycardia | < 60 | Regular | Normal | Narrow | Slow but regular |
| Sinus tachycardia | > 100 | Regular | Normal | Narrow | Find the cause |
| AF | Variable | Irregularly irregular | Absent (f waves) | Narrow | No two R–R equal |
| Atrial flutter | ~150 | Regular | Sawtooth | Narrow | F waves II, aVF, V1 |
| SVT (AVNRT) | 150–250 | Regular | Hidden/retrograde | Narrow | Sudden onset |
| VT | > 100 | Regular | Dissociated | Wide (>0.12) | AV dissociation |
| Complete AV block | 20–60 | Regular (slow) | Independent, regular | Wide | P and QRS unrelated |
| 1st-degree block | Normal | Regular | Normal | Narrow | PR > 0.20 s |
| 2nd-degree Mobitz I | Normal–slow | Irregular | Progressive PR | Narrow | Dropped QRS cyclically |
| 2nd-degree Mobitz II | Normal–slow | Irregular | Constant PR | Often wide | Sudden dropped QRS |
| RBBB | Normal | Regular | Normal | Wide (RSR' V1) | Broad S in I, V5/V6 |
| LBBB | Normal | Regular | Normal | Wide (broad R lateral) | No septal Q in V5/V6 |
| WPW | Normal | Regular | Normal | Wide (delta) | Short PR + delta wave |
| Anterior STEMI | Normal–tachy | Any | Normal | May have Q | ST elevation V1–V4 |
| Inferior STEMI | Normal–brady | Any | Normal | Q in II/III/aVF | ST elevation II, III, aVF |
| Pericarditis | Normal | Regular | Normal | Narrow | Saddle ST + PR depression |
| PE | Tachy | Regular | Normal | Narrow or RBBB | S1Q3T3, T inv V1–V4 |
| Hyperkalaemia | Slow | Any | Flat/absent | Wide | Tented T waves |
| Digoxin effect | Slow | AF or sinus | Normal | Narrow | Scooped ST depression |
| WPW | Normal | Regular | Normal | Wide (delta wave) | Short PR |