
From Guyton and Hall textbook of medical physiology, 4th South Asia edition, write a 10 mark LONG ANSWER of -Cyclical Changes in Uterus during Reproductive Life, Its Hormonal Regulation
uterine endometrial cycle menstrual phases estrogen progesterone diagram
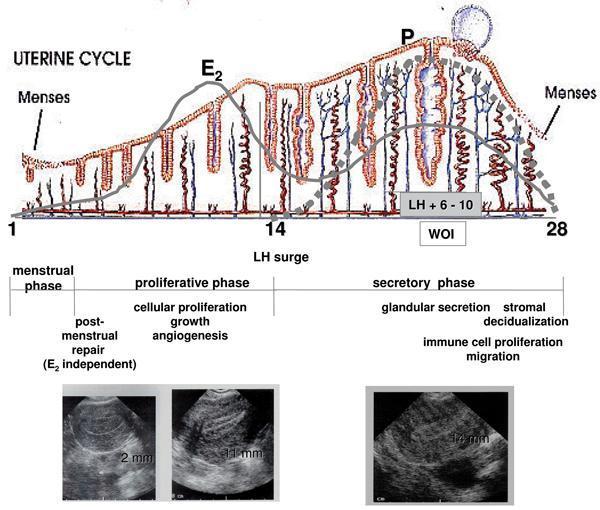
This composite educational graphic illustrates the morphological and hormonal changes of the human endometrium across a standard 28-day uterine cycle. The top section features a pathophysiology diagram showing fluctuations in estradiol (E2) and progesterone (P). E2 peaks during the proliferative phase, correlating with endometrial growth, while P dominates the secretory phase, driving glandular coiling and the 'window of implantation' (WOI). Below the hormone curves, a cross-sectional illustration depicts the histological evolution of endometrial glands and spiral arteries. It transitions from a thin, shedding layer in the menstrual phase to elongated glands during the proliferative phase, and finally to highly coiled, secretory glands with increased angiogenesis in the secretory phase. The bottom section displays three diagnostic ultrasound images of the uterus, providing clinical correlation of endometrial thickness: 2 mm (early proliferative), 11 mm (late proliferative), and 14 mm (mid-secretory). Key physiological processes such as post-menstrual repair, cellular proliferation, angiogenesis, and stromal decidualization are annotated to link hormonal signaling with macroscopic and microscopic changes.
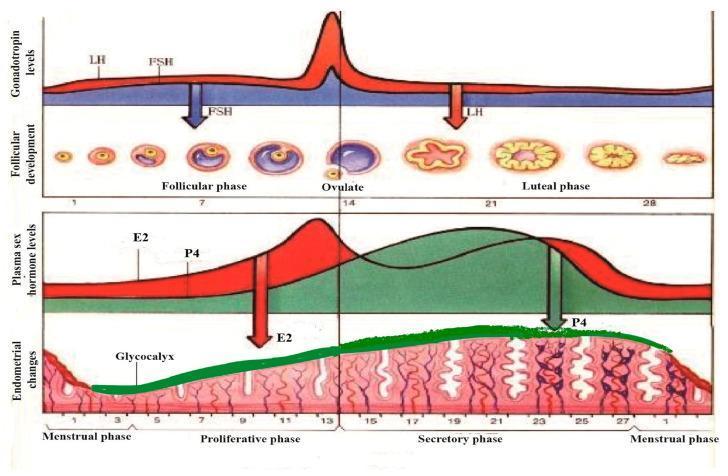
A multi-panel pathophysiology diagram illustrating the synchronous physiological changes during a standard 28-day human menstrual cycle. The top panel graphs gonadotropin levels, showing a sharp surge in Luteinizing Hormone (LH) and a moderate rise in Follicle-Stimulating Hormone (FSH) at day 14, correlating with the follicular phase, ovulation, and luteal phase stages. The corresponding follicular development shows the maturation of a primary follicle into a Graafian follicle, ovulation, and the formation of the corpus luteum and corpus albicans. The middle panel tracks plasma sex hormone levels, highlighting the mid-cycle peak of Estradiol (E2) and the post-ovulatory rise of Progesterone (P4). The bottom panel depicts endometrial morphology, transitioning from the menstrual phase to the proliferative and secretory phases. A green-shaded layer highlights the glycocalyx development, which thickens and becomes most prominent during the secretory phase under the influence of P4, before thinning during menstruation. The diagram demonstrates the hormonal regulation of the ovary and uterine lining for medical educational purposes.
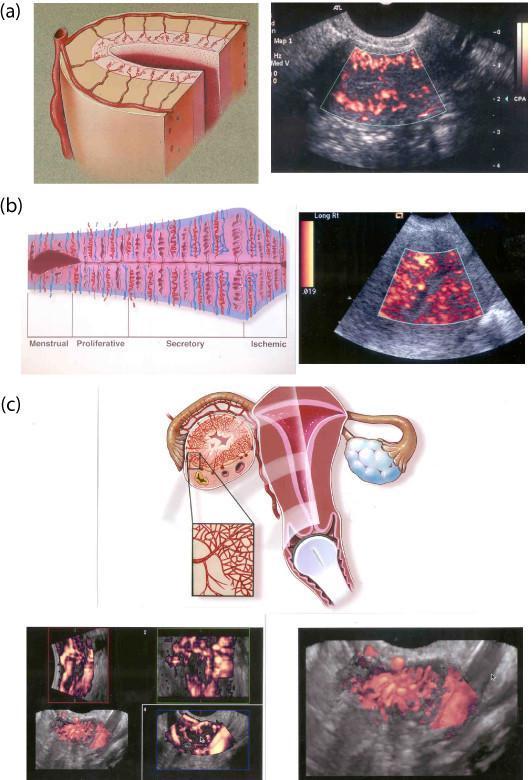
This composite educational resource compares 2D and 3D transvaginal color Doppler sonography (TV-CDS) for evaluating pelvic vascularity. (a) A cross-sectional anatomical diagram and 2D TV-CDS image highlight the uterine vascular hierarchy during the follicular phase, depicting arcuate, radial, and spiral vessels. (b) A timeline diagram illustrates endometrial vascular changes across the menstrual cycle phases: Menstrual, Proliferative, Secretory, and Ischemic. This is paired with a 2D TV-CDS showing the characteristic increase in spiral vessel density during the luteal phase. (c) The bottom section focuses on the corpus luteum, featuring a diagram of the female reproductive system with a magnified view of ovarian vascularization. Below this, multiplanar 3D TV-CDS images (longitudinal, axial, and coronal planes) and a high-definition 3D reconstruction demonstrate the pathognomonic vascular 'wreath'—a dense circumferential ring of blood vessels surrounding the functioning corpus luteum. This content illustrates key gynecological sonography concepts, including the cyclical nature of endometrial perfusion and the advanced spatial assessment afforded by 3D Doppler imaging for ovarian structures.
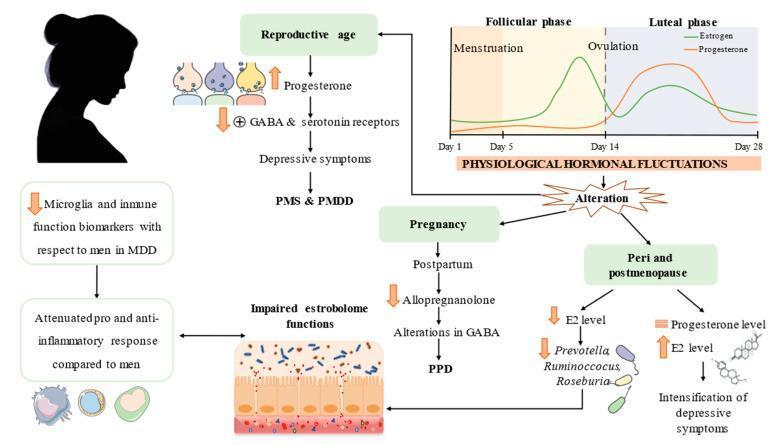
This pathophysiology diagram illustrates hallmarks of major depressive disorder (MDD) across various stages of the female reproductive lifespan, including reproductive age, pregnancy, and peri- and postmenopause. A line graph labeled 'Physiological Hormonal Fluctuations' depicts the 28-day menstrual cycle, showing estrogen peaks prior to ovulation (Day 14) and progesterone dominance during the luteal phase. A signaling pathway shows how progesterone fluctuations lead to GABA and serotonin receptor modulation, contributing to premenstrual syndrome (PMS) and premenstrual dysphoric disorder (PMDD). In the pregnancy/postpartum pathway, reduced allopregnanolone levels and GABA alterations are linked to postpartum depression (PPD). The peri- and postmenopausal section illustrates declining estradiol (E2) and progesterone, linked to the intensification of depressive symptoms. The diagram also highlights secondary factors, including impaired estrobolome function (gut-microbiome-estrogen axis) involving bacteria like Prevotella and Ruminococcus, and an immune component characterized by attenuated microglia and inflammatory responses compared to men. This visualization integrates endocrinology, neurobiology, and immunology to explain sex-specific vulnerabilities in mood disorders.
Cyclical Changes in the Uterus During Reproductive Life and Their Hormonal Regulation
Introduction
I. Phases of the Monthly Endometrial (Uterine) Cycle
- Proliferation of the endometrium
- Secretory (progestational) changes
- Desquamation - known as menstruation
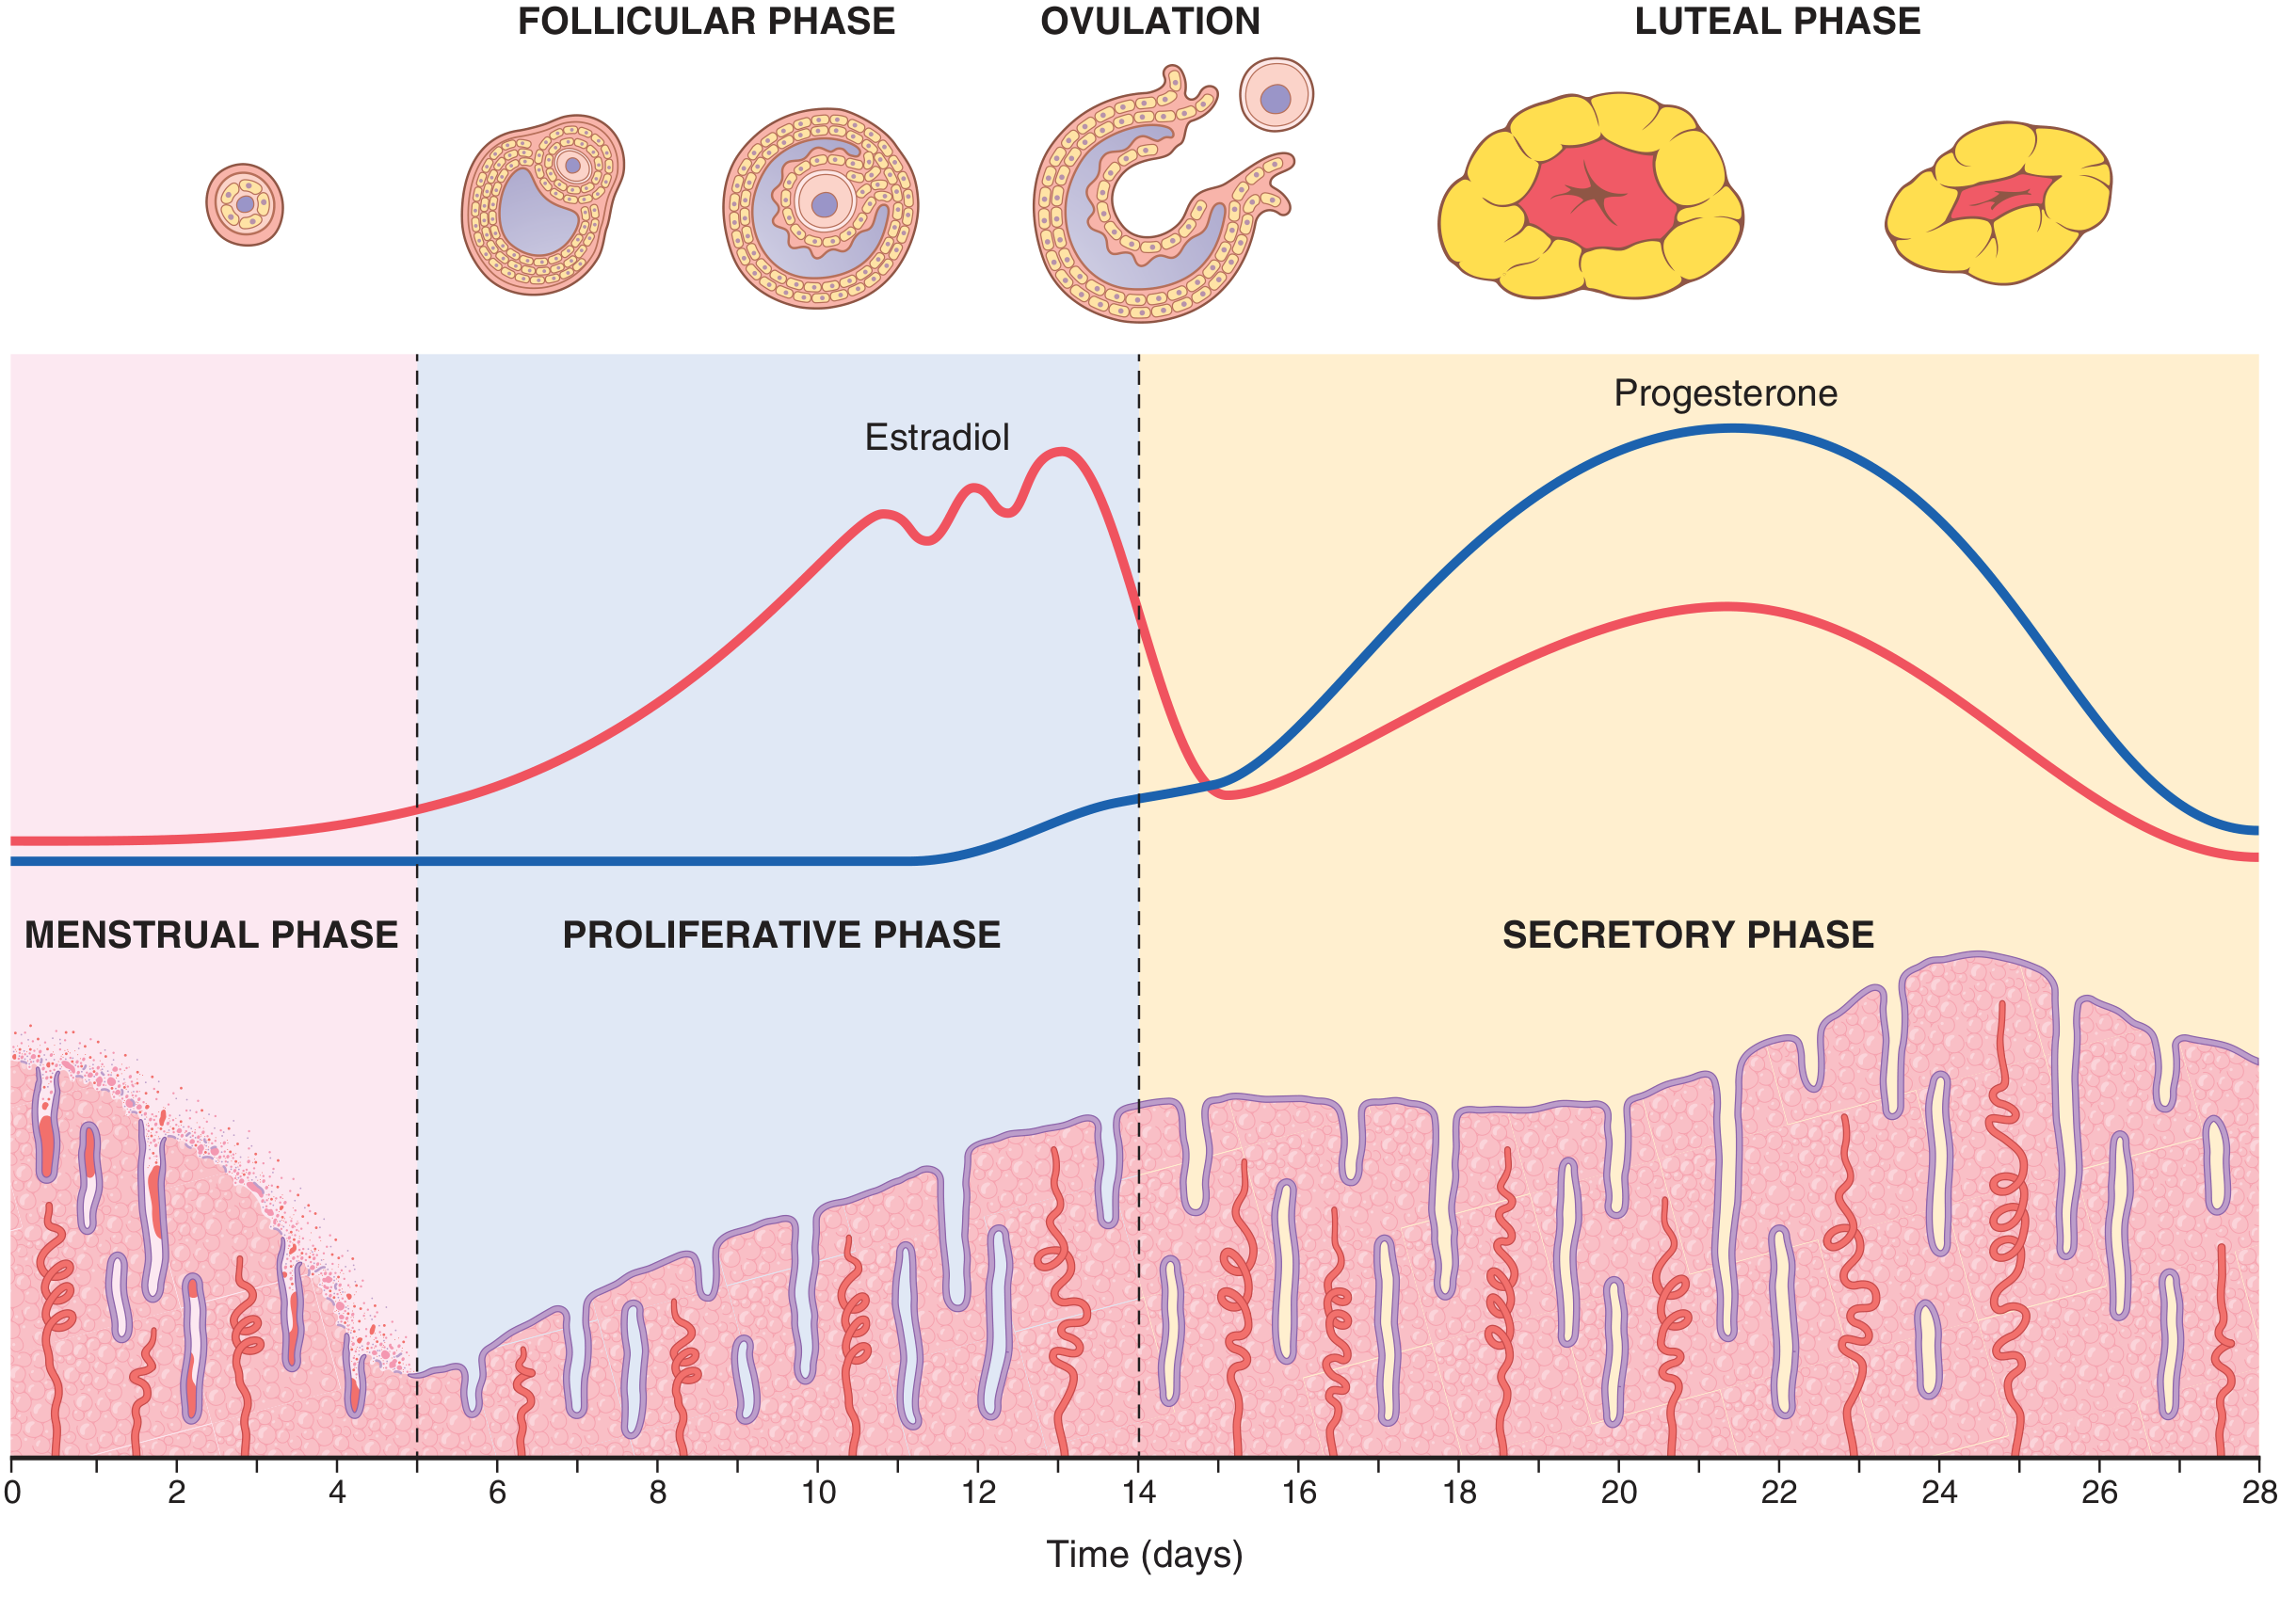
A. Proliferative Phase (Estrogen Phase) - Days 5-14
- Occurs before ovulation, corresponding to the follicular phase of the ovary.
- At the beginning of each monthly cycle, most of the endometrium has been desquamated by menstruation. Only a thin layer of endometrial stroma remains, with epithelial cells confined to the deeper portions of the glands and crypts.
- Under the influence of estrogens secreted in increasing quantities by the growing ovarian follicles:
- Stromal cells and epithelial cells proliferate rapidly.
- The endometrial surface is reepithelialized within 4 to 7 days after the onset of menstruation.
- Over the next week and a half (before ovulation), the endometrium increases greatly in thickness due to increasing numbers of stromal cells, progressive growth of endometrial glands, and formation of new blood vessels.
- At the time of ovulation (day 14), the endometrium is 3 to 5 mm thick.
- The endometrial glands, especially those of the cervical region, secrete thin, stringy mucus. The mucus strings align themselves along the length of the cervical canal, forming channels that guide sperm in the proper direction.
B. Secretory Phase (Progestational Phase) - Days 15-28
- Occurs after ovulation, corresponding to the luteal phase of the ovary.
- During most of the latter half of the monthly cycle, after ovulation, progesterone and estrogen together are secreted in large quantities by the corpus luteum.
- Estrogens cause slight additional cellular proliferation.
- Progesterone causes the major changes:
- Marked swelling and secretory development of the endometrium.
- Glands increase in tortuosity (become highly coiled).
- Excess secretory substances accumulate in the glandular epithelial cells.
- Cytoplasm of stromal cells increases; lipid and glycogen deposits increase greatly.
- Blood supply further increases, with blood vessels becoming highly tortuous (spiral arteries).
- At the peak of the secretory phase (~1 week after ovulation, day 21), the endometrium has a thickness of 5 to 6 mm.
- Purpose: To produce a highly secretory endometrium containing large amounts of stored nutrients, providing appropriate conditions for implantation of a fertilized ovum during the latter half of the monthly cycle.
- "Uterine milk" - the uterine secretions provide nutrition for the early dividing ovum from the time it enters the uterine cavity (3-4 days after ovulation) until implantation (7-9 days after ovulation). After implantation, trophoblastic cells digest the endometrium and absorb stored substances.
C. Menstrual Phase - Days 1-5
-
If the ovum is not fertilized, about 2 days before the end of the monthly cycle, the corpus luteum involutes, and estrogens and progesterone fall to very low levels.
-
Mechanism of menstruation (step by step):
- Decreased stimulation of endometrial cells leads to involution of the endometrium to about 65% of its previous thickness.
- During the 24 hours preceding menstruation, the tortuous blood vessels become vasospastic - due to release of vasoconstrictor prostaglandins from the involuting endometrium.
- Vasospasm + decrease in nutrients + loss of hormonal stimulation initiate necrosis of the endometrium, especially of blood vessels.
- Blood seeps into the vascular layer; hemorrhagic areas grow rapidly over 24-36 hours.
- Necrotic outer layers separate from the uterus at sites of hemorrhage.
- About 48 hours after onset, all superficial layers of the endometrium have desquamated.
- The mass of desquamated tissue, blood, and prostaglandins triggers uterine contractions that expel the contents.
-
Normal menstrual blood loss: approximately 40 mL of blood + 35 mL of serous fluid.
-
Menstrual fluid is normally non-clotting because a fibrinolysin is released along with necrotic endometrial material.
-
Leukorrhea during menstruation: Large numbers of leukocytes are released along with necrotic material, making the uterus highly resistant to infection during menstruation, even though the endometrial surfaces are denuded.
-
Within 4 to 7 days after menstruation starts, blood loss ceases as the endometrium becomes reepithelialized and a new cycle begins.
II. Hormonal Regulation of the Uterine Cycle
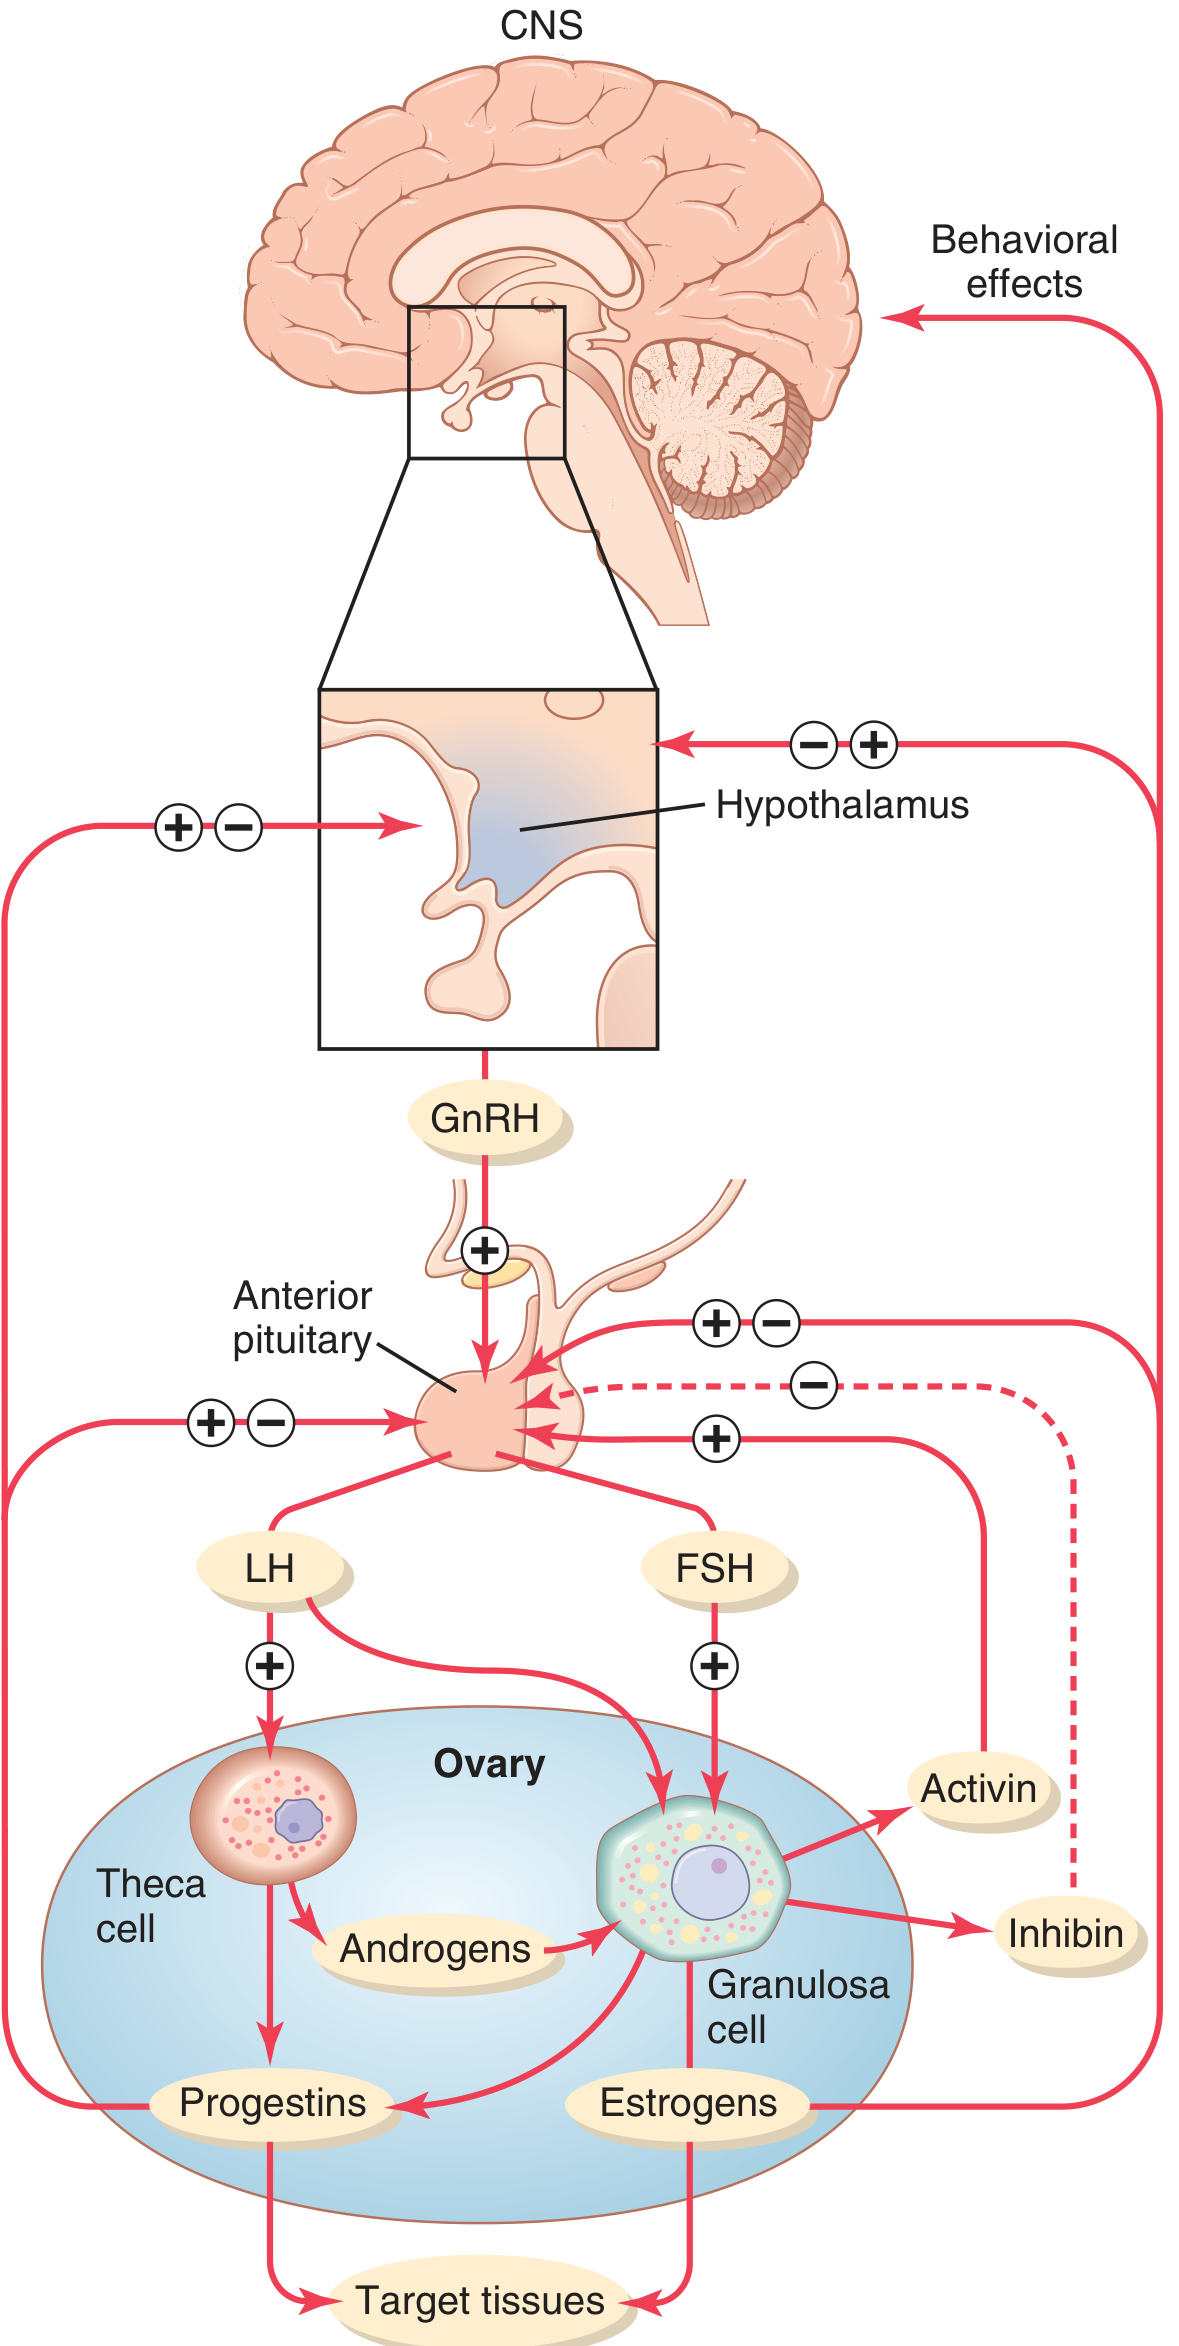
A. Role of the Hypothalamus - GnRH
- The hypothalamus secretes Gonadotropin-Releasing Hormone (GnRH), a decapeptide (Glu-His-Trp-Ser-Tyr-Gly-Leu-Arg-Pro-Gly-NH₂).
- GnRH is secreted in pulsatile bursts of 5-25 minutes, occurring every 1 to 2 hours (approximately every 90 minutes).
- The pulsatile nature is essential - continuous infusion of GnRH causes loss of LH/FSH secretion (downregulation of receptors).
- The KNDy neurons of the arcuate nucleus play a major role - they co-express kisspeptin, neurokinin B (NKB), and dynorphin:
- NKB stimulates kisspeptin release.
- Dynorphin inhibits kisspeptin release and terminates GnRH neuron activation.
- Kisspeptin stimulates GnRH neurons episodically, creating rhythmic pulsatile GnRH secretion.
- Higher brain limbic system neurons also transmit signals to modify KNDy neuron activity, explaining why psychic factors can modify female sexual function.
B. Role of Anterior Pituitary - FSH and LH
- GnRH stimulates the anterior pituitary to secrete FSH (Follicle-Stimulating Hormone) and LH (Luteinizing Hormone) - both small glycoproteins (~30,000 molecular weight).
- In the follicular phase (days 1-14): FSH levels rise first and cause growth of 8 to 12 new follicles, only one of which becomes dominant.
- At day 14: A massive, abrupt preovulatory LH surge occurs (LH increases 6-fold to 8-fold, FSH increases ~2-fold) - this triggers ovulation.
- In the luteal phase (days 15-28): LH sustains the corpus luteum, which secretes progesterone and estrogen.
C. Negative Feedback
- Estrogen in small amounts has a strong inhibitory effect on LH and FSH production, operating primarily on the anterior pituitary and to a lesser extent on the hypothalamus (alters GnRH pulse frequency).
- When progesterone is added, the inhibitory effect of estrogen is multiplied (synergistic negative feedback).
- Inhibin (secreted by granulosa cells of the corpus luteum) specifically inhibits FSH secretion (and to a lesser extent, LH) by the anterior pituitary. Inhibin is especially important in causing the decrease in FSH and LH at the end of the monthly cycle.
D. Positive Feedback - The Preovulatory LH Surge
- As estrogen rises markedly in the late follicular phase, it switches from negative to positive feedback on the anterior pituitary, stimulating the massive LH surge.
- Small quantities of progesterone secreted by granulosa cells just before the LH surge may also contribute.
- Without the LH surge, ovulation will not occur.
E. The Feedback Oscillation - Mechanism of the Rhythm
-
Post-ovulatory phase (Days 15-26): Corpus luteum secretes large quantities of estrogen, progesterone, and inhibin → combined negative feedback on hypothalamus and anterior pituitary → FSH and LH suppressed to their lowest levels (days 24-26).
-
Follicular growth phase (Days 27-1): Two to three days before menstruation, corpus luteum involutes → estrogen, progesterone, and inhibin fall to a low ebb → negative feedback is released → FSH begins to increase → new follicles begin to grow → cycle begins again.
-
Ovulatory phase (Day 14): Rising estrogen from maturing follicle exerts positive feedback → massive LH surge → ovulation → corpus luteum forms → cycle continues.
F. Anovulatory Cycles
- If the preovulatory LH surge is insufficient, ovulation does not occur - this is an anovulatory cycle.
- Results: failure of corpus luteum development, almost no progesterone secretion in the latter half of the cycle, and the cycle is shortened by several days.
- The first few cycles after puberty are usually anovulatory, as are cycles several months to years before menopause, because the LH surge is insufficient at these times.
III. Cyclical Changes at Puberty and Menarche
- Puberty begins around age 8-10 with a gradual increase in gonadotropin secretion.
- Menarche (onset of the first menstrual cycle) typically occurs between ages 10 and 14 years (average 12 years).
- The onset is triggered by maturation of KNDy-kisspeptin neurons, which activate pulsatile GnRH secretion. Mutations activating the kisspeptin receptor gene cause central precocious puberty; inactivating mutations delay or halt puberty.
Summary Table
| Phase | Days | Dominant Hormone | Endometrial Changes |
|---|---|---|---|
| Menstrual | 1-5 | Estrogen & Progesterone fall | Desquamation, hemorrhage |
| Proliferative | 5-14 | Estrogen (rising) | Reepithelialization, gland growth, thickness 3-5 mm |
| Secretory | 14-28 | Progesterone + Estrogen | Gland tortuosity, glycogen/lipid storage, thickness 5-6 mm |