
Explain about beta sheet. Second is structure of amino acids.
beta sheet protein secondary structure hydrogen bonds
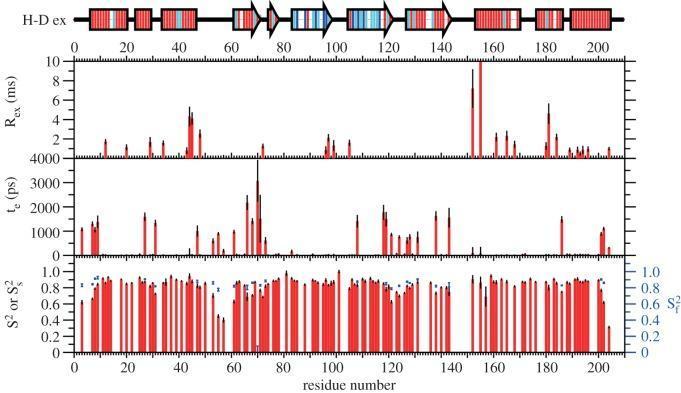
This infographic presents a pathophysiology diagram and data charts illustrating the backbone dynamics of the Latherin protein based on 15N NMR relaxation measurements. The image is divided into a secondary structure schematic at the top and three aligned quantitative graphs below, all indexed by amino acid residue number (0–210) on the x-axis. The secondary structure schematic depicts alpha-helices as red rectangles and beta-strands as yellow arrows. This map is color-coded by hydrogen-deuterium (H-D) exchange rates: red indicates fast exchange (lifetime <20 min), cyan indicates medium exchange (20–480 min), and blue indicates slow exchange (>480 min). The three graphs show dynamic parameters: the top graph plots exchange broadening (R_ex in ms), the middle plots local correlation times (τe in ps), and the bottom plots Lipari-Szabo order parameters (S^2 or S^2_s), which represent structural rigidity. The data reveals that the beta-sheet regions generally exhibit higher order parameters and slower exchange rates compared to the dynamic loops and termini, providing insights into the protein's flexibility and potential for interfacial unfolding.
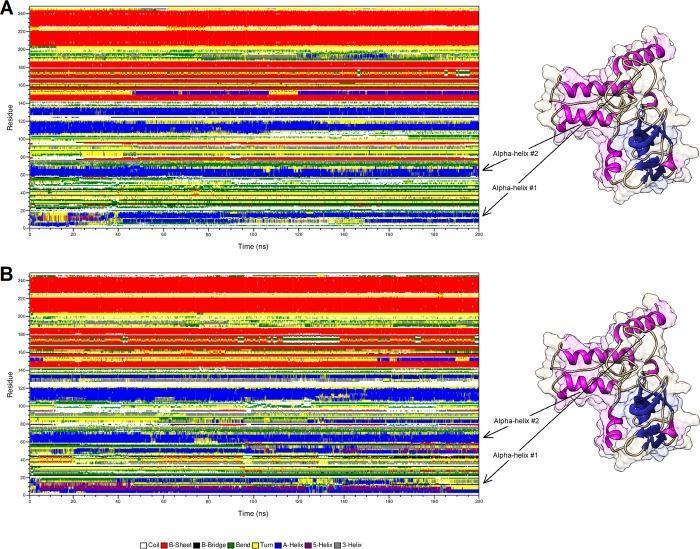
This bioinformatics infographic displays a secondary structure comparison between wild-type Brain-Derived Neurotrophic Factor (BDNF) (A) and its V66M variant (B) using Molecular Dynamics (MD) simulations. The central components are two time-evolution heatmaps (residue number vs. time in nanoseconds, 0-200 ns) showing the stability and transitions of protein motifs. A standardized color key identifies structural elements: white for coils, red for beta-sheets, black for beta-bridges, green for bends, yellow for turns, blue for alpha-helices, purple for 5-helices, and gray for 3-helices. To the right of each heatmap, a 3D ribbon-and-surface protein model highlights specific alpha-helices (Alpha-helix #1 and #2) for spatial orientation. Comparison reveals temporal shifts in secondary structure stability, particularly in the N-terminus and pre-domain regions of the V66M variant. The red beta-sheet regions show increased density in the V66M variant compared to the wild-type, while alpha-helical regions exhibit altered temporal patterns. This visualization illustrates how single-point mutations like V66M can impact protein folding and essential molecular motions related to neurodevelopmental pathways.
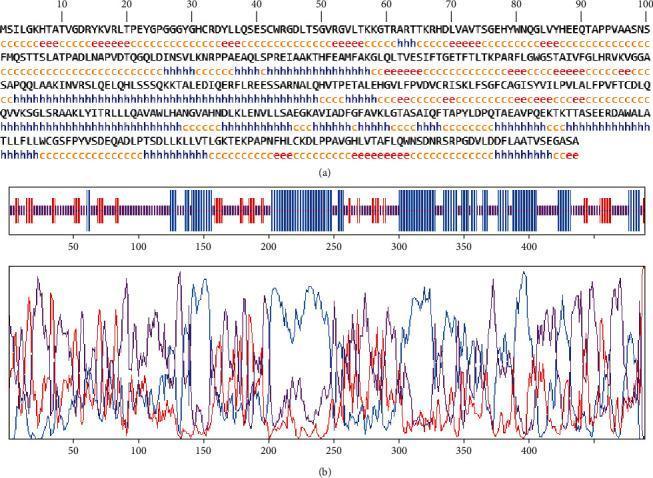
This figure presents the results of a bioinformatic analysis of the secondary structure of the ROP29 protein, a protein relevant in medical microbiology and infectious disease research. Panel (a) shows the primary amino acid sequence with GOR4 secondary structure predictions mapped directly beneath each residue. Predictions are represented by letter codes: 'h' (blue) for alpha-helix, 'e' (red) for extended strand (beta-sheet), 'c' (orange) for random coil, and 't' (purple) for turn. This linear map allows for the identification of specific structural domains along the 489-residue sequence. Panel (b) consists of two graphical plots. The upper plot in (b) is a color-coded barcode representation of structural propensity along the sequence length. The lower plot in (b) is a line graph displaying the statistical probability or propensity scores of secondary structures (blue and red lines) across the amino acid positions. These tools are used in vaccine development and proteomics to predict epitope accessibility and protein folding characteristics. The analysis highlights that the protein is predominantly composed of random coils (49.69%) and alpha-helices (36.81%).
amino acid structure general formula R group
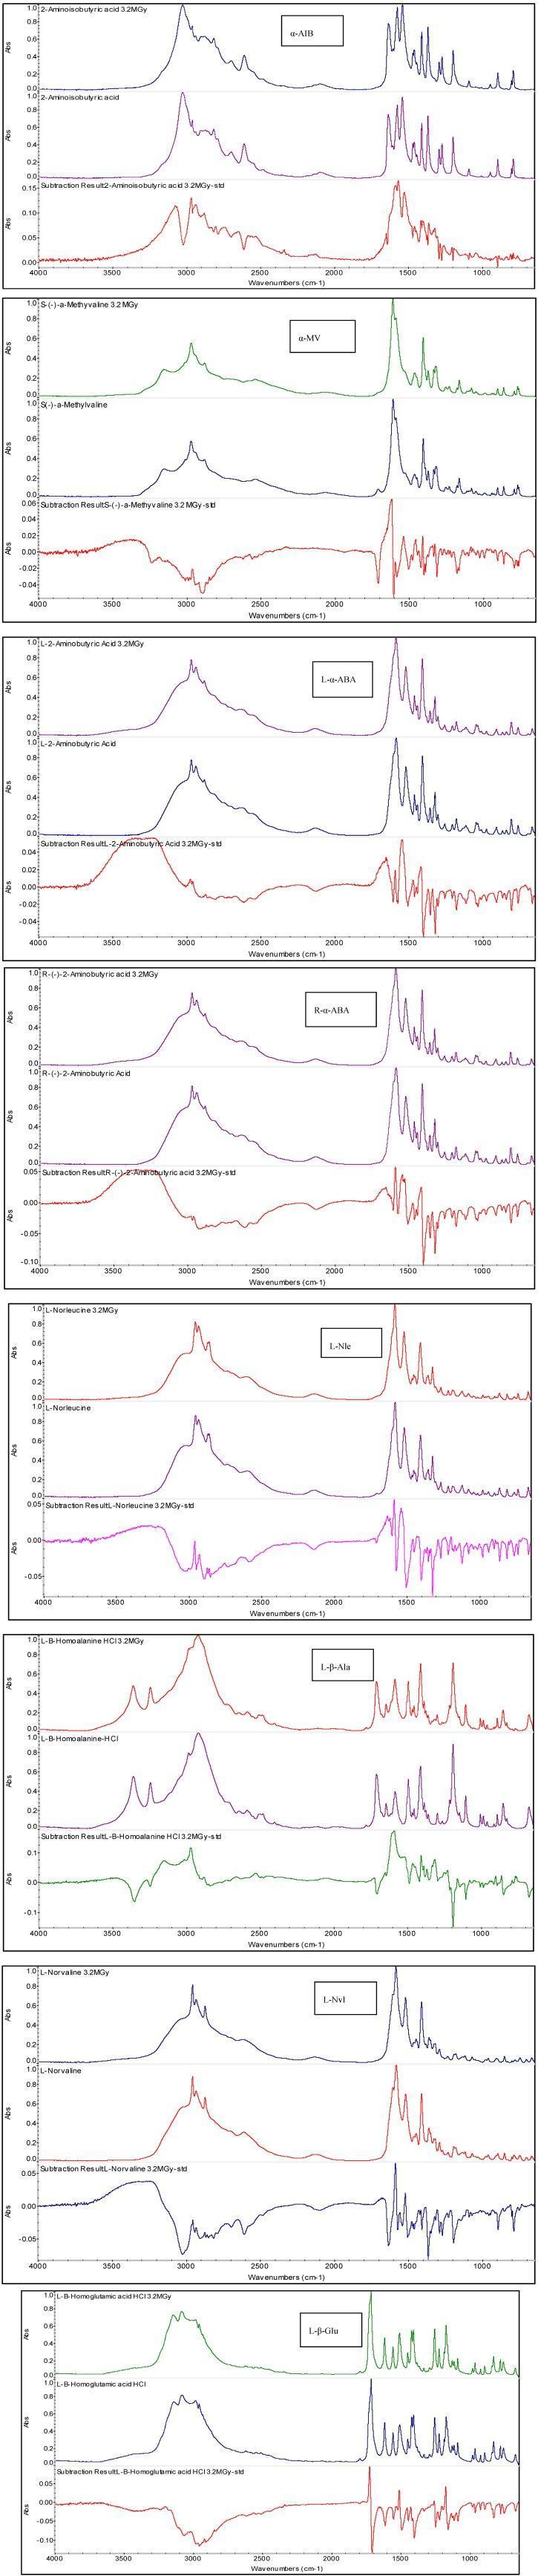
This figure presents a series of eight panels displaying Fourier-Transform Infrared (FT-IR) spectra for various amino acids, including alpha-AIB, alpha-MV, L-alpha-ABA, R-alpha-ABA, L-Nle, L-beta-Ala, L-Nvl, and L-beta-Glu. Each panel follows a standardized vertical layout: the top spectrum represents the amino acid after exposure to high-dose radiolysis (3.2 MGy), the middle spectrum shows the pristine (non-irradiated) reference sample, and the bottom plot illustrates the 'difference spectrum' (radiolyzed minus reference). The x-axis measures Wavenumbers (cm⁻¹) from 4000 to 1000, and the y-axis tracks Absorbance (Abs). In the difference spectra, upward peaks indicate new bond formation or increased band intensity post-radiolysis, while downward peaks signal bond degradation or intensity loss. Key clinical and biochemical significance is found in the significant changes observed in the 3300–2600 cm⁻¹ range (protonated amino group -NH3+ asymmetric stretching) and the 1665–1470 cm⁻¹ range (-NH3+ bending). These visual data demonstrate that radiolysis primarily affects the amino functionality in the zwitterionic solid state, leading to deamination and the production of carboxylic and keto acids.
![A chemical skeletal structure of an arsenic-containing fatty acid (AsFA 528) with the molecular formula C30H45AsO3. The molecule features a dimethylarsinoyl group (O=As(CH3)2) at one terminus and a carboxylic acid functional group (COOH) at the opposite terminus. These groups are connected by a long hydrocarbon chain containing eight carbon-carbon double bonds, characterizing the molecule as a polyunsaturated arsenolipid. The visual represents a natural product found in marine organisms that may enter the human food chain. Text below the diagram provides high-resolution mass spectrometry data, including the calculated and experimental mass-to-charge ratios ([MH]+) and the mass error in ppm, which are critical for identifying complex biological lipids in toxicological and nutritional research.](https://cdn.orris.care/cdss_images/pmc_clinical_VQA_bbceb3375ba1751cf7df2049acb0cb73360faafa1baa9f5ac73ae0bec3a73ec6.jpg)
A chemical skeletal structure of an arsenic-containing fatty acid (AsFA 528) with the molecular formula C30H45AsO3. The molecule features a dimethylarsinoyl group (O=As(CH3)2) at one terminus and a carboxylic acid functional group (COOH) at the opposite terminus. These groups are connected by a long hydrocarbon chain containing eight carbon-carbon double bonds, characterizing the molecule as a polyunsaturated arsenolipid. The visual represents a natural product found in marine organisms that may enter the human food chain. Text below the diagram provides high-resolution mass spectrometry data, including the calculated and experimental mass-to-charge ratios ([MH]+) and the mass error in ppm, which are critical for identifying complex biological lipids in toxicological and nutritional research.
This infographic presents the Structure-Activity Relationship (SAR) of thiazole-chalcone derivatives (2p-2p) specifically designed as potential antimitotic agents in cancer therapy. The central figure displays the core chemical scaffold, which consists of a substituted phenyl ring (labeled with 'R') linked to a thiazole ring via a chalcone bridge featuring a carbonyl group (C=O). The thiazole ring includes a thiocarbonyl (C=S) moiety and an NH group. Annotations describe how variations in this structure influence pharmacological properties. Key takeaways include: electron-withdrawing groups (EWGs) like halogens and nitro groups enhance cytotoxic activity; the thiazole ring contributes to improved water solubility, bioavailability, and tubulin binding. Notably, the diagram illustrates that the thiocarbonyl moiety forms a dual hydrogen bond with the amino acid Cys241, facilitating tubulin polymerization inhibition. The graphic summarizes rankings for cytotoxic activity and tubulin inhibition based on different substituent positions, such as 3-Cl having the highest inhibitory potency. This content is intended for advanced pharmaceutical and oncological education focusing on drug design and medicinal chemistry.
amino acid zwitterion alpha carbon carboxyl amino group diagram

This biochemical diagram illustrates the ionization equilibrium of L-ornithine, a basic amino acid involved in the urea cycle and ammonia detoxification. The diagram displays four distinct ionic states (L-ornithine2+, L-ornithine+, L-ornithine±, and L-ornithine-) transitioning via sequential deprotonation. The first transition (K1) shows the deprotonation of the carboxylic acid group (COOH to COO-). The second transition (K2) depicts the deprotonation of the terminal delta-amino group (NH3+ to NH2), leading to the zwitterionic form (L-ornithine±). The final transition (K3) represents the deprotonation of the alpha-amino group on the chiral carbon, resulting in the negatively charged anionic form (L-ornithine-). Each step is labeled with its respective equilibrium constant (K1, K2, K3), illustrating the chemical behavior of the molecule across a pH gradient. This clinical chemistry schematic is essential for understanding the pharmacology of L-ornithine L-aspartate used in treating hepatic encephalopathy.
A chemical diagram displaying the molecular structures of various fatty acids and fatty alcohols, categorized as biochemical components relevant to human nutrition and pharmacology. The collection (labeled 8-20) illustrates a range of aliphatic compounds. Structures 8 through 15 primarily depict saturated and unsaturated fatty acids, characterized by long hydrocarbon chains terminating in a carboxylic acid group (-COOH). Notable features include branched-chain structures (8), varying carbon chain lengths (9-12), and examples of monounsaturated (13, 15) and polyunsaturated (14) fatty acids containing carbon-carbon double bonds. Structure 16 displays a more complex phosphorylated lipid derivative. Structures 17 through 20 represent fatty alcohols, identified by the terminal hydroxyl group (-OH) instead of a carboxyl group, including saturated long-chain alcohols (17-19) and a long-chain diol (20). This diagram serves as a visual reference for studying the biochemical classification, nomenclature, and structural diversity of lipids and their derivatives found in botanical sources with potential medicinal applications.
This figure provides a detailed sequence and hydrophobicity analysis of the human complement component 4B (C4B) protein, identified by accession NP_001002029.3. The top section displays a 'Query seq.' of 1744 amino acids, annotated with specific functional domains including the active site, thioester region, surface patch, and specificity-defining residues. Key conserved domains identified include R2M, AN, and the complement C3/C4/C5 superfamily. A specific peptide sequence, 1337RNGFKSHALQLNNRQIRGLEEELQFSLGSKINVK1370, is highlighted as a primary site of proteolytic cleavage, indicated by vertical arrows on the carboxyl side of the ISOPRENE_C2-like superfamily domain. The bottom section presents a ProtScale hydrophobicity plot using the Kyte & Doolittle scale. This plot correlates amino acid position (X-axis) with hydrophobicity scores (Y-axis, -4 to +3). The cleavage sites (around position 1350) are shown to correspond with a local hydrophilic maximum (negative scores), flanking evolutionarily conserved sequences shared with alpha-2-macroglobulin. This diagram illustrates the relationship between protein secondary structure, biochemical properties, and susceptibility to proteolytic degradation in human plasma.
Part 1: Beta Sheet
Key Structural Features
- The peptide backbone is highly extended, unlike the compact coil of the alpha helix
- Viewed edge-on, the backbone follows a zigzag or pleated pattern
- R groups of adjacent amino acid residues project in opposite directions (above and below the plane of the sheet)
Stabilization - Hydrogen Bonds
- In the α helix: hydrogen bonds form within the same polypeptide strand (intra-strand)
- In the β sheet: hydrogen bonds form between adjacent strands (inter-strand)
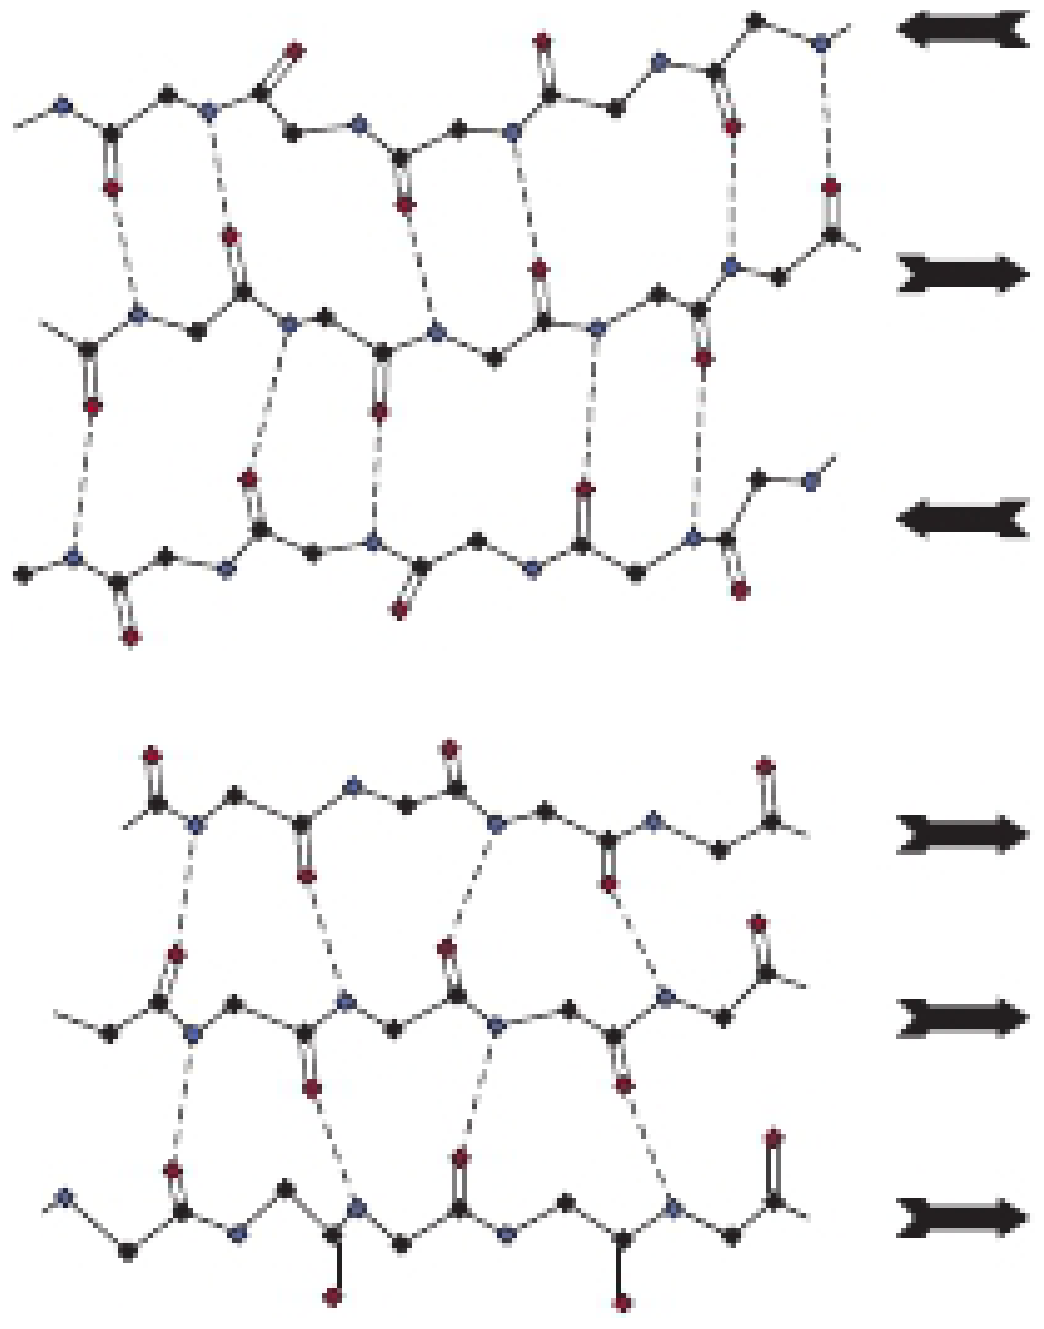
Types of Beta Sheets
| Feature | Parallel β Sheet | Antiparallel β Sheet |
|---|---|---|
| Strand direction | All run N→C in same direction | Adjacent strands run in opposite directions |
| H-bond spacing | Evenly spaced, slant in alternate directions | Pairs alternate between close together and wide apart |
| H-bond orientation | Slanted relative to backbone | Approximately perpendicular to backbone |
Geometry & Higher Order Arrangement
- Most β sheets are not perfectly flat - they have a characteristic right-handed twist
- Clusters of twisted strands, called β barrels, form the hydrophobic core of many globular proteins
- In schematic diagrams, β strands are drawn as arrows pointing from the amino (N) to carboxyl (C) terminal direction
Loops and Bends
Source: Harper's Illustrated Biochemistry, 32nd Ed.
Part 2: Structure of Amino Acids
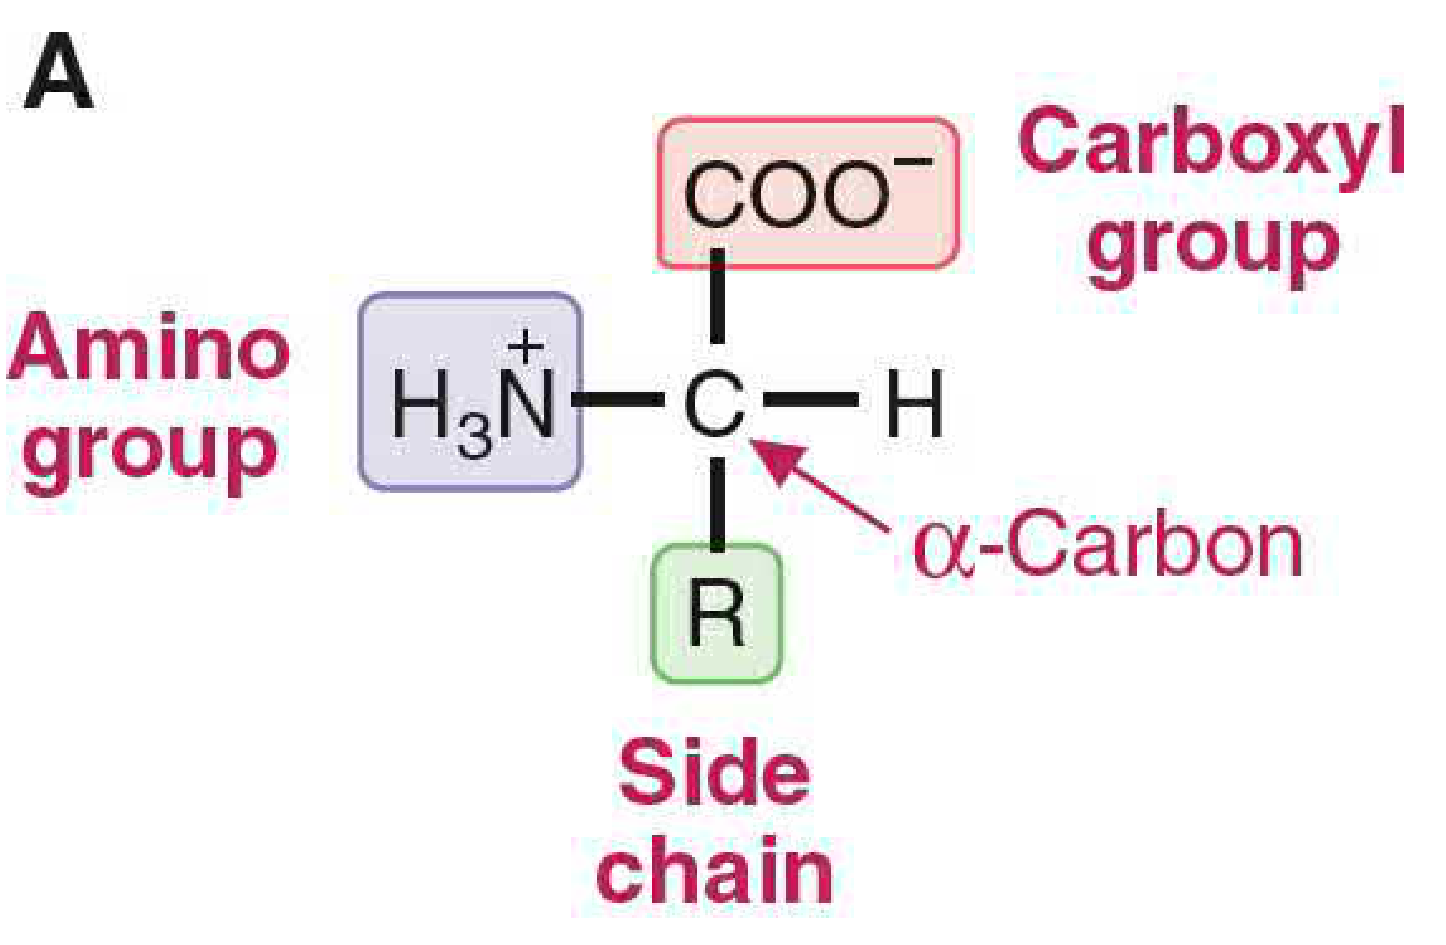
General Structure
- A carboxyl group (-COOH / -COO⁻)
- An amino group (-NH₂ / -NH₃⁺)
- A hydrogen atom (-H)
- A side chain (R group) - unique to each amino acid
Ionization State - Zwitterion
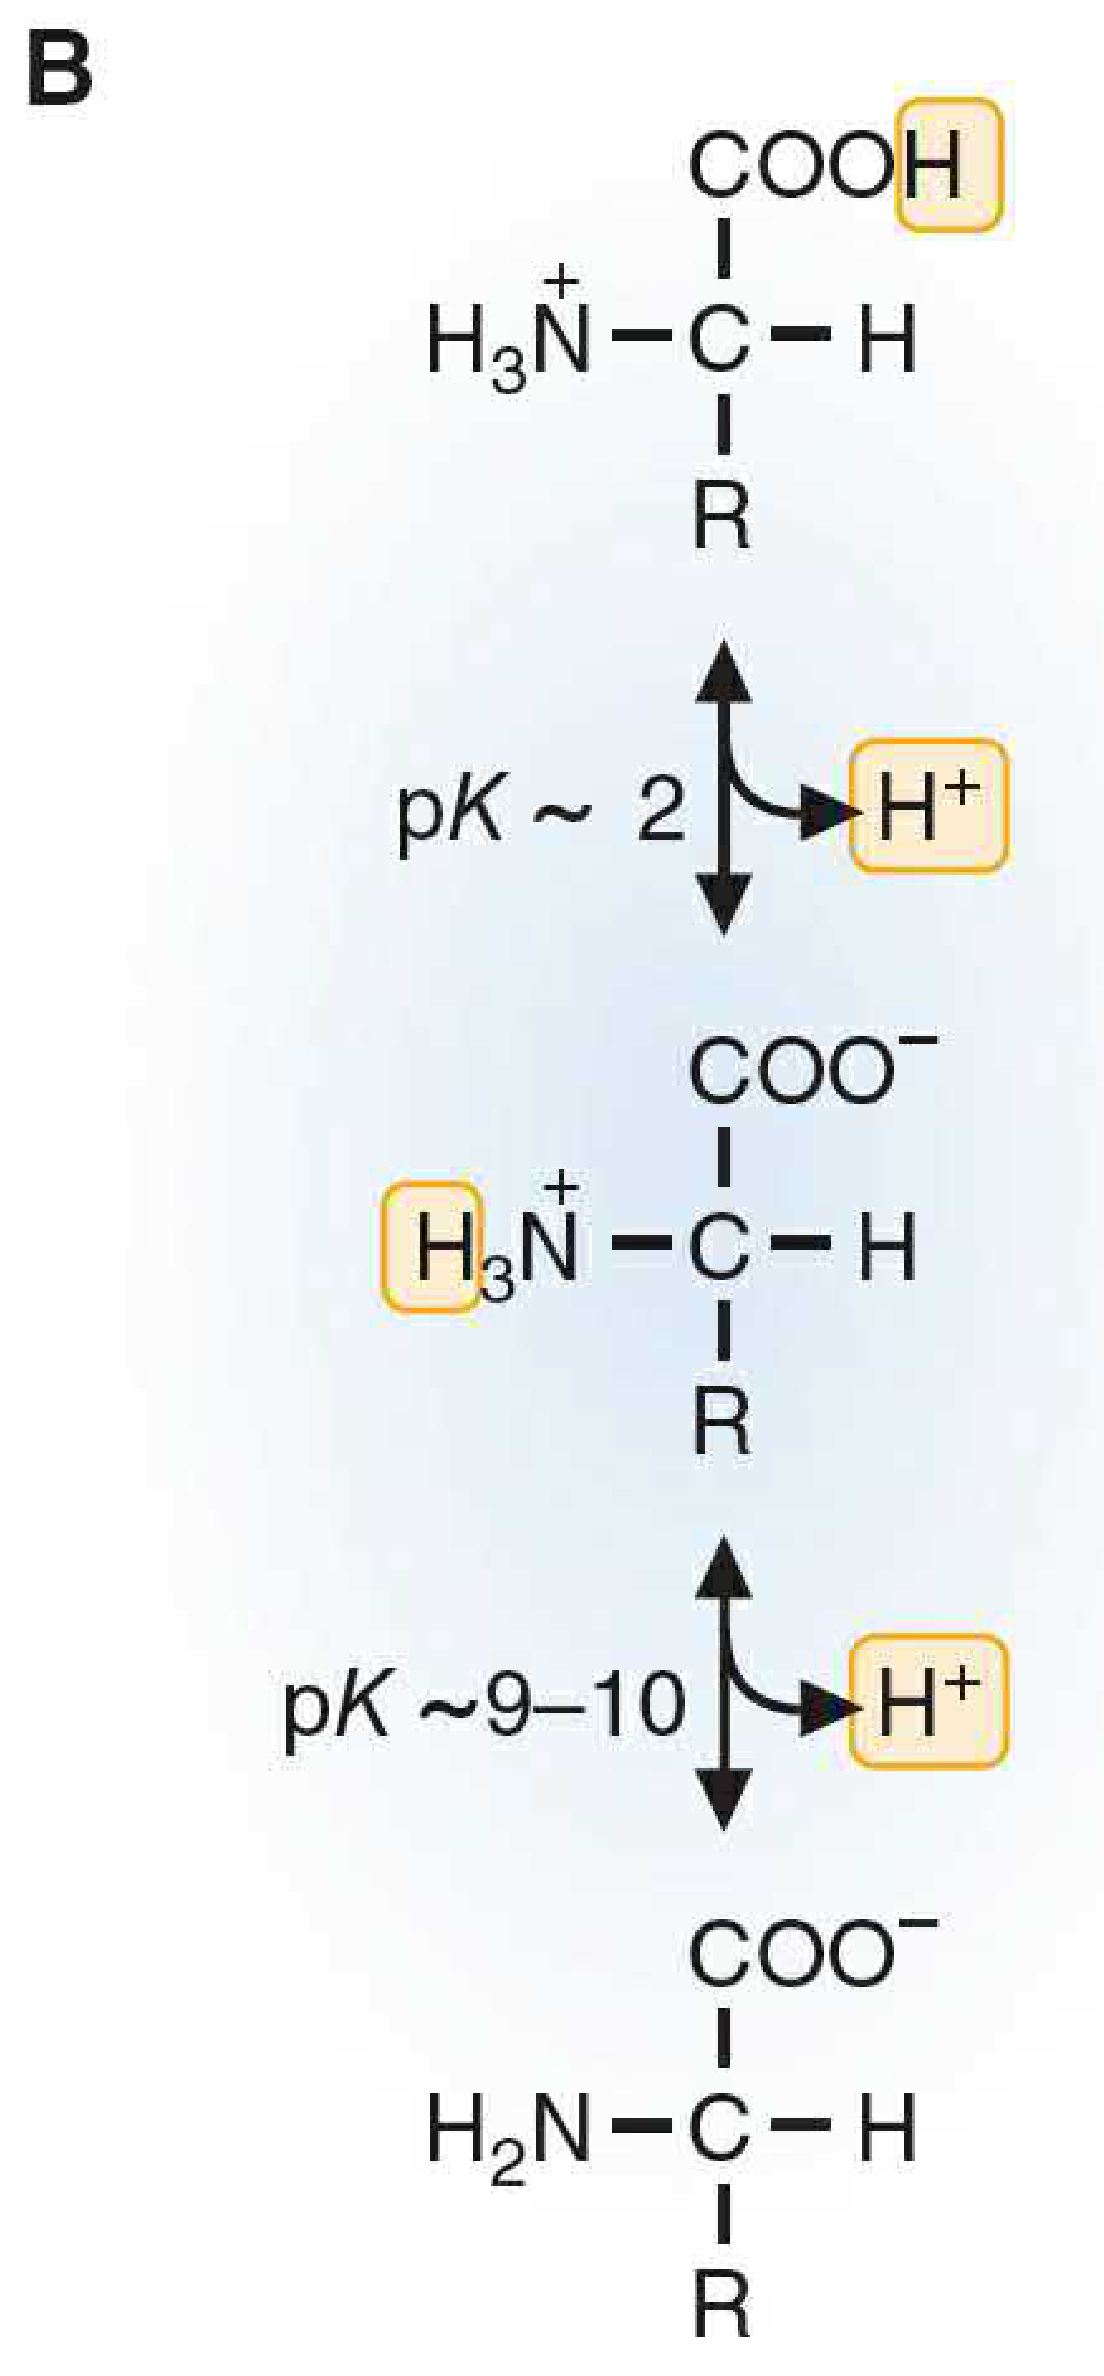
- The α-carboxyl group (pKa ~2) is fully deprotonated → carries a negative charge (-COO⁻)
- The α-amino group (pKa ~9.5) is fully protonated → carries a positive charge (-NH₃⁺)
Chirality (D- and L-Configuration)
- In all amino acids except glycine, the α-carbon is an asymmetric (chiral) carbon because it has 4 different substituents
- Amino acids in mammalian proteins are exclusively L-amino acids (amino group to the left when carboxyl is at the top)
- Glycine is the only amino acid that is neither D nor L - its R group is just a hydrogen atom, so the α-carbon has two identical substituents
Classification by R Group
| Class | Examples | Properties |
|---|---|---|
| Nonpolar/hydrophobic | Ala, Val, Leu, Ile, Phe, Trp | Found in protein interior; stabilize protein by excluding water |
| Uncharged polar | Ser, Thr, Cys, Tyr, Asn, Gln | Can form H-bonds; found on protein surface |
| Positively charged (basic) | Lys, Arg, His | Carry + charge at pH 7; form ionic interactions |
| Negatively charged (acidic) | Asp, Glu | Carry - charge at pH 7; form salt bridges |
| Special | Gly, Pro | Gly is smallest; Pro has cyclic structure that introduces rigidity/kinks |
Peptide Bond Formation
Sources: Basic Medical Biochemistry - A Clinical Approach, 6th Ed. and Harper's Illustrated Biochemistry, 32nd Ed.