
role of PDL1 in cancer therapy
PD-L1 immune checkpoint cancer therapy
PD-L1 PD-1 immune checkpoint cancer T cell inhibition mechanism
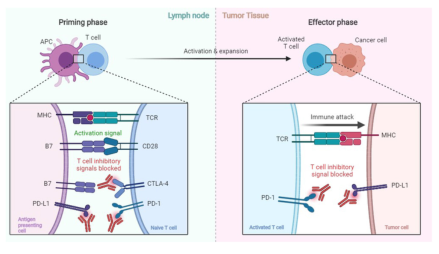
Summary : This figure illustrates the mechanism of T cell activation and inhibition in the context of cancer immunotherapy, showing both the priming phase in the lymph node and the effector phase in tumor tissue. It highlights how immune checkpoint inhibitors block inhibitory signals to enhance T cell-mediated immune attack against cancer cells. process diagram: # Priming Phase (Lymph Node) : • Antigen-presenting cell (APC) interacts with a naive T cell. • Key molecules involved: MHC, TCR, B7, CD28, CTLA-4, PD-1, PD-L1. • Activation signal: MHC on APC binds TCR on T cell; B7 binds CD28. • Inhibitory signals: CTLA-4 and PD-1 on T cell can bind B7 and PD-L1, respectively, to suppress activation. • Immune checkpoint inhibitors (antibodies) block CTLA-4 and PD-1, preventing inhibitory signals. # Effector Phase (Tumor Tissue) : • Activated T cell interacts with a cancer cell. • Key molecules: MHC, TCR, PD-1, PD-L1. • T cell recognizes cancer cell via MHC-TCR interaction, leading to immune attack. • PD-1 on T cell can bind PD-L1 on tumor cell, inhibiting T cell function. • Immune checkpoint inhibitors block PD-1/PD-L1 interaction, sustaining T cell attack. # Connectors : • Arrow from priming phase to effector phase labeled "Activation & expansion". • Dotted lines connect molecular interactions to cell-level diagrams. # Layout : • Two main panels: left (lymph node, priming phase), right (tumor tissue, effector phase). • Each panel contains a zoomed-in molecular interaction diagram. • Color-coded regions: blue for lymph node, pink for tumor tissue. # Analysis : • The figure demonstrates how immune checkpoint inhibitors (anti-CTLA-4, anti-PD-1, anti-PD-L1 antibodies) block inhibitory signals during both T cell priming and effector phases. • Blocking these checkpoints enhances T cell activation and immune attack against cancer cells, providing a mechanistic basis for cancer immunotherapy. • The process is sequential: initial activation in the lymph node, followed by immune attack in tumor tissue, with checkpoint inhibition acting at both stages.
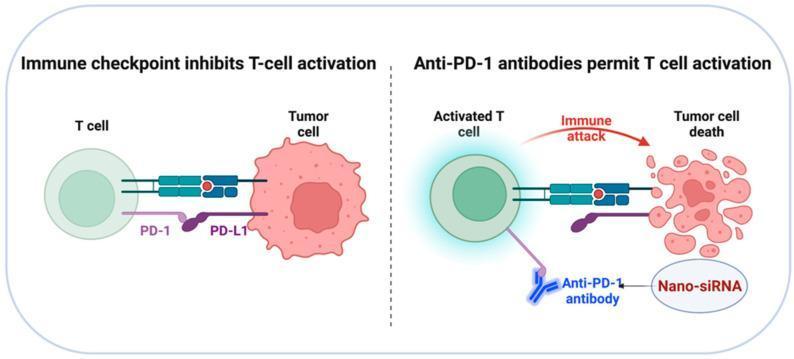
This medical illustration depicts the pathophysiology of immune checkpoint inhibition and the mechanism of PD-1/PD-L1 blockade. The diagram is divided into two comparative panels: 1) 'Immune checkpoint inhibits T-cell activation' (left) shows a T cell interacting with a tumor cell via the binding of Programmed Cell Death Protein 1 (PD-1) on the T cell to Programmed Death-Ligand 1 (PD-L1) on the tumor cell, illustrating an inhibitory signal that prevents T cell activation. 2) 'Anti-PD-1 antibodies permit T cell activation' (right) demonstrates the therapeutic intervention where an anti-PD-1 antibody (Y-shaped blue structure) binds to the PD-1 receptor, blocking its interaction with PD-L1. This blockade results in an 'Activated T cell' (glowing green) that initiates an 'Immune attack' (indicated by a red arrow), leading to tumor cell fragmentation or 'Tumor cell death.' The diagram also features 'Nano-siRNA' as a supplementary delivery system for modulating these pathways. This educational visual represents key concepts in oncology, immunology, and targeted immunotherapy.
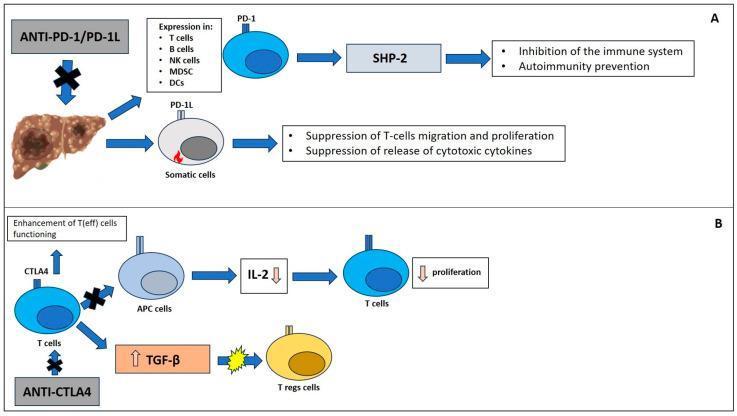
This medical illustration depicts two major immune checkpoint pathways, PD-1/PD-L1 and CTLA-4, in the context of cancer immunology and immunotherapy. Section A illustrates the PD-1/PD-L1 pathway, showing a tumor-burdened liver associated with the expression of PD-1 in various immune cells including T cells, B cells, NK cells, MDSC, and DCs. This signaling involves the tyrosine phosphatase SHP-2, leading to the inhibition of the immune system and prevention of autoimmunity. Simultaneously, PD-L1 expression on somatic cells is shown to suppress T-cell migration, proliferation, and the release of cytotoxic cytokines. Section B details the CTLA-4 pathway, demonstrating how CTLA-4 expression on T cells interacts with Antigen-Presenting Cells (APCs), resulting in decreased IL-2 levels and subsequent inhibition of T-cell proliferation. It also shows the role of CTLA-4 in stimulating TGF-β, which influences Regulatory T cells (Tregs). The diagram highlights the clinical application of Anti-PD-1/PD-L1 and Anti-CTLA-4 therapies (Immune Checkpoint Inhibitors) in enhancing effector T-cell function (T(eff)) for treating malignancies such as hepatocellular carcinoma (HCC).
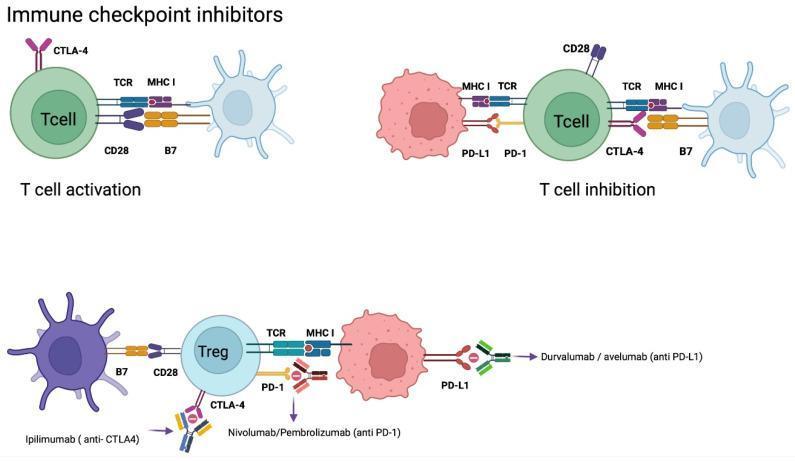
This medical illustration details the mechanism of action of immune checkpoint inhibitors in oncology. The diagram is divided into three functional scenarios: 'T cell activation', 'T cell inhibition', and the application of monoclonal antibodies. In the activation phase, T cells are stimulated via T-cell receptor (TCR) binding to MHC I and co-stimulation of CD28 by B7 on antigen-presenting cells (APCs). The inhibition phase demonstrates how tumor cells evade the immune response: PD-L1 on the tumor cell binds to PD-1 on the T cell, while CTLA-4 competitively binds to B7 with higher affinity than CD28, inducing anergy. The bottom section illustrates therapeutic intervention using checkpoint inhibitors. Monoclonal antibodies target specific pathways: Ipilimumab (anti-CTLA-4) prevents CTLA-4 from binding to B7; Nivolumab and Pembrolizumab (anti-PD-1) block the PD-1 receptor on T cells/T-regs; and Durvalumab and Avelumab (anti-PD-L1) bind to ligands on tumor cells. These interventions disrupt inhibitory signals, restoring the cytotoxic activity of the immune system against the tumor.
PD-L1 in Cancer Therapy
1. Biology of PD-L1
- Goodman & Gilman's, p. 1443
2. PD-L1 vs PD-1: Two Targets, One Pathway
| Target | Mechanism | Approved Drugs |
|---|---|---|
| PD-1 (on T cells) | Block T cell inhibitory receptor | Nivolumab, Pembrolizumab, Cemiplimab, Dostarlimab |
| PD-L1 (on tumor/APCs) | Block ligand on tumor cells | Atezolizumab, Durvalumab, Avelumab |
- Goodman & Gilman's, p. 1443
3. Mechanism of Immune Reactivation
- Anti-CTLA-4 (ipilimumab) acts primarily in the priming phase in lymph nodes - it expands the T cell repertoire and depletes immunosuppressive regulatory T cells (Tregs), lowering the threshold for T cell activation.
- Anti-PD-1/PD-L1 primarily acts in the effector phase within tumor tissue - it reactivates already "exhausted" T cells and may also relieve inhibitory signaling on dendritic cells and NK cells.
- Firestein & Kelley's Textbook of Rheumatology, p. 685-712
4. FDA-Approved Anti-PD-L1 Agents
Atezolizumab (humanized IgG1 anti-PD-L1)
- Approved 2016 (first anti-PD-L1 drug)
- Indications: urothelial carcinoma, NSCLC, SCLC (with carboplatin + etoposide), triple-negative breast cancer (with paclitaxel), hepatocellular carcinoma (with bevacizumab), melanoma (with cobimetinib + vemurafenib)
- High PD-L1 expression is a prerequisite for several indications
- Half-life: 27 days; administered IV every 3 weeks
Durvalumab (anti-PD-L1)
- Approved for locally advanced/metastatic urothelial carcinoma progressing on platinum therapy
- Approved for unresectable stage III NSCLC not progressing after platinum-based chemoradiation
- Also approved in combination with tremelimumab for unresectable hepatocellular carcinoma
Avelumab (anti-PD-L1)
-
Approved for Merkel cell carcinoma (adults and pediatric ≥12 years)
-
Locally advanced/metastatic urothelial carcinoma progressing on platinum
-
First-line renal cell carcinoma in combination with axitinib
-
Katzung's Basic and Clinical Pharmacology, 16th Ed., p. 1538
-
Goodman & Gilman's, p. 1443
5. Clinical Significance by Cancer Type
| Cancer | Key Evidence |
|---|---|
| NSCLC | Pembrolizumab is first-line for high PD-L1 expressors (TPS ≥50%); durvalumab extends progression-free survival in stage III after chemoradiation |
| Urothelial/Bladder | Pembrolizumab improved OS vs chemotherapy (10.3 vs 7.4 months); atezolizumab showed 23% objective response rate as first-line in cisplatin-ineligible patients |
| Melanoma | Nivolumab + ipilimumab combination produces durable responses lasting 10+ years in some patients |
| RCC | PD-L1 expression correlates with poor prognosis; nivolumab improved OS vs everolimus; PBRM1 loss-of-function mutations associate with response to anti-PD-1 |
| Triple-negative breast cancer | Atezolizumab + paclitaxel; neoadjuvant checkpoint inhibitors significantly improve pCR rates (recent meta-analysis, PMID 39207778) |
| Hepatocellular carcinoma | Dual CTLA-4 + PD-L1 blockade; long-term OS benefit confirmed in meta-analysis (Lancet Oncol 2025, PMID 41038207) |
- Campbell Walsh Wein Urology, blocks 32-33; 58; 76
6. PD-L1 as a Biomarker
-
High PD-L1 (measured by immunohistochemistry, various scoring systems: TPS, CPS, IC score) generally predicts better response to anti-PD-1/PD-L1 therapy
-
However, some patients with low or absent PD-L1 still respond, and some high-expressors do not
-
Tumor mutational burden (TMB) and mismatch repair deficiency (dMMR/MSI-H) are complementary biomarkers - dostarlimab and pembrolizumab are approved pan-tumor for dMMR/MSI-H regardless of PD-L1 status
-
TCGA molecular subtypes and mutational load have been validated as additional predictors (e.g., in bladder cancer studies with atezolizumab)
-
Fishman's Pulmonary Diseases, block 22; Campbell Walsh Wein Urology
7. Immune-Related Adverse Events (irAEs)
- Skin: rash, lichenoid eruptions, vitiligo
- Endocrine: thyroiditis, hypophysitis, adrenal insufficiency, new-onset diabetes
- GI: colitis (less common with anti-PD-1/PD-L1 than with anti-CTLA-4)
- Hepatic: immune-mediated hepatitis
- Pulmonary: pneumonitis
- Rare: myocarditis (potentially fatal), neuropathy, lipodystrophy
- Katzung's Basic and Clinical Pharmacology 16th Ed.
- Firestein & Kelley's Rheumatology; Dermatology 2-Volume Set 5e
8. Emerging Strategies and Combinations
- Dual checkpoint blockade: anti-PD-1 + anti-CTLA-4 (nivolumab + ipilimumab) - approved for melanoma, NSCLC, RCC, HCC, CRC (dMMR), mesothelioma. A 2025 Lancet Oncology meta-analysis confirmed significant long-term OS benefit in advanced NSCLC (PMID 41038207)
- Anti-LAG-3: relatlimab (approved 2022 with nivolumab for melanoma) - next generation checkpoint co-inhibition
- Anti-TIM-3, anti-TIGIT: multiple agents in trials
- Neoadjuvant use: checkpoint inhibitors before surgery are now showing major improvements in pathological complete response rates in breast cancer (PMID 39207778)
- Combination with targeted therapy: atezolizumab + bevacizumab (HCC); avelumab + axitinib (RCC) exploit complementary mechanisms
- Sensitization strategies: radiotherapy, anti-VEGF, PARP inhibitors, and epigenetic agents are under investigation to increase PD-L1 expression and immune infiltration in "cold" tumors