I now have comprehensive content from multiple authoritative textbooks. Let me compile the full response.
Motor Neuron Disease (MND)
Definition and Spectrum
"Motor neuron disease" (MND) - coined by Brain in 1969 - refers specifically to a disorder of both upper and lower motor neurons, essentially synonymous with amyotrophic lateral sclerosis (ALS). More broadly, "motor neuron diseases" (plural) encompasses the whole family of disorders affecting the upper and/or lower motor neuron system. - Bradley and Daroff's Neurology in Clinical Practice
MND comprises a group of progressive degenerative disorders of motor neurons in the spinal cord, brainstem, and motor cortex, manifesting as muscular weakness, atrophy, and corticospinal tract signs in varying combinations. It is predominantly a disease of middle life, progressing to death within 2-5 years (or longer in exceptional cases). - Adams and Victor's Principles of Neurology, 12th Ed.
Classification of Motor Neuron Diseases
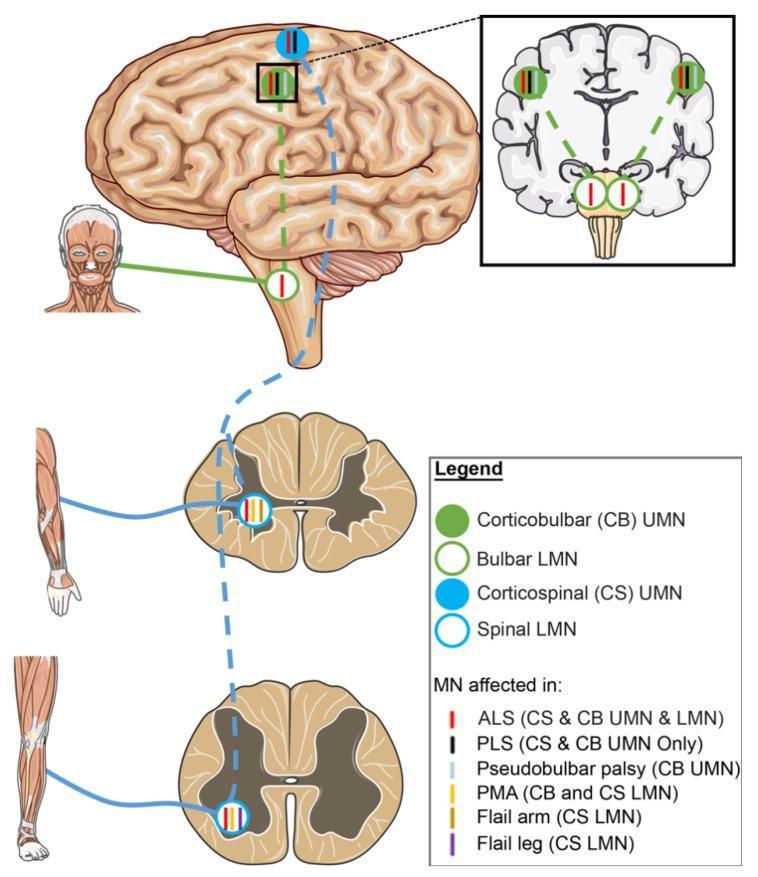
| Subtype | Motor Neurons Affected | Key Features |
|---|
| ALS (Classic) | UMN + LMN | Amyotrophy + hyperreflexia + spasticity |
| Progressive Muscular Atrophy (PMA) | LMN only | Weakness + wasting, no UMN signs |
| Progressive Bulbar Palsy | Bulbar LMN | Jaw/face/tongue/pharynx/larynx weakness |
| Primary Lateral Sclerosis (PLS) | UMN only | Spastic weakness, hyperreflexia, Babinski signs |
| Pseudobulbar Palsy | Corticobulbar UMN | Emotional lability, dysarthria, dysphagia |
| Spinal Muscular Atrophy (SMA) | LMN (spinal) | Childhood onset; SMN gene mutations |
| Kennedy's Disease (SBMA) | LMN + androgen receptor | X-linked; gynecomastia, sensory neuropathy |
Amyotrophic Lateral Sclerosis (ALS) - The Prototype
ALS (also called Lou Gehrig disease) is the most common form of MND. Charcot originally described it between 1869-1874. - Harrison's Principles of Internal Medicine, 22E
Epidemiology
- Incidence: ~2/100,000/year; prevalence ~5-7/100,000
- Peak onset: 55-65 years (familial forms slightly younger)
- Male:female ratio ~1.5:1 in sporadic; approaches 1:1 in familial
- Bulbar onset: ~25-30% of cases; worse prognosis
- Median survival: 2-3 years; ~20% survive to 5 years; ~10% survive to 10 years
- Poor prognostic factors: bulbar onset, older age, certain genotypes (e.g., C9orf72)
Pathology
The hallmarks of ALS are:
- Degeneration and loss of motor neurons with astrocytic gliosis and microglial proliferation
- UMN: Loss of Betz cells from Brodmann area 4; axonal loss in corticospinal tracts
- LMN: Loss of anterior horn cells in spinal cord and brainstem motor nuclei
- Intraneuronal inclusions: TDP-43-positive and FUS-positive ubiquitinated inclusions
- Bunina bodies: Small eosinophilic cytoplasmic inclusions (characteristic)
- Spheroids: Focal enlargements in proximal motor axons (neurofilament accumulations)
- Extramotor pathology may occur in frontotemporal cortex, hippocampus, thalamus, substantia nigra
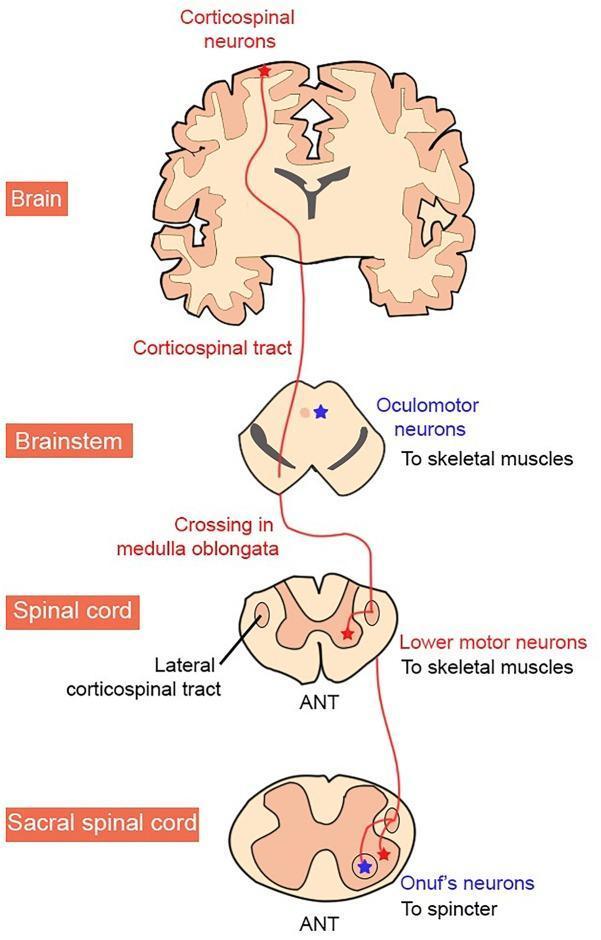
Notably, oculomotor neurons and Onuf's neurons (sacral sphincter control) are characteristically spared in ALS. - Harrison's, Bradley & Daroff's
Clinical Features
Upper Motor Neuron Signs
- Spasticity, hyperreflexia
- Pseudobulbar affect (emotional lability)
- Babinski sign
- Slow, spastic dysarthria
- Jaw jerk (brisk)
Lower Motor Neuron Signs
- Muscle weakness and wasting (amyotrophy)
- Fasciculations (visible twitching under skin)
- Hyporeflexia (in pure LMN areas)
- Flaccid dysarthria, dysphagia, dysphonia (bulbar)
- Cramps
Key Features
- No sensory involvement (sensory pathways are spared)
- No autonomic dysfunction (bladder/bowel intact until very late)
- No eye movement disorder (oculomotor nuclei spared)
- Cognitive changes: ~15% develop frank FTD; up to 50% have subtle frontal deficits
Genetics
Between 5-10% of ALS is familial (FALS); classified ALS1-ALS25. Major genes:
| Gene | Inheritance | % of FALS | Mechanism |
|---|
| C9orf72 | AD | ~40% of FALS; ~7% sporadic | Hexanucleotide (GGGGCC) repeat expansion; RNA toxicity, nucleocytoplasmic transport defect |
| SOD1 | AD (mostly), AR | 15-20% of FALS | Toxic gain-of-function; oxidative stress, protein aggregation |
| TDP-43 (TARDBP) | AD | ~4% | RNA processing defects; nuclear-to-cytoplasmic mislocalization |
| FUS/TLS | AD | ~4% | RNA processing; nuclear-cytoplasmic shuttling disruption |
| UBQLN2 | X-linked | Rare | Ubiquitin-proteasome pathway |
The C9orf72 mutation (hexanucleotide expansion >30 repeats - up to thousands) is the most common genetic cause. It can present as pure ALS, ALS-FTD overlap, or pure behavioral variant FTD. Penetrance increases with age (approaches 100% above age 80). - Bradley and Daroff's
Pathogenesis
Three broad mechanistic categories:
- Protein instability / degradation failure - mutant SOD1, ubiquitin; protein aggregation
- RNA processing defects - C9orf72 (hexanucleotide repeat RNA foci, toxic dipeptides), TDP-43, FUS/TLS
- Axonal cytoskeleton and transport failure - dynactin, profilin-1
Additional mechanisms:
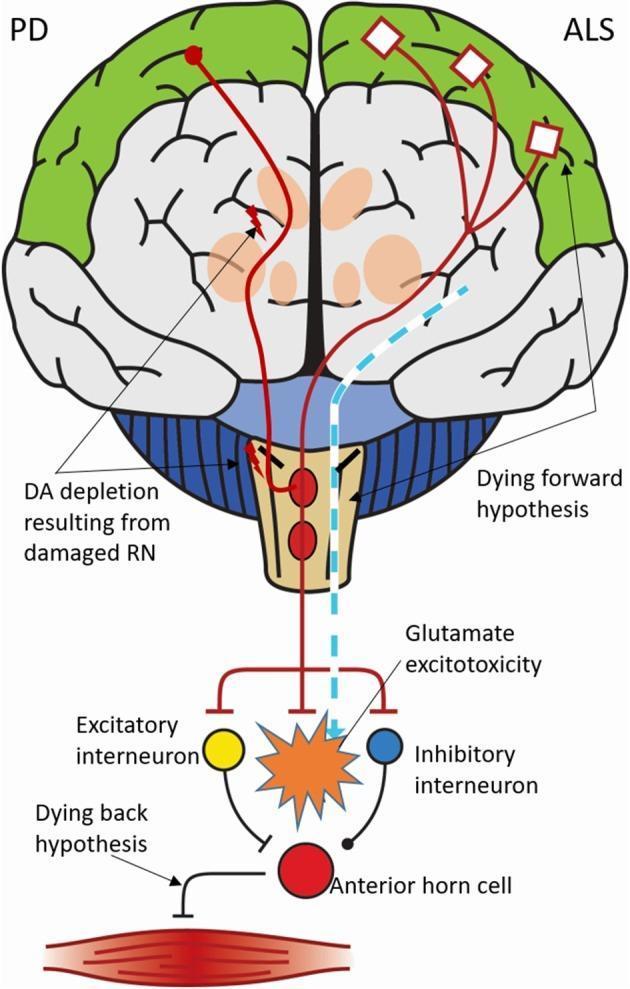
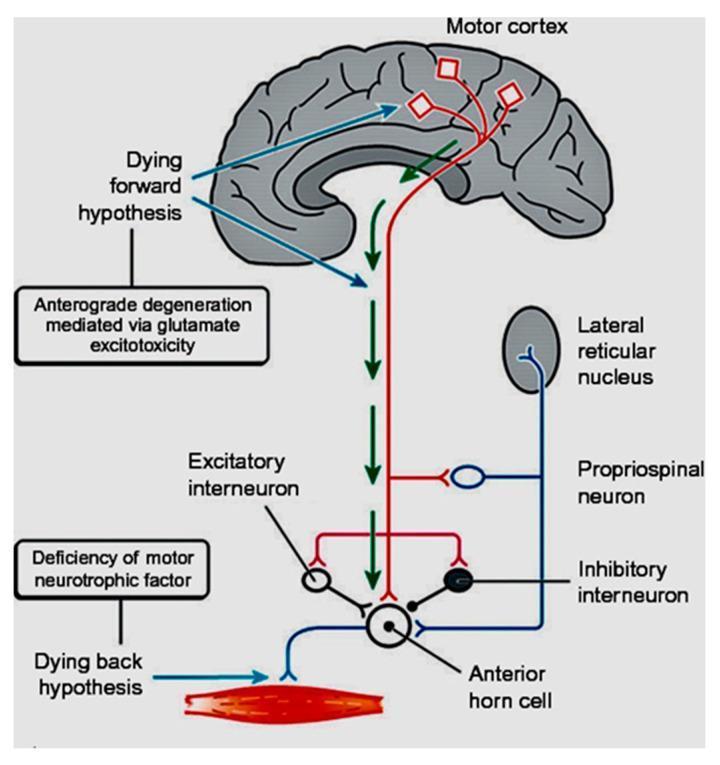
- Glutamate excitotoxicity ("dying forward" hypothesis - cortical origin via glutamate release)
- Oxidative stress
- Mitochondrial dysfunction
- Neuroinflammation: Activated microglia and astrocytes accelerate disease
- Defective autophagy
- Neuromuscular junction failure ("dying back" hypothesis - peripheral origin)
Diagnosis
The El Escorial criteria (1990, revised Airlie House 1998) classify ALS into five categories based on UMN and LMN signs across four regions (bulbar, cervical, thoracic, lumbosacral): - Bradley and Daroff's
| Category | Criteria |
|---|
| Definite ALS | UMN + LMN signs in ≥3 regions |
| Probable ALS | UMN + LMN signs in 2 regions, some UMN rostral to LMN |
| Probable ALS, lab-supported | UMN + LMN in 1 region, UMN alone in another + EMG LMN involvement in ≥2 limbs |
| Possible ALS | UMN + LMN in 1 region only; or UMN alone in ≥2 regions; or LMN rostral to UMN |
| Familial ALS | UMN or LMN signs in ≥1 region + disease-causing gene mutation |
Key Investigations
- EMG/NCS: Denervation (fibrillations, positive sharp waves, fasciculation potentials) in multiple regions; nerve conduction normal (distinguishes from neuropathy)
- MRI brain & spine: Exclude structural causes (spondylosis, Chiari malformation, tumors, AVM)
- Pulmonary function: FVC (erect and supine), MIP, sniff nasal pressure - supine FVC is more sensitive for diaphragmatic weakness
- CSF: Exclude inflammatory/infectious causes
- Genetic testing: SOD1, C9orf72, TDP-43, FUS panel
- Serum: Heavy metals, anti-GM1 antibodies, HTLV-1 titer, paraprotein screen
Mimics to Exclude
| Category | Examples |
|---|
| Structural | Cervical spondylosis, foramen magnum tumor, Chiari malformation, syrinx |
| Infectious | Polio, Lyme, HIV myelopathy, HTLV-1 |
| Toxic/metabolic | Lead, aluminum, strychnine |
| Immunologic | Motor neuropathy with conduction block, plasma cell dyscrasia |
| Genetic | Kennedy's disease, adult Tay-Sachs, hexosaminidase-A deficiency |
Treatment
Disease-Modifying Drugs
| Drug | Mechanism | Effect |
|---|
| Riluzole 100 mg/day | Reduces glutamate excitotoxicity (diminishes glutamate release) | ~2-3 months survival extension; first approved drug |
| Edaravone | Antioxidant (free radical scavenger) | Modest slowing of disability progression (IV or oral) |
| Tofersen (ASO) | Antisense oligonucleotide targeting SOD1 mRNA; intrathecal delivery | FDA approved for SOD1-mediated ALS; reduces SOD1 protein |
Additional promising targets under investigation: ASOs targeting FUS/TLS, C9orf72; stem cell therapies; small molecules; immunosuppression.
Supportive and Rehabilitative Care
- Respiratory: Non-invasive positive pressure ventilation (NIPPV) for hypoventilation; cough-assist device prevents aspiration pneumonia; tracheostomy for long-term ventilation
- Nutritional: Gastrostomy (PEG) when dysphagia impairs nutrition - ideally placed while FVC >50%
- Communication: Speech synthesizers, augmentative/alternative communication devices
- Mobility: Foot-drop splints, finger-extension splints, wheelchair
- Multidisciplinary ALS clinic: Neurologist, physiotherapist, occupational therapist, speech therapist, respiratory physician, nutritionist, palliative care
- Palliative/Hospice: End-of-life planning, symptom management (pain, secretions, anxiety), hospice care affirms dignity and independence
Other MND Variants
- Kennedy's Disease (X-SBMA): X-linked; CAG repeat expansion in androgen receptor gene; LMN only + androgen insensitivity (gynecomastia, reduced fertility); no UMN signs; subtle sensory neuropathy distinguishes from ALS
- Spinal Muscular Atrophy (SMA): SMN gene mutations; types I-IV; autosomal recessive; childhood onset (SMA I = Werdnig-Hoffmann); LMN only
- ALS-FTD Overlap: ~15% of ALS; degeneration of frontotemporal neurons; most commonly associated with C9orf72 expansion
- Western Pacific ALS (ALS-PDC): Guam/Marianas; ALS-Parkinsonism-Dementia complex; declining incidence; proposed environmental trigger
Summary Points
- MND = group of disorders; ALS = classic form with combined UMN + LMN involvement
- ALS is relentlessly progressive and almost universally fatal; median survival 2-3 years
- TDP-43 inclusions are the pathological hallmark of sporadic ALS; Bunina bodies are classic
- C9orf72 hexanucleotide expansion is the single most common genetic cause (~40% FALS)
- Riluzole, edaravone, and tofersen (SOD1-ALS) are the currently approved disease-modifying agents
- Management is multidisciplinary, focusing on maintaining function, respiratory support, nutrition, and quality of life
- Always exclude treatable mimics (cervical myelopathy, conduction block neuropathy, inflammatory disorders)
Sources: Adams and Victor's Principles of Neurology 12th Ed. | Harrison's Principles of Internal Medicine 22E | Bradley and Daroff's Neurology in Clinical Practice | Robbins & Kumar Basic Pathology
Recent literature note: A 2025 systematic review (
PMID 41395267) on ALS biomarkers highlights emerging utility of neurofilament light chain (NfL) and dipeptide repeat proteins from C9orf72 as trial biomarkers, which may soon inform prognosis and treatment response monitoring.