
Renal function test for 6 marks biochem
Reading File
Now let me search the library for renal function tests content:
Finding Sources
Finding Sources
Harper's Biochemistry has a dedicated "Tests of Kidney Function" section. Let me read that, along with the NKF Primer content:
Reading File
Finding Sources
I can see the content is being truncated. Let me read the full Tests of Kidney Function section:
Reading File
Finding Sources
Let me also pull content from Henry's Clinical Diagnosis (which has detailed biochem lab content) and check for urine specific gravity / osmolality / other RFT tests:
Reading File
Finding Sources
Now let me read the comprehensive nephrology content for the clearance concept and also get data on urine concentration tests and proteinuria:
Reading File
Reading File
I now have comprehensive content from multiple authoritative sources. Let me compile the complete 6-mark biochemistry answer on Renal Function Tests.
Renal Function Tests (RFTs) - 6 Marks
Renal function tests are a group of biochemical investigations that assess the functional status of the kidneys across three main domains: glomerular filtration, tubular function, and renal blood flow.
Classification of RFTs
| Category | Tests |
|---|---|
| Glomerular function | Blood urea nitrogen (BUN), Serum creatinine, Creatinine clearance, Inulin clearance |
| Tubular function | Urine concentration test, Urine dilution test, Urine pH, Urine osmolality |
| Urinalysis | Proteinuria, Microalbuminuria, Urine specific gravity |
1. Blood Urea Nitrogen (BUN)
- Urea is the end product of ammonia metabolism in the liver (urea cycle).
- Urea is filtered at the glomerulus and excreted by the renal tubules at a rate proportional to GFR: BUN ∝ 1/GFR.
- Normal range: 10-20 mg/dL.
- Elevated BUN occurs in both prerenal (reduced renal blood flow) and renal/postrenal disease.
- Limitations: BUN is affected by non-renal factors - high protein diet, fever, GI bleeding, liver disease, and catabolic states all raise BUN independently of renal function. Therefore, it is not a specific marker of renal function alone.
2. Serum Creatinine
- Creatinine is a breakdown product of creatine phosphate in muscle. It is produced at a relatively constant rate proportional to muscle mass.
- It is freely filtered at the glomerulus and secreted (and reabsorbed) by tubules to approximately equal extent, so net excretion mirrors filtration.
- Normal range: ~0.5-1.2 mg/dL (reference: ~0.5-1.0 mg/dL by some sources).
- Creatinine is a more specific marker than urea because its serum level is not significantly affected by dietary protein or liver disease.
- Key limitation: Serum creatinine rises significantly (becomes abnormal) only after approximately a 50% decline in GFR - making it an insensitive early marker.
BUN : Creatinine Ratio
| Ratio | Interpretation |
|---|---|
| 10:1 to 20:1 | Normal; also seen in true renal disease |
| >20:1 | Prerenal azotemia (e.g., renal artery stenosis, volume depletion) |
| <10:1 | Liver disease, low protein diet |
- In prerenal disease: BUN rises disproportionately (tubular urea reabsorption increases with low flow), while creatinine stays near normal.
- In intrinsic renal and postrenal disease: both BUN and creatinine rise together.
3. Creatinine Clearance (CrCl) - Estimation of GFR
Clearance is the volume of plasma completely cleared of a substance by the kidney per unit time.
Formula:
Clearance (mL/min) = (U × V) / P
- U = urinary creatinine concentration (mg/dL)
- V = urine volume per minute (mL/min) - calculated from 24-hour urine collection divided by 1440
- P = plasma creatinine concentration (mg/dL)
This equation also gives GFR: GFR = CrCl = Ucr × V / Pcr
- Normal CrCl: ~90-120 mL/min (males); slightly lower in females.
- Creatinine clearance overestimates GFR slightly because creatinine is secreted by the renal tubules to a small extent.
- Creatinine clearance can detect early-stage renal failure, unlike serum creatinine alone.
Cockcroft-Gault formula (estimated CrCl from serum creatinine without urine collection):
CrCl = [(140 - Age) × Weight (kg)] / [72 × Serum Creatinine (mg/dL)] × (×0.85 for females)
4. Inulin Clearance - Gold Standard for GFR
- Inulin is an exogenous polyfructose compound that is:
- Freely filtered at the glomerulus
- Not reabsorbed or secreted by the tubules
- Not metabolized by the kidney
- Therefore, inulin clearance = true GFR.
- Why not used routinely: Inulin must be infused intravenously at a constant rate - it is cumbersome and impractical for clinical use.
- Other exogenous markers: Iothalamate (¹²⁵I), ⁹⁹ᵐTc-DTPA, ⁵¹Cr-EDTA, Iohexol - all used in research settings.
5. Urinalysis and Proteinuria
- A complete urinalysis includes: urine volume, odor, color, appearance (turbidity), specific gravity, pH.
- Protein: Normally <150 mg/day total protein, <30 mg/day albumin - undetectable by routine tests.
- Proteinuria (>150 mg/day): sign of glomerular basement membrane damage.
- Microalbuminuria: 30-300 mg albumin/24 hours - early marker of renal damage in diabetes mellitus and hypertension.
- Macroalbuminuria: >300 mg/day - established nephropathy.
- Urine protein electrophoresis distinguishes:
- Nephrotic pattern - only albumin (minimal change disease)
- Nephritic pattern - multiple protein bands (morphological glomerular damage)
6. Tubular Function Tests
- Urine concentration test (water deprivation test): Urine osmolality should rise to >800 mOsm/kg; specific gravity >1.020 after fluid deprivation. Failure indicates tubular dysfunction or diabetes insipidus.
- Urine dilution test: After water load, normal kidney dilutes urine to specific gravity <1.003. Failure indicates tubular impairment.
- Urine specific gravity: Normal 1.003-1.030; reflects tubular concentrating ability.
Summary Table
| Test | What it Measures | Normal Value | Clinical Use |
|---|---|---|---|
| BUN | Glomerular filtration (indirect) | 10-20 mg/dL | Screening; affected by non-renal factors |
| Serum Creatinine | Glomerular filtration (indirect) | 0.5-1.2 mg/dL | Specific but insensitive (rises after 50% GFR loss) |
| Creatinine Clearance | GFR estimate | 90-120 mL/min | Detects early renal failure |
| Inulin Clearance | True GFR (gold standard) | ~120 mL/min | Research only (IV infusion required) |
| Microalbuminuria | Early glomerular damage | 30-300 mg/24h | Early diabetic nephropathy |
| Urine concentration test | Tubular function | Osmolality >800 mOsm/kg | Tubular integrity |
Sources: Harper's Illustrated Biochemistry, 32nd Ed. | Henry's Clinical Diagnosis and Management by Laboratory Methods | Comprehensive Clinical Nephrology, 7th Ed.
Protein energy malnutrition 6 marks
Finding Sources
Finding Sources
Excellent - Lippincott Biochemistry and Park's PSM are the most relevant. Let me read both simultaneously:
Reading File
Reading File
Let me also get the Kwashiorkor/Marasmus comparison from Park's PSM and the biochemical changes from Lippincott or Harper's:
Reading File
Finding Sources
Now let me get the biochemical/metabolic changes and also check the Harper's Biochemistry for PEM content:
Finding Sources
Finding Sources
Let me fetch the image from the Lippincott text and also read the Sleisenger GI book for clinical details:
Reading File
Reading File
I have comprehensive content. Let me fetch the clinical image from Lippincott to include visually:
Loading Image
I now have all the content needed for a thorough 6-mark answer. Here it is:
Protein-Energy Malnutrition (PEM) - 6 Marks
Definition
Protein-energy malnutrition (PEM), also called protein-energy undernutrition (PEU), is a spectrum of nutritional disorders resulting from inadequate intake of protein, calories, or both, leading to deficiencies in body composition, growth, and metabolic function. It is the most prevalent nutritional deficiency worldwide and a major public health problem, estimated to underlie ~30% of deaths in children under 5 years in developing countries.
Etiology / Types
Primary PEM - inadequate dietary intake (poverty, food insecurity, poor weaning practices)
Secondary PEM - caused by disease or injury that:
- Increases metabolic demands (sepsis, burns, surgery)
- Impairs absorption (ileal disease, malabsorption)
- Induces anorexia or catabolism
Two Major Clinical Forms
PEM exists as a spectrum with two extreme poles:
1. Kwashiorkor
- Cause: Protein deprivation is relatively greater than caloric reduction.
- The word "Kwashiorkor" means "the disease the child gets when the next baby is born" (displaced from breast to carbohydrate-based weaning diet).
- Typical age: ~1-3 years, after weaning onto carbohydrate-predominant diet.
- Because carbohydrate intake is relatively preserved, insulin levels remain relatively higher, suppressing lipolysis and proteolysis. This is termed "nonadapted" malnutrition - the body cannot adequately mobilize fat stores.
- Key features:
- Bilateral pitting edema (hallmark) - due to hypoalbuminemia; plasma oncotic pressure falls, water shifts to interstitial space
- Fatty liver (hepatomegaly) - impaired lipoprotein synthesis (↓ apoprotein B) → fat cannot be exported from liver
- Hypoalbuminemia - severely decreased visceral protein synthesis
- Stunted growth (weight-for-age: 60-80% of expected)
- Skin changes: hyperpigmented, peeling ("flaky paint" dermatosis)
- Hair changes: depigmented, reddish, easily pluckable ("flag sign")
- Apathy, anorexia, irritability
- Muscle wasting (may be masked by edema)
- Depressed immune function → susceptibility to infection
2. Marasmus
- Cause: Calorie deprivation is relatively greater than protein reduction (both protein and energy deficient, but total starvation predominates).
- Typical age: <1 year, when breast milk is replaced by dilute cereal gruels.
- This is termed "adapted" malnutrition - with prolonged starvation, the body adapts by:
- ↓ Insulin, ↑ Glucagon → enhanced lipolysis and fat mobilization
- Using fat as primary energy source; sparing protein relatively
- Key features:
- Severe emaciation - extreme wasting of muscle and subcutaneous fat (weight-for-age: <60%)
- No edema (serum albumin may be near normal or mildly reduced)
- Loose wrinkled skin ("old man appearance")
- Prominent ribs and bones
- Arrested growth, weakness, anemia
- No fatty liver (fat stores are mobilized)
- No hair/skin pigment changes (unlike kwashiorkor)
3. Marasmic Kwashiorkor
- Mixed form with features of both - severe wasting AND edema. Seen when a marasmic child develops acute illness.
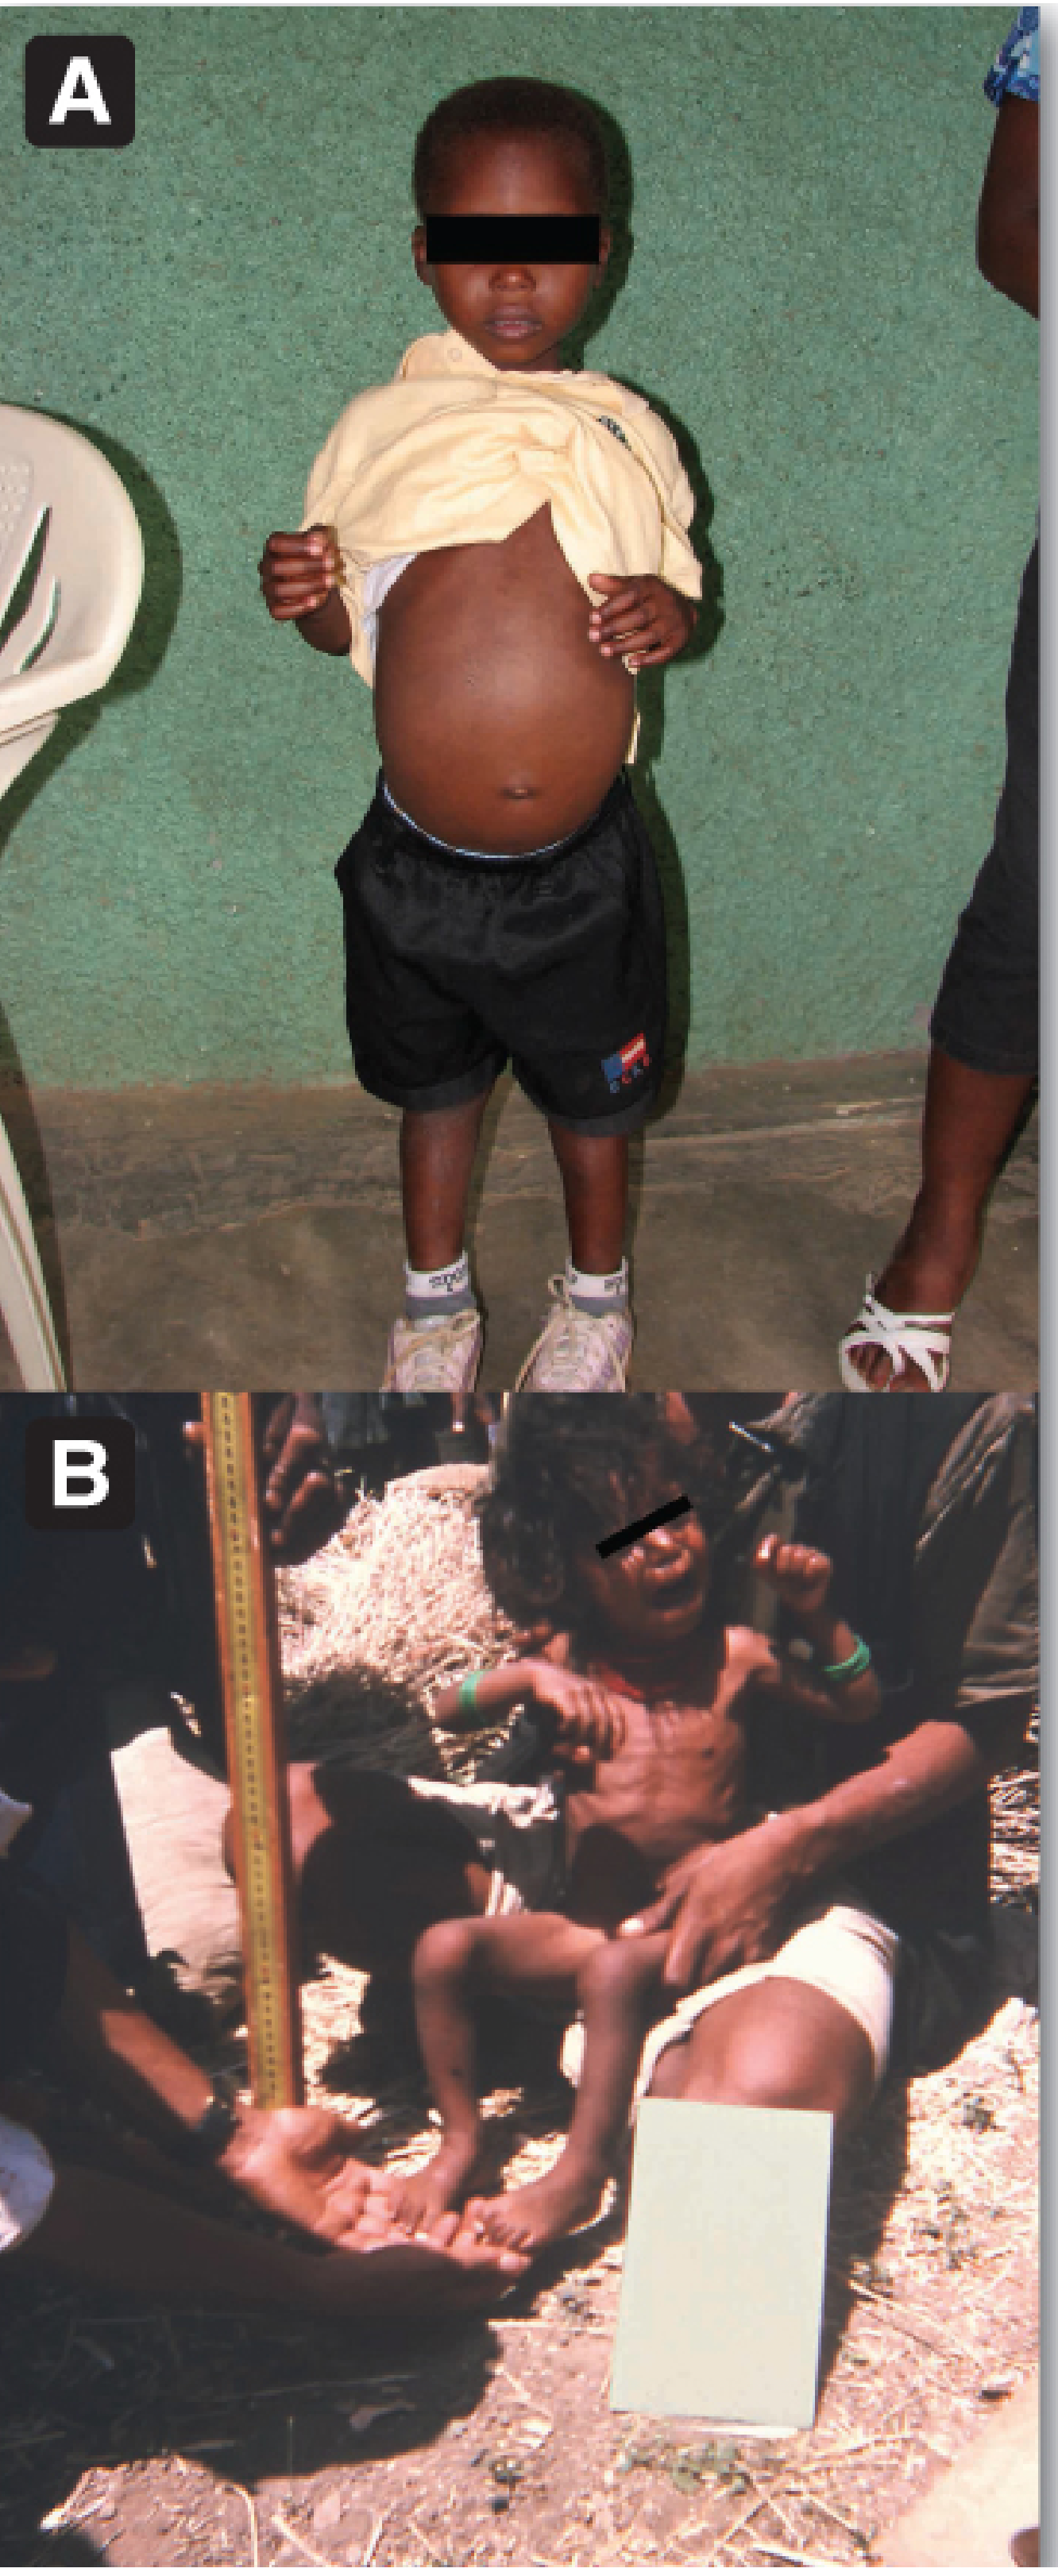
Comparison Table: Kwashiorkor vs Marasmus
| Feature | Kwashiorkor | Marasmus |
|---|---|---|
| Primary deficiency | Protein (with adequate calories) | Total calories + protein |
| Age of onset | 1-3 years (post-weaning) | <1 year |
| Body weight (% expected) | 60-80% | <60% |
| Edema | Present (bilateral pitting) | Absent |
| Subcutaneous fat | Reduced | Markedly reduced / absent |
| Muscle wasting | Present (masked by edema) | Severe |
| Serum albumin | Markedly decreased | Near normal or mildly ↓ |
| Fatty liver | Present | Absent |
| Skin/hair changes | Depigmentation, dermatosis | Usually absent |
| Appetite | Poor (anorexia) | Often ravenous |
| Metabolic type | Nonadapted (insulin relatively preserved) | Adapted (↓ insulin, ↑ fat mobilization) |
Biochemical Changes in PEM
| Parameter | Kwashiorkor | Marasmus |
|---|---|---|
| Serum albumin | Markedly ↓ | Mildly ↓ or normal |
| Serum transferrin | ↓ | Mildly ↓ |
| Blood glucose | Often low | Low (hypoglycemia) |
| Plasma amino acids | ↓ (essential AAs particularly) | ↓ |
| Serum lipids | ↑ (fatty liver; ↓ apo-B synthesis) | ↓ (fat mobilized) |
| Insulin | Relatively preserved | Markedly ↓ |
| Glucagon | Normal or ↑ | Markedly ↑ |
| Immune function | Depressed (↓ T-cells, ↓ complement) | Depressed |
Early Detection (Assessment Tools)
- Growth chart (weight-for-age): The first and most practical indicator.
- Mid-upper arm circumference (MUAC):
-
13.5 cm = satisfactory
- 12.5-13.5 cm = mild-moderate malnutrition
- <12.5 cm = severe malnutrition
-
- Weight-for-height (wasting index): Reflects current acute malnutrition
- Height-for-age (stunting): Reflects chronic/cumulative malnutrition
Prevention
- Promote exclusive breastfeeding up to 6 months; appropriate weaning foods thereafter
- Protein- and energy-rich weaning diet (eggs, milk, pulses, cereals)
- Nutrition education for mothers
- Family planning and birth spacing
- Immunization (prevents infections that precipitate PEM)
- Food fortification and supplementation programs
- Periodic growth monitoring and surveillance
Sources: Lippincott Illustrated Reviews: Biochemistry, 8th Ed. | Park's Textbook of Preventive and Social Medicine | Sleisenger & Fordtran's Gastrointestinal and Liver Disease
This is a shared conversation. Sign in to Orris to start your own chat.