
Explained in easy way , include indication, mode , settings, all waveform with figure and diagram, stop or wean off, all things thoroughly and indetailed,
python3 << 'EOF' import pdfplumber files = { "modes": "/tmp/workspace/attachments/8c71e19f-d9b5-49cc-9619-6903d3b8c8ab/Modes_of_Mechanical_Ventilation.pdf", "waveforms": "/tmp/workspace/attachments/8c71e19f-d9b5-49cc-9619-6903d3b8c8ab/Ventilator_Waveforms.pdf", "discontinuation": "/tmp/workspace/attachments/8c71e19f-d9b5-49cc-9619-6903d3b8c8ab/Discontinuation_of_Mechanical_Ventilation.pdf" } for name, path in files.items(): print(f"\n{'='*60}") print(f"FILE: {name.upper()}") print('='*60) with pdfplumber.open(path) as pdf: print(f"Total pages: {len(pdf.pages)}") for i, page in enumerate(pdf.pages): text = page.extract_text() if text: print(f"\n--- PAGE {i+1} ---") print(text[:3000]) EOF
python3 << 'EOF' from pypdf import PdfReader files = { "modes": "/tmp/workspace/attachments/8c71e19f-d9b5-49cc-9619-6903d3b8c8ab/Modes_of_Mechanical_Ventilation.pdf", "waveforms": "/tmp/workspace/attachments/8c71e19f-d9b5-49cc-9619-6903d3b8c8ab/Ventilator_Waveforms.pdf", "discontinuation": "/tmp/workspace/attachments/8c71e19f-d9b5-49cc-9619-6903d3b8c8ab/Discontinuation_of_Mechanical_Ventilation.pdf" } for name, path in files.items(): reader = PdfReader(path) print(f"\n{name}: {len(reader.pages)} pages") # Check first page for text page = reader.pages[0] text = page.extract_text() print(f" First page text sample: {repr(text[:200]) if text else 'NO TEXT - image-based PDF'}") # Check for images try: images = list(page.images) print(f" Images on page 1: {len(images)}") except Exception as e: print(f" Image check error: {e}") EOF
mechanical ventilation modes pressure volume waveforms diagram
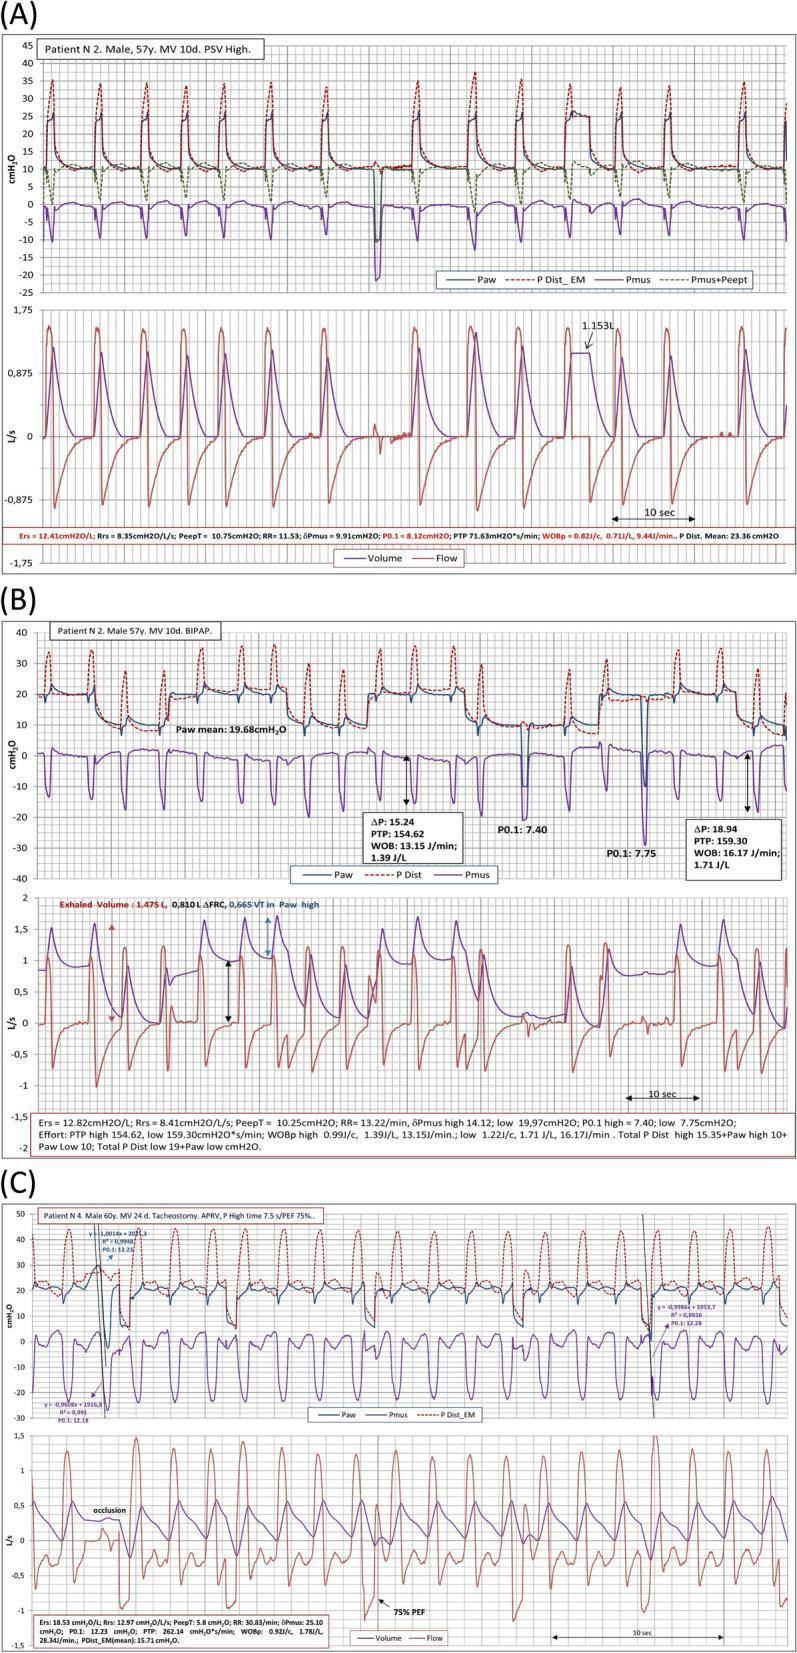
This physiological monitoring graphic displays mechanical ventilation waveforms across three distinct modes: Pressure Support Ventilation (PSV) in panel A, Biphasic Positive Airway Pressure (BIPAP) in panel B, and Airway Pressure Release Ventilation (APRV) in panel C. Each panel illustrates time-synced tracings of airway pressure (Paw), muscle pressure (Pmus), distending pressure (PDist_EM), flow (L/s), and tidal volume (L). In PSV (A), the waveforms show regular, patient-triggered breaths with stable tidal volumes and consistent Pmus deflections. BIPAP (B) reveals two levels of baseline pressure with significant spontaneous effort (negative Pmus) during the lower pressure phase, resulting in more variable flow and volume patterns. APRV (C) demonstrates prolonged high-pressure phases with brief releases, characterized by high respiratory drive and frequent, irregular spontaneous breathing efforts superimposed on the ventilator cycle. Key metrics provided below the graphs include respiratory system elastance (Ers), airway occlusion pressure (P0.1), and patient work of breathing (WOBp), used to analyze patient-ventilator synchrony and inspiratory effort in critically ill patients, such as those with COVID-19 ARDS.
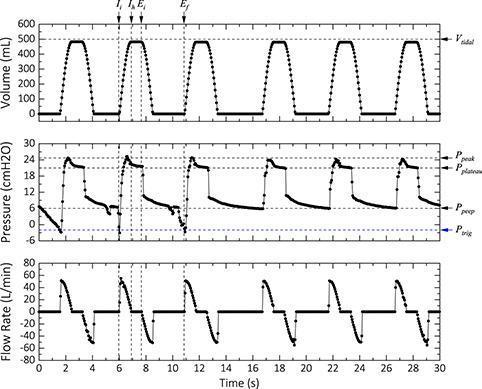
This diagnostic graphic displays three stacked ventilator waveforms (Volume, Pressure, and Flow Rate) over a 30-second interval, demonstrating mechanical ventilation in assisted mode. The top graph shows Tidal Volume (Vt) pulsing consistently to approximately 500 mL with a distinct plateau indicating an end-inspiratory hold. The middle Pressure-time waveform illustrates critical respiratory parameters: a negative deflection reaching the trigger pressure (Ptrig) of -2 cmH2O initiates each breath, followed by a rapid rise to a peak inspiratory pressure (Ppeak) of ~25 cmH2O. An inspiratory hold reveals a plateau pressure (Pplateau) of ~22 cmH2O, with the cycle concluding at a positive end-expiratory pressure (PEEP) of ~5 cmH2O. The bottom Flow Rate graph displays corresponding inspiratory and expiratory flow pulses. Annotations mark key temporal points: initial inspiration (Ii), inspiratory hold (Ih), end-inspiration (Ei), and end-expiration (Ef). This visualization is essential for understanding ventilator-patient synchrony, mechanical lung properties (compliance and resistance), and the functioning of pressure-triggered assisted ventilation modes.
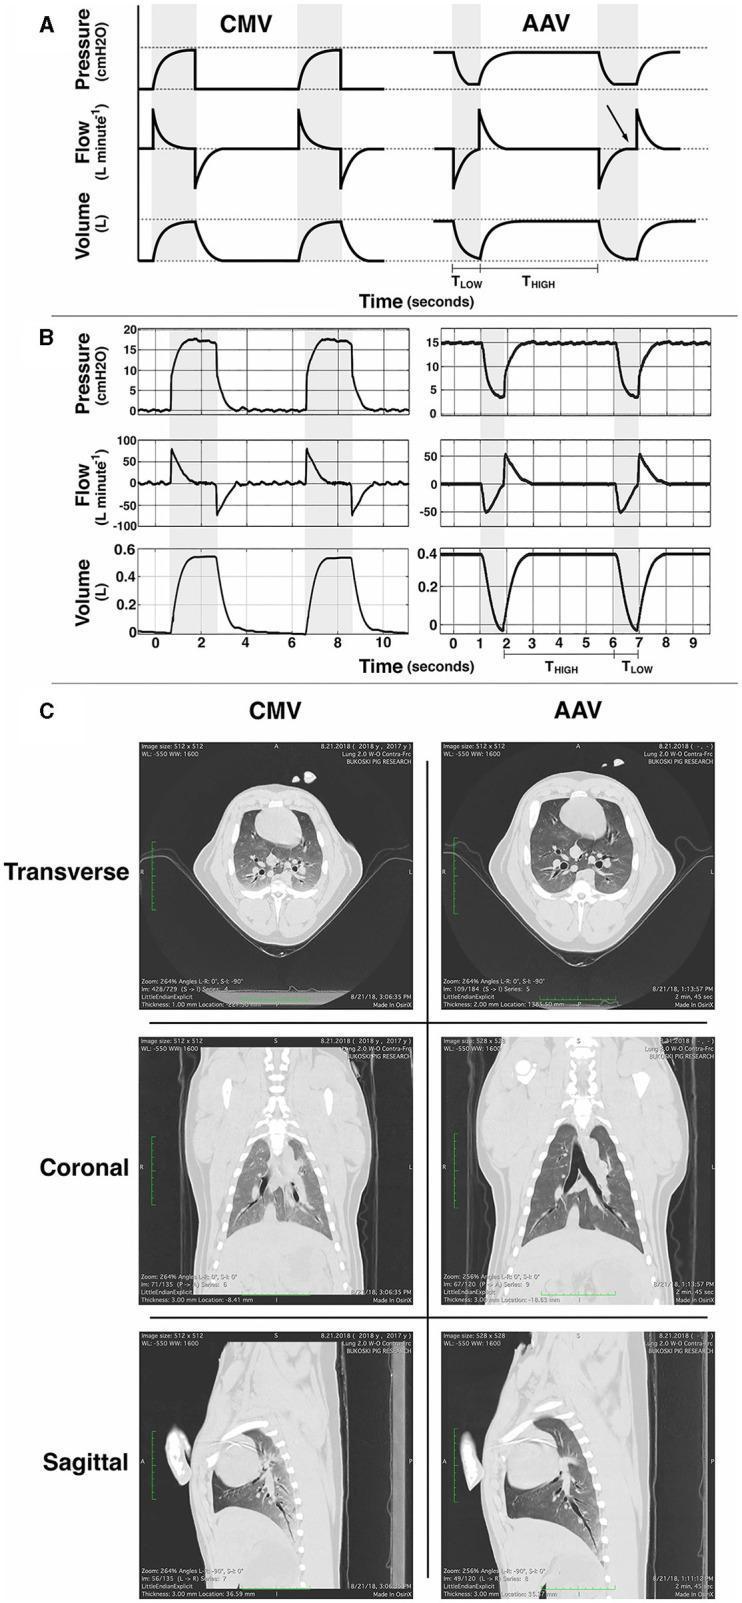
This multi-panel figure illustrates a comparative analysis of two mechanical ventilation modes: Conventional Mechanical Ventilation (CMV) and Apneustic Anesthesia Ventilation (AAV). Section A provides idealized schematic waveforms for pressure, flow, and volume over time. CMV is characterized by intermittent pressure increases from baseline, while AAV (similar to Airway Pressure Release Ventilation or APRV) maintains an elevated baseline pressure (PHIGH) for a prolonged duration (THIGH) with brief, rapid releases to a lower pressure (PLOW) during a shorter interval (TLOW). Section B displays corresponding real-time example waveforms, highlighting that AAV maintains higher lung volumes throughout the respiratory cycle. Section C presents thoracic computed tomography (CT) scans in transverse, coronal, and sagittal planes, comparing lung recruitment and aeration between modes. The AAV images demonstrate improved lung inflation and more uniform density across the parenchyma compared to CMV, where areas of increased dependent opacification suggest potential atelectasis. This resource is designed for critical care and anesthesia education, focusing on respiratory physiology, ventilator waveform analysis, and the impact of ventilation strategies on pulmonary recruitment.
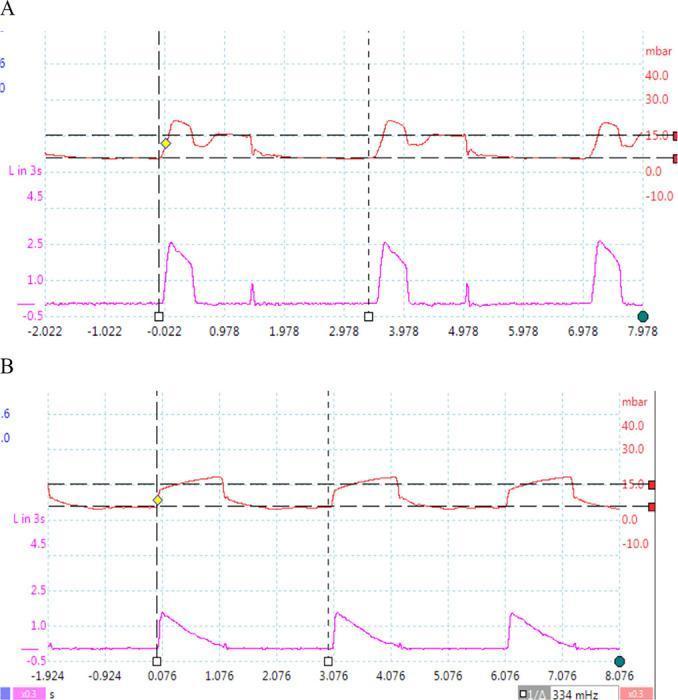
A comparison chart consisting of two sets of mechanical ventilation waveforms (pressure-time and flow-time curves) demonstrating different control variables. The upper panel (Ventilator 1) shows characteristics of volume-controlled ventilation, where the pressure curve (red) reaches a peak and then maintains a plateau, while the flow curve (purple) rises instantaneously and remains constant before falling, indicating a square flow waveform. The lower panel (Ventilator 2) illustrates pressure-controlled ventilation. In this mode, the pressure curve (red) rapidly rises to a set level (approximately 15 mbar) and maintains a plateau, while the flow curve (purple) shows a peak followed by a decelerating ramp pattern. Both panels show three respiratory cycles over an approximately 8-second window, with vertical dashed lines marking the start of inspiration. These waveforms are critical for respiratory therapy education to distinguish between volume-preset and pressure-preset mechanical ventilation strategies.
![This Comparison Chart displays synchronized respiratory waveforms over 40 seconds during volume-controlled mechanical ventilation. From top to bottom, the four graphs include: 1) Flow [l/min], showing inspiratory and expiratory phases with zero-flow plateaus during maneuvers. 2) Airway pressure (Paw [cmH2O]), highlighting 'Set PEEP', 'PEEPtot' during an expiratory pause, and 'Airway plateau pressure' and 'Airway driving pressure' during an inspiratory hold. 3) Esophageal pressure (Pes [cmH2O]), used as a surrogate for pleural pressure, showing end-expiratory/end-inspiratory values and minor cardiac artifacts. 4) Transpulmonary pressure (Plung [cmH2O]), calculated as Paw minus Pes, illustrating 'Transpulmonary driving pressure' and 'End-inspiratory transpulmonary pressure'. The visual illustrates critical bedside monitoring for Acute Respiratory Distress Syndrome (ARDS), focusing on lung mechanics, intrinsic PEEP, and the prevention of ventilator-induced lung injury (VILI) by quantifying driving pressures and plateau pressures through hold maneuvers.](https://cdn.orris.care/cdss_images/pmc_clinical_VQA_1099345286f128aad8b7d3b682adc5a15737e3b737170091be774aed96d94975.jpg)
This Comparison Chart displays synchronized respiratory waveforms over 40 seconds during volume-controlled mechanical ventilation. From top to bottom, the four graphs include: 1) Flow [l/min], showing inspiratory and expiratory phases with zero-flow plateaus during maneuvers. 2) Airway pressure (Paw [cmH2O]), highlighting 'Set PEEP', 'PEEPtot' during an expiratory pause, and 'Airway plateau pressure' and 'Airway driving pressure' during an inspiratory hold. 3) Esophageal pressure (Pes [cmH2O]), used as a surrogate for pleural pressure, showing end-expiratory/end-inspiratory values and minor cardiac artifacts. 4) Transpulmonary pressure (Plung [cmH2O]), calculated as Paw minus Pes, illustrating 'Transpulmonary driving pressure' and 'End-inspiratory transpulmonary pressure'. The visual illustrates critical bedside monitoring for Acute Respiratory Distress Syndrome (ARDS), focusing on lung mechanics, intrinsic PEEP, and the prevention of ventilator-induced lung injury (VILI) by quantifying driving pressures and plateau pressures through hold maneuvers.
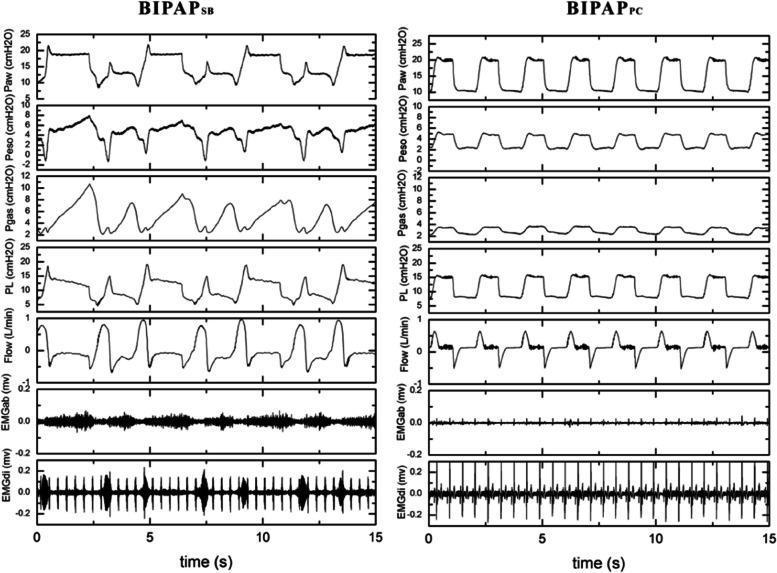
This physiological data visualization displays representative respiratory tracings comparing two mechanical ventilation modes: Biphasic Positive Airway Pressure with spontaneous breathing (BIPAPSB) and BIPAP with muscle paralysis (BIPAPPC). The x-axis tracks a 15-second duration. The vertical columns compare seven parameters: Airway pressure (Paw), Esophageal pressure (Peso), Intragastric pressure (Pgas), Transpulmonary pressure (PL), Airflow (Flow), Abdominal muscle surface electromyography (EMGab), and Diaphragmatic esophageal surface electromyography (EMGdi). In the BIPAPSB group, waveforms for Paw, Peso, and PL show irregular morphology and fluctuations indicative of spontaneous respiratory efforts, complemented by significant electrical activity bursts in the EMGdi tracing. In contrast, the BIPAPPC group exhibits highly regular, square-wave patterns in Paw and PL, consistent with passive, pressure-controlled ventilation. The EMGab and EMGdi tracings for the BIPAPPC group show near-total suppression of electrical activity, reflecting the state of muscle paralysis. This comparison illustrates the impact of patient effort on ventilatory pressures and muscle recruitment during mechanical ventilation.
python3 << 'EOF' import os from pypdf import PdfReader from PIL import Image import io os.makedirs("/tmp/workspace/vent_images", exist_ok=True) files = { "modes": "/tmp/workspace/attachments/8c71e19f-d9b5-49cc-9619-6903d3b8c8ab/Modes_of_Mechanical_Ventilation.pdf", "waveforms": "/tmp/workspace/attachments/8c71e19f-d9b5-49cc-9619-6903d3b8c8ab/Ventilator_Waveforms.pdf", "discontinuation": "/tmp/workspace/attachments/8c71e19f-d9b5-49cc-9619-6903d3b8c8ab/Discontinuation_of_Mechanical_Ventilation.pdf" } saved = [] for name, path in files.items(): reader = PdfReader(path) for pg_num, page in enumerate(reader.pages): for img_idx, img in enumerate(page.images): try: img_data = img.data img_name = f"{name}_pg{pg_num+1}_img{img_idx+1}.png" img_path = f"/tmp/workspace/vent_images/{img_name}" # Save raw or convert pil_img = Image.open(io.BytesIO(img_data)) pil_img.save(img_path) saved.append(img_path) except Exception as e: pass print(f"Saved {len(saved)} images:") for s in saved[:30]: print(s) EOF
ventilator weaning criteria spontaneous breathing trial SBT protocol
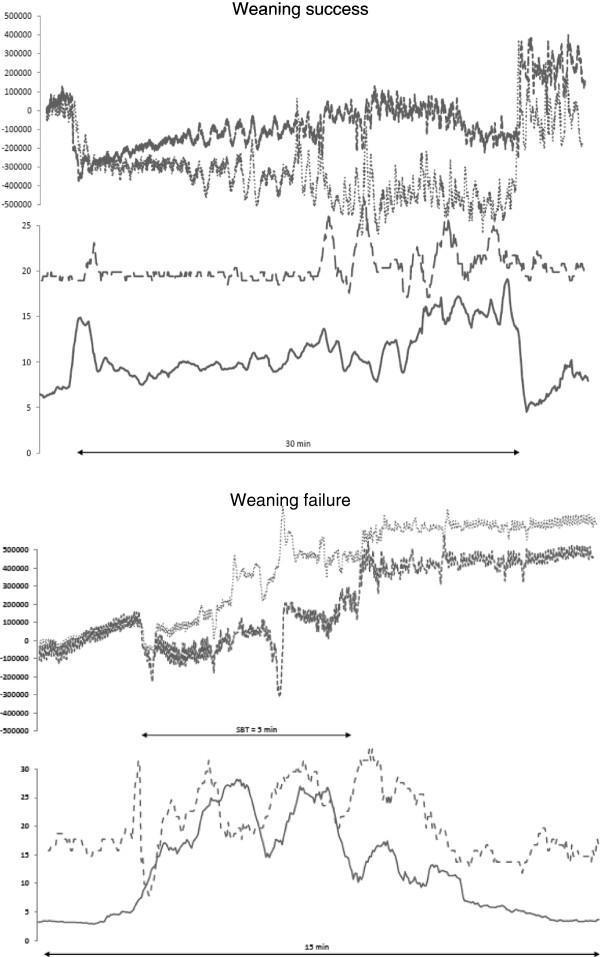
This comparison chart displays physiological waveforms from two patients undergoing a spontaneous breathing trial (SBT) for mechanical ventilation weaning: one who succeeds (top panel) and one who fails (bottom panel). For each patient, three primary respiratory metrics are plotted over time (x-axis): respiratory inductive plethysmography (RIP) tracing thoracic (fine dots) and abdominal (bold dots) bands, respiratory rate (dashed line), and the electrical activity of the diaphragm (EAdimax, solid line). In the weaning success patient, EAdimax and respiratory rate remain relatively stable throughout the 30-minute trial. In contrast, the weaning failure patient exhibits a steep, immediate increase in EAdimax and rapid fluctuations in respiratory rate upon disconnection from the ventilator, leading to trial termination after only 5 minutes. The RIP tracings for the failure patient show more pronounced and rapid oscillations in thoracic and abdominal movement, indicating increased work of breathing and potential recruitment of accessory muscles. This clinical graphic illustrates the use of diaphragmatic electromyography and plethysmography as diagnostic tools to monitor inspiratory effort and predict weaning outcomes in intensive care settings.
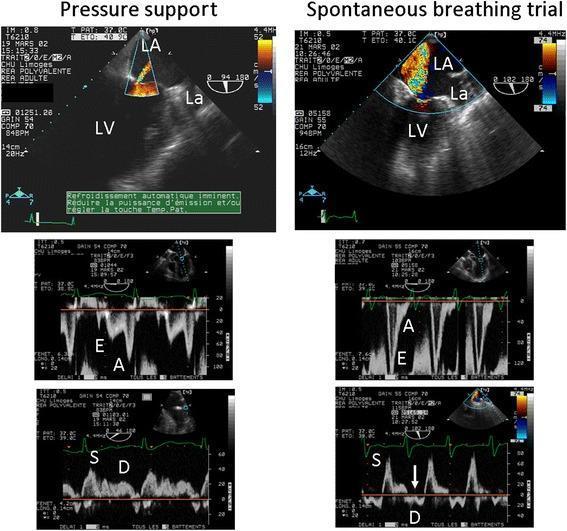
This diagnostic image set displays a side-by-side comparison of transesophageal echocardiography (TEE) findings in a patient with ischemic cardiomyopathy during ventilator weaning. The panels contrast 'Pressure support' (left column) with a 'Spontaneous breathing trial' (right column). Top row: Color Doppler in a two-chamber view assesses mitral regurgitation (MR). Under pressure support, MR is trivial; during the spontaneous breathing trial, severe MR is visible as a large, turbulent systolic jet filling the left atrium (LA). Middle row: Pulsed-wave Doppler of mitral inflow. The pressure support state shows an impaired relaxation pattern (E < A), indicating low filling pressures. The spontaneous breathing trial shows a restrictive filling pattern (E > A), indicating a sharp rise in left ventricular (LV) filling pressures. Bottom row: Pulmonary vein Doppler. Pressure support shows a normal systolic-dominant flow (S wave > D wave). The spontaneous breathing trial reveals a reversed D wave (indicated by the arrow), a hallmark of massive mitral insufficiency and elevated left-sided pressures. This visual series demonstrates weaning-induced cardiac dysfunction secondary to acute ischemic mitral regurgitation.
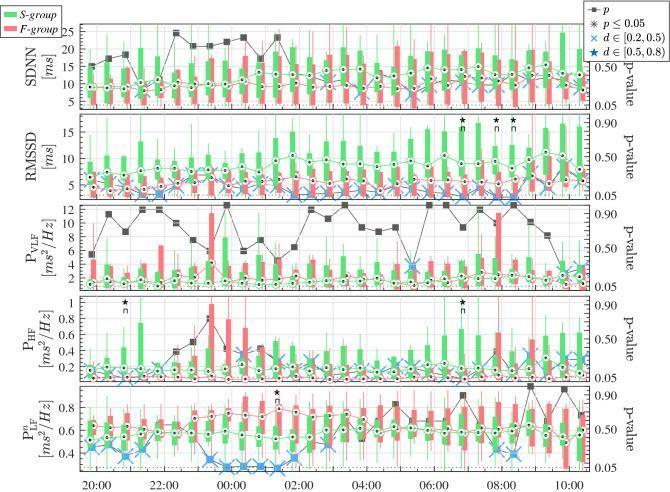
This physiological data visualization displays five stacked temporal boxplot graphs illustrating the evolution of heart rate variability (HRV) indices in patients prior to a spontaneous breathing trial (SBT). The indices shown are SDNN (ms), RMSSD (ms), Very Low Frequency Power (PVLF, ms²/Hz), High Frequency Power (PHF, ms²/Hz), and normalized Low Frequency Power (PLFⁿ, ms²/Hz). Data are segmented into two clinical outcomes: the S-group (successful weaning, green) and the F-group (failed weaning, red). The X-axis tracks a continuous time sequence from 20:00 to 10:00. Each panel includes a secondary right-side Y-axis representing p-values (black line with square markers) comparing the two groups at half-hour intervals. Statistical significance is denoted by black asterisks (p ≤ 0.05), while Cohen’s d effect sizes are indicated by blue stars (medium effect, 0.5–0.8) and blue crosses (small effect, 0.2–0.5). These charts highlight circadian variations and autonomic nervous system differences, particularly in the RMSSD and normalized PLF parameters, as potential predictors for mechanical ventilation weaning readiness.
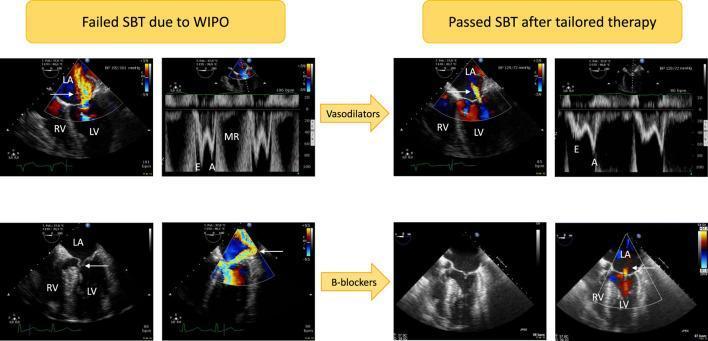
Transesophageal echocardiography (TEE) images demonstrating mechanisms of weaning-induced pulmonary edema (WIPO) and the response to targeted therapies. The top row illustrates a patient with hypertension during a failed spontaneous breathing trial (SBT). The color Doppler reveals acute, severe functional mitral regurgitation (MR) with a massive central jet and elevated transmitral Doppler E-wave velocities (1 m/s). Following intravenous vasodilator treatment, the follow-up panels show a significant reduction in the MR jet area and a decrease in E-wave velocity (0.5 m/s). The bottom row displays a second mechanism: dynamic left ventricular outflow tract (LVOT) obstruction caused by systolic anterior motion (SAM) of the mitral valve (white arrow). This results in a massive, eccentric MR jet. After beta-blocker administration, the follow-up images show complete resolution of the SAM-induced obstruction and only trivial residual MR. Key anatomical structures labeled include the left atrium (LA), left ventricle (LV), and right ventricle (RV). This diagnostic comparison highlights how echocardiography guides personalized management of WIPO by differentiating between loading-condition-induced functional MR and adrenergic-driven dynamic obstruction.
You need to extract ALL text content from image-based PDF pages. The PDFs have been converted to PNG images stored at /tmp/workspace/vent_images/. Your task: 1. Use the analyse_media tool on each image to extract text. Process ALL images from all three PDFs. - Modes PDF pages: modes_pg1_img1.png through modes_pg16_img1.png (16 pages) - Waveforms PDF pages: waveforms_pg1_img1.png through waveforms_pg21_img1.png (21 pages) - Discontinuation PDF pages: discontinuation_pg1_img1.png through discontinuation_pg21_img1.png (21 pages) 2. The image URLs to use with analyse_media should be: file:///tmp/workspace/vent_images/[filename] BUT since analyse_media needs HTTP URLs, use fetch_image tool first to view images, then read_file if needed. Actually: Use the read_file tool on each PNG file - but that won't work for images. BETTER APPROACH: Use execute tool to run OCR or display images as base64, then analyse them. Actually, use this approach: - Run execute with python to convert each PNG to base64 and save as a text file - Then read those text files Wait, the best approach: Use execute to run pytesseract OCR on all images. Run this command: ``` python3 -c " import pytesseract from PIL import Image import os img_dir = '/tmp/workspace/vent_images' output = {} for fname in sorted(os.listdir(img_dir)): if fname.endswith('.png'): try: img = Image.open(os.path.join(img_dir, fname)) text = pytesseract.image_to_string(img) output[fname] = text print(f'=== {fname} ===') print(text[:2000]) print() except Exception as e: print(f'Error {fname}: {e}') " ``` If pytesseract is not available, try: pip install --user pytesseract and then re-run. Collect ALL the extracted text and return it as a single comprehensive report organized by PDF (Modes, Waveforms, Discontinuation), with all content preserved. Include every heading, bullet point, table, and paragraph exactly as extracted. Return the COMPLETE extracted text from all 58 images.
ls /tmp/workspace/vent_images/ | head -20 && echo "---" && ls /tmp/workspace/vent_images/ | wc -l
python3 -c "import pytesseract; print('pytesseract available')" 2>&1 && python3 -c "from PIL import Image; print('PIL available')" 2>&1
pip install --user pytesseract Pillow 2>&1 | tail -5 && which tesseract 2>&1
apt-get install -y tesseract-ocr 2>&1 | tail -5
which ocrmypdf 2>&1; which tesseract 2>&1; which pdftoppm 2>&1; python3 -c "import PIL; print(PIL.__version__)" 2>&1; ls /usr/bin/tess* 2>&1; ls /usr/local/bin/tess* 2>&1
find / -name "tesseract" 2>/dev/null | head -5; find / -name "*.traineddata" 2>/dev/null | head -5
python3 -c "import easyocr; print('easyocr available')" 2>&1; python3 -c "import cv2; print('cv2 available')" 2>&1; python3 -c "import google.cloud.vision; print('google vision available')" 2>&1
python3 -c " from PIL import Image import base64, io, os # Test encoding one image to base64 img_path = '/tmp/workspace/vent_images/modes_pg1_img1.png' with open(img_path, 'rb') as f: data = f.read() print(f'Image size: {len(data)} bytes') img = Image.open(img_path) print(f'Image dimensions: {img.size}, mode: {img.mode}') "
python3 -c " # Try to encode images as base64 and save them for analyse_media from PIL import Image import base64, io, os img_path = '/tmp/workspace/vent_images/modes_pg1_img1.png' with open(img_path, 'rb') as f: data = f.read() b64 = base64.b64encode(data).decode() print(f'Base64 length: {len(b64)}') print('data:image/png;base64,' + b64[:100] + '...') "
# Let's set up a small HTTP server to serve these images so analyse_media can access them python3 -c " import http.server import threading import os os.chdir('/tmp/workspace/vent_images') handler = http.server.SimpleHTTPRequestHandler httpd = http.server.HTTPServer(('0.0.0.0', 8765), handler) print('Server started on port 8765') httpd.serve_forever() " & sleep 2 echo "Server started" curl -s -I http://localhost:8765/modes_pg1_img1.png | head -5
# Check what OCR/vision tools are available which tesseract 2>&1 || true python3 -m pytesseract --version 2>&1 || true pip show pytesseract 2>&1 | head -3 # Check if there's a way to run tesseract directly find /usr /opt -name "tesseract" 2>/dev/null | head -5 # Check for other OCR tools which cuneiform 2>&1 || true which ocrad 2>&1 || true which gocr 2>&1 || true
# Try to install tesseract using available package managers yum install -y tesseract 2>&1 | tail -5 || \ dnf install -y tesseract 2>&1 | tail -5 || \ apk add tesseract-ocr 2>&1 | tail -5 || \ echo "No package manager available for tesseract"
sudo yum install -y tesseract 2>&1 | tail -10
Read timeout on endpoint URL: "https://bedrock-agentcore.ap-south-1.amazonaws.com/code-interpreters/orris_code_interpreter-jiK9AacE5I/tools/invoke"
We encountered an error while processing your request. Please try again or reach out to us for help.
Please do it
An error occurred (ValidationException) when calling the ConverseStream operation: Expected toolResult blocks at messages.16.content for the following Ids: tooluse_0dKvCP3ny53OQnMEnKSCy2
We encountered an error while processing your request. Please try again or reach out to us for help.