
Describe the principle of superposition and how it applies to multiple drug dosing. within 500-600 words in a point wise answer format using suitable graphs
principle of superposition multiple drug dosing pharmacokinetics
https://www.boomer.org/c/p4/c15/c1505.php
Principle of Superposition in Multiple Drug Dosing
1. Definition
- The principle of superposition states that the plasma drug concentration at any time during multiple dosing is simply the arithmetic sum of the concentrations contributed by each individual dose, as if each dose had been given alone and independently.
- It rests on the assumption that the pharmacokinetics of a drug are linear - meaning that processes such as absorption, distribution, and elimination follow first-order kinetics and are not altered or saturated by repeated dosing.
- Stated simply: early doses do not change the pharmacokinetic parameters (clearance, volume of distribution, half-life) of subsequent doses.
2. Core Assumptions
- Linear pharmacokinetics: The rate of elimination is proportional to drug concentration (first-order), so doubling the dose doubles the concentration.
- Dose-independent parameters: Clearance (CL) and volume of distribution (Vd) are constant regardless of dose size or number of doses administered.
- No enzyme induction/inhibition or receptor saturation alters drug behaviour over time.
- If any of these conditions are violated (e.g., non-linear Michaelis-Menten kinetics, as with phenytoin or alcohol), the superposition principle does not apply.
3. Mathematical Basis
-
For a one-compartment model with IV bolus dosing, the concentration after a single dose D at time t is:C(t) = (D/Vd) × e^(-k·t)where k = elimination rate constant.
-
When a second dose is given at time τ (the dosing interval), the total concentration is simply:C(total) = C(from dose 1) + C(from dose 2)
-
For n doses at equal interval τ, the total concentration at any time is the sum of all residual concentrations from each previous dose. This is the formal expression of superposition.
4. Drug Accumulation
-
Because drugs are eliminated exponentially, some drug from a previous dose always remains when the next dose is administered (unless the dosing interval far exceeds 5 half-lives).
-
Each new dose adds to this residual, causing progressive accumulation - exactly as predicted by superposition.
-
The accumulation factor quantifies this:Accumulation factor = 1 / (1 - e^(-0.693 × τ/t½))For a drug dosed every half-life, the accumulation factor = 2. This means peak steady-state concentrations will be 2× the peak after the first dose.
-
Importantly: accumulation is predictable using superposition, because the contribution of each dose can be calculated and summed.- Katzung's Basic and Clinical Pharmacology, 16th Edition, Drug Accumulation
5. Approach to Steady State
-
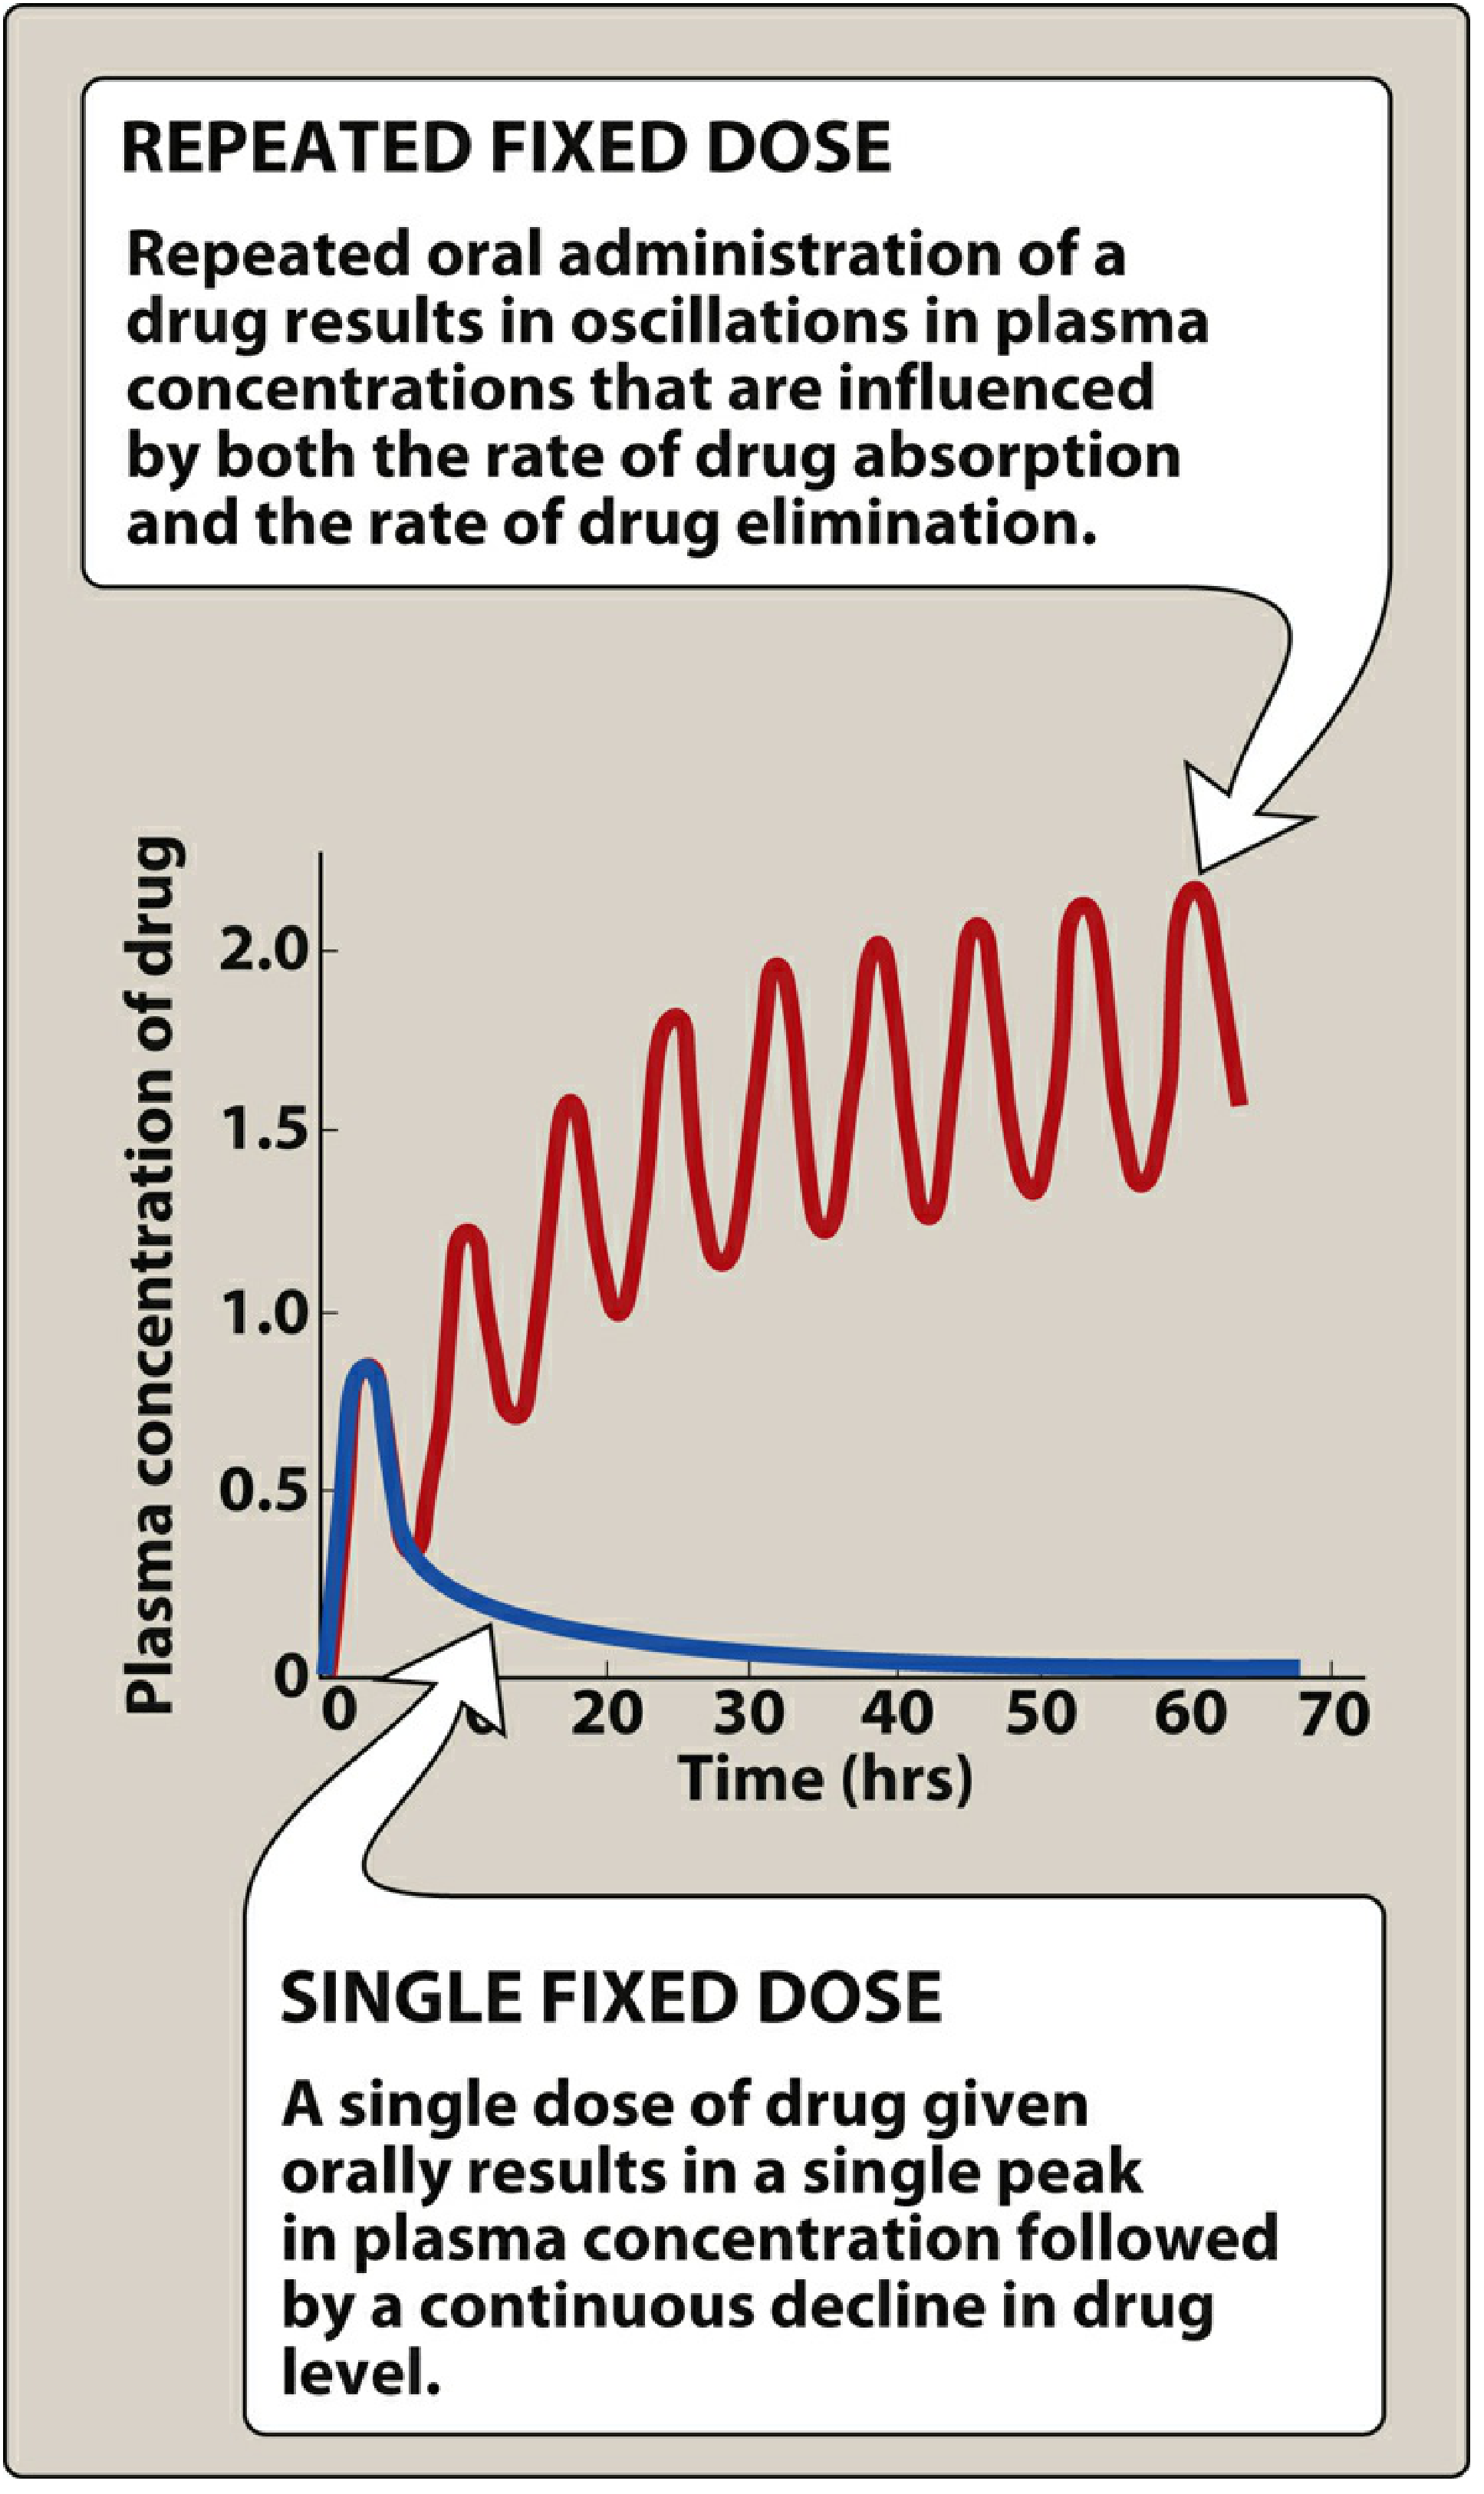
As doses accumulate, plasma concentrations oscillate between a Cmax (peak) and Cmin (trough) within each dosing interval.
-
The mean concentration rises progressively until the rate of drug elimination equals the rate of administration - this is the steady state (Css).
-
Steady state is reached after approximately 4-5 half-lives, regardless of dose size or dosing frequency.
- 50% of Css → after 1 half-life
- 75% of Css → after 2 half-lives
- 90% of Css → after 3.3 half-lives
- ~100% of Css → after 4-5 half-lives
- Lippincott Illustrated Reviews: Pharmacology
6. Effect of Dose Size and Frequency
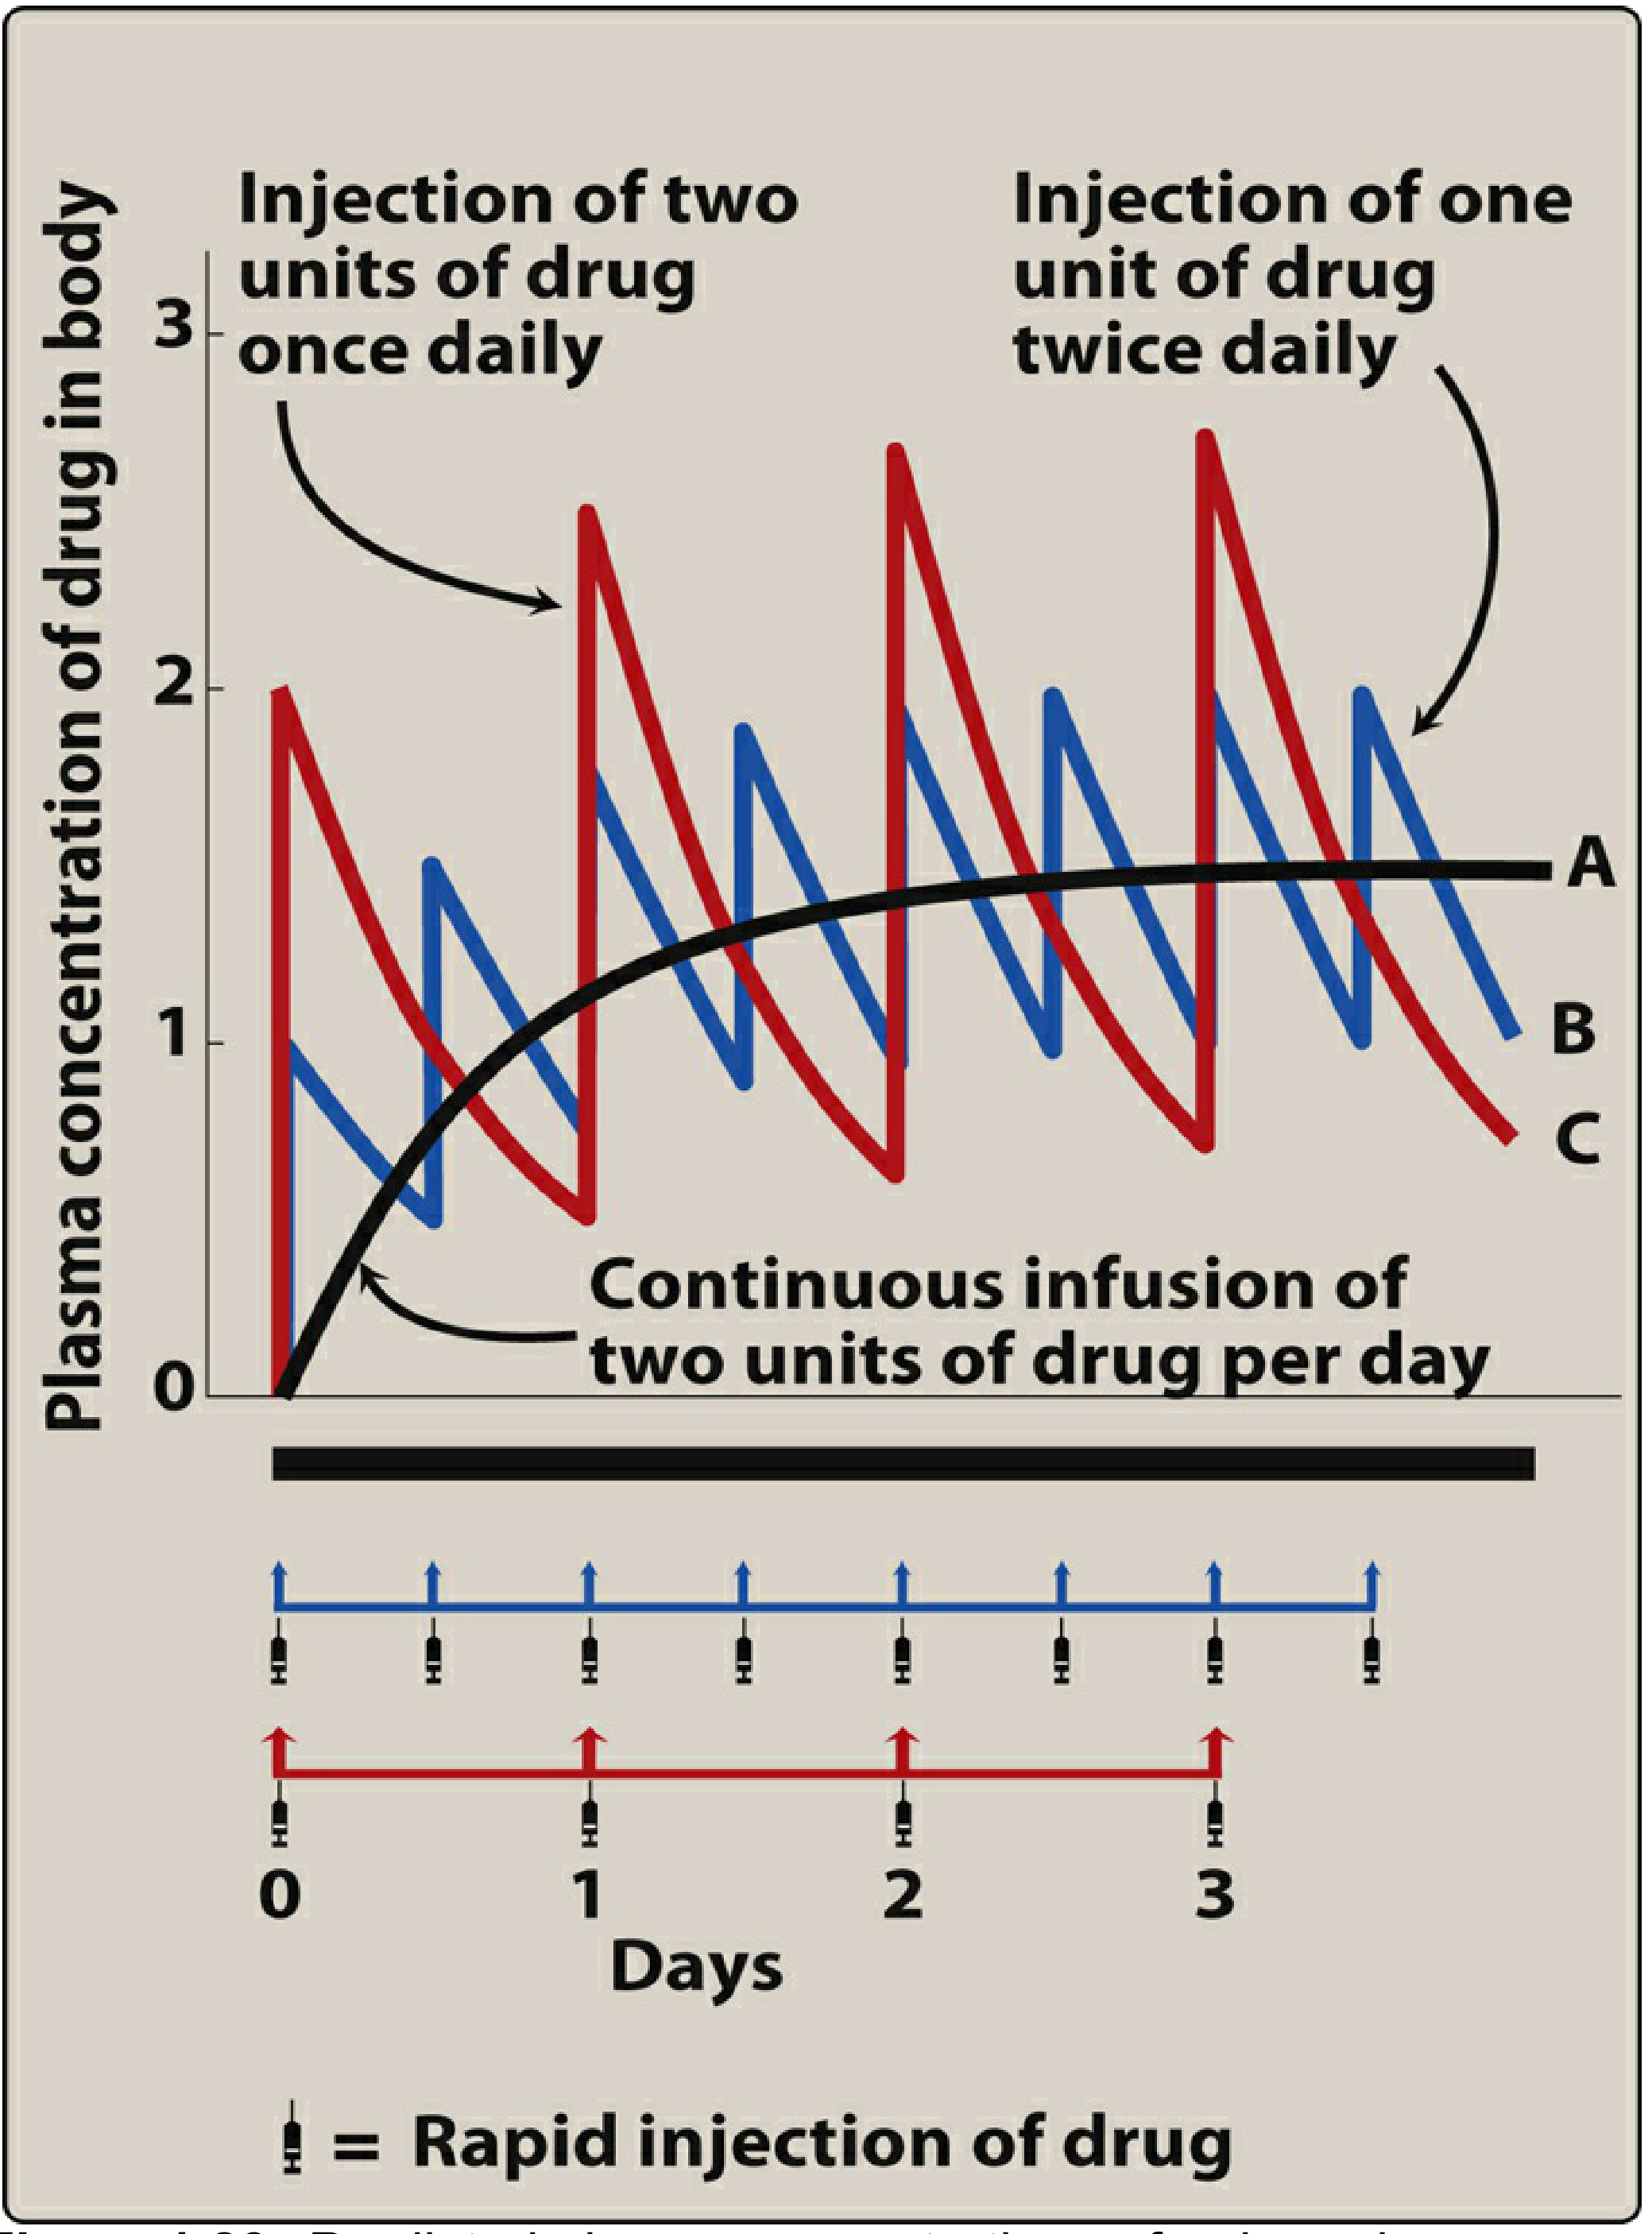
- Doubling the dose doubles the steady-state concentration (Css ∝ dose), without altering the time to reach steady state. This is a direct consequence of linearity.
- Increasing dosing frequency (e.g., from once to twice daily) reduces peak-to-trough fluctuation but does not change the average Css or the time to reach it.
- Continuous IV infusion (equivalent to infinitely frequent small doses) produces a smooth, fluctuation-free rise to steady state - the theoretical ideal of superposition with zero oscillation.
7. Loading Dose and Dose Adjustment
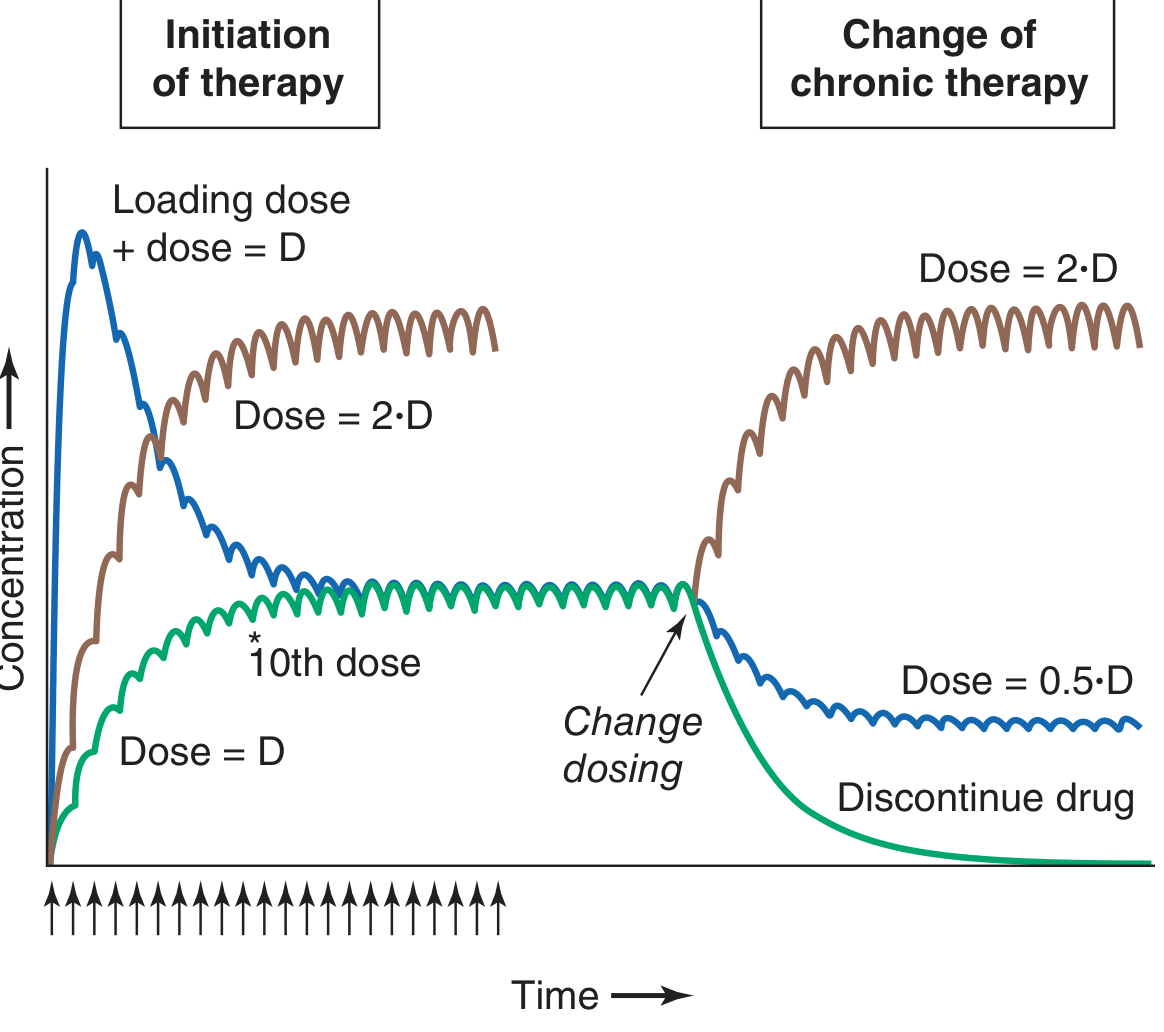
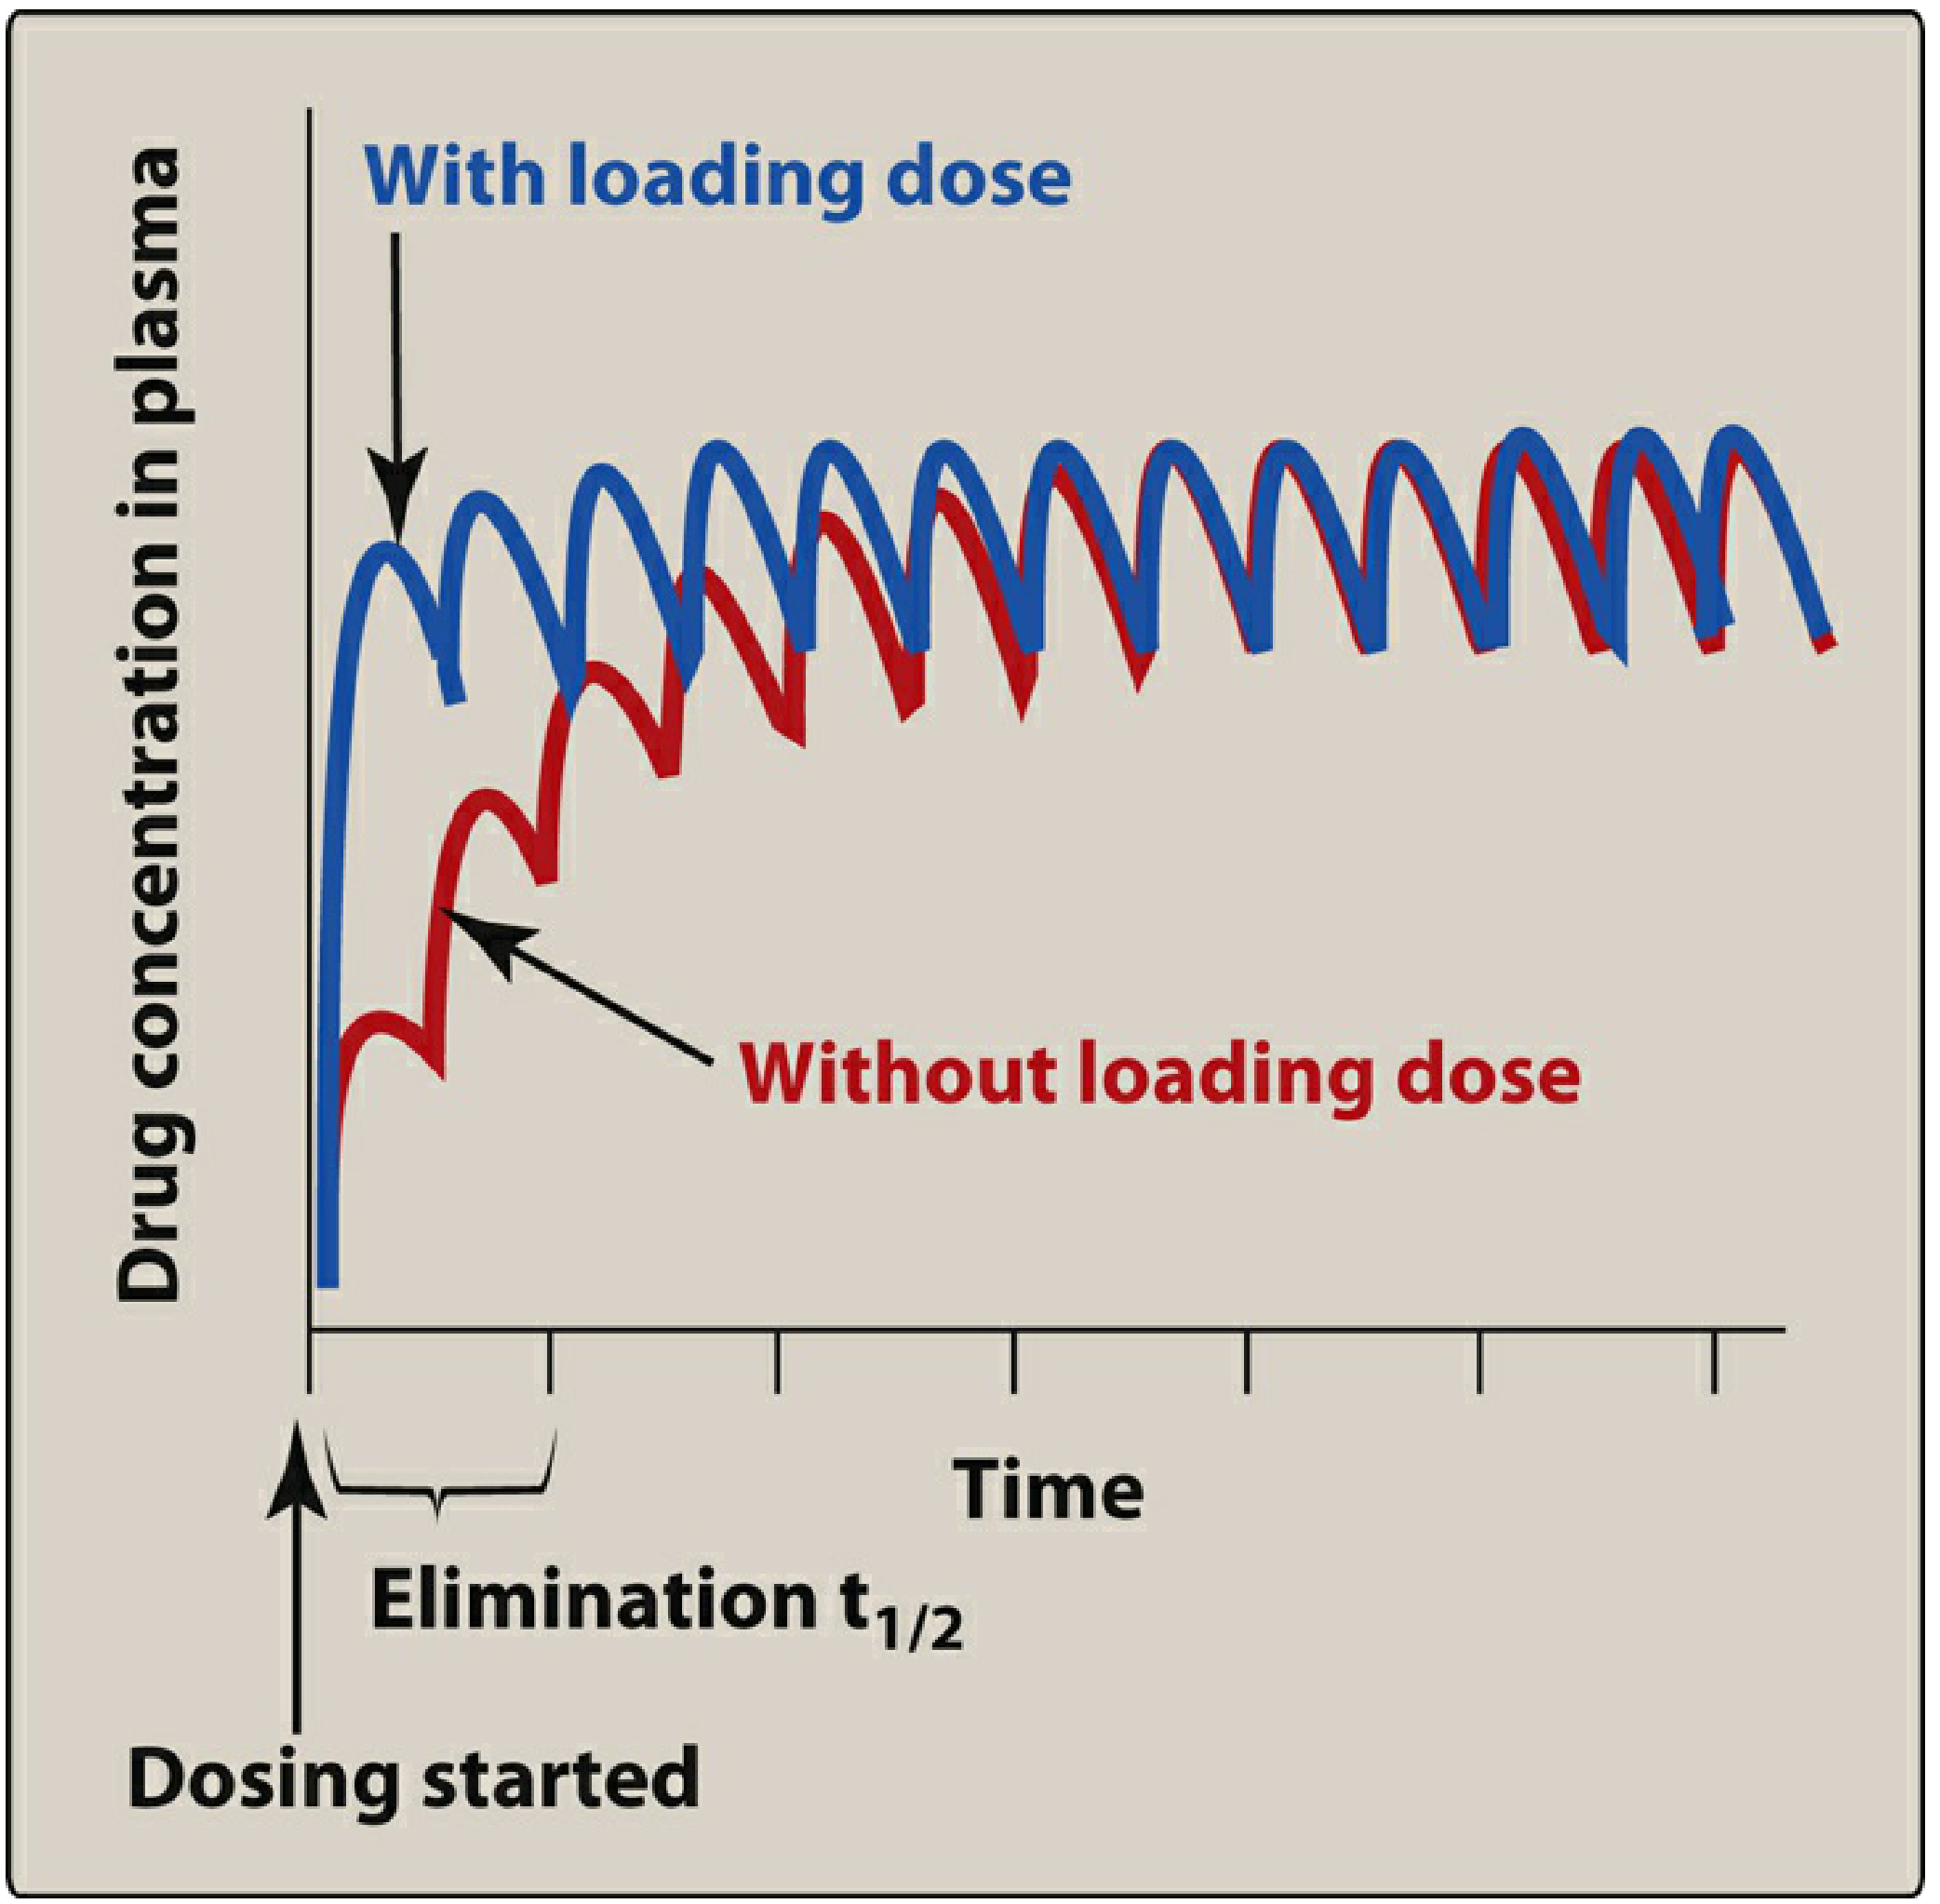
- Loading dose: Because steady state normally takes 4-5 half-lives, a large initial (loading) dose can rapidly achieve therapeutic concentrations - but it does not change the ultimate steady state or the time course of accumulation for subsequent doses.
- Dose reduction or discontinuation: After any change in dosing at steady state, a new steady state is reached again in ~5 half-lives - fully predictable by superposition.
8. Clinical Significance
| Feature | Implication |
|---|---|
| Steady state in 4-5 t½ | No need to check levels until this time has elapsed |
| Css ∝ dose (linear) | Dose can be adjusted proportionally to achieve a target level |
| Accumulation predictable | Can calculate peak/trough at steady state from single-dose data |
| Superposition fails with non-linear PK | Drugs like phenytoin, aspirin (high dose) require separate modelling |
| Loading dose | Shortens time to therapeutic range for long t½ drugs (e.g., amiodarone, digoxin) |
Summary
6. Explain the different methods of conversion of intravenous to per oral dosing.
IV to oral conversion methods pharmacokinetics bioavailability dose calculation
https://pharmdguru.com/conversion-from-intravenous-to-oral-d…
Conversion of Intravenous (IV) to Per Oral (PO) Dosing
Why Convert IV to Oral?
- IV therapy is used when rapid, reliable drug delivery is required - but it carries risks (catheter infections, thrombophlebitis, medication errors) and limits patient mobility.
- Once a patient is clinically stable with a functioning GI tract, converting to oral dosing is safer, cheaper, and more comfortable.
- The pharmacokinetic challenge is that IV bioavailability = 100%, while oral bioavailability (F) is often < 100% due to incomplete absorption and/or first-pass metabolism.
Prerequisites Before Conversion
- Clinical stability - afebrile trend, improving vitals
- Functioning GI tract - able to swallow, no ileus, no severe vomiting/diarrhoea
- Oral formulation available for the same drug (or a suitable therapeutic equivalent)
- No contraindication to enteral feeding or oral absorption (e.g., short bowel, malabsorption syndromes)
Method 1: Same-Dose Conversion (Direct Switch)
Principle
- Used when the oral bioavailability of a drug is high (≥ 80-90%).
- The oral dose equals the IV dose because systemic exposure is essentially the same by both routes.
Formula
Dose(oral) = Dose(IV)
Examples
| Drug | IV Dose | Oral Equivalent | Oral F (%) |
|---|---|---|---|
| Levofloxacin | 500 mg IV q24h | 500 mg PO q24h | ~99% |
| Metronidazole | 500 mg IV q8h | 500 mg PO q8h | ~99% |
| Fluconazole | 200 mg IV q24h | 200 mg PO q24h | ~90% |
| Linezolid | 600 mg IV q12h | 600 mg PO q12h | ~100% |
- Fluoroquinolones are the classic example - ideal for direct switch due to near-complete oral bioavailability.
Method 2: Dose-Equivalent Conversion (Dose Adjustment for Bioavailability)
Principle
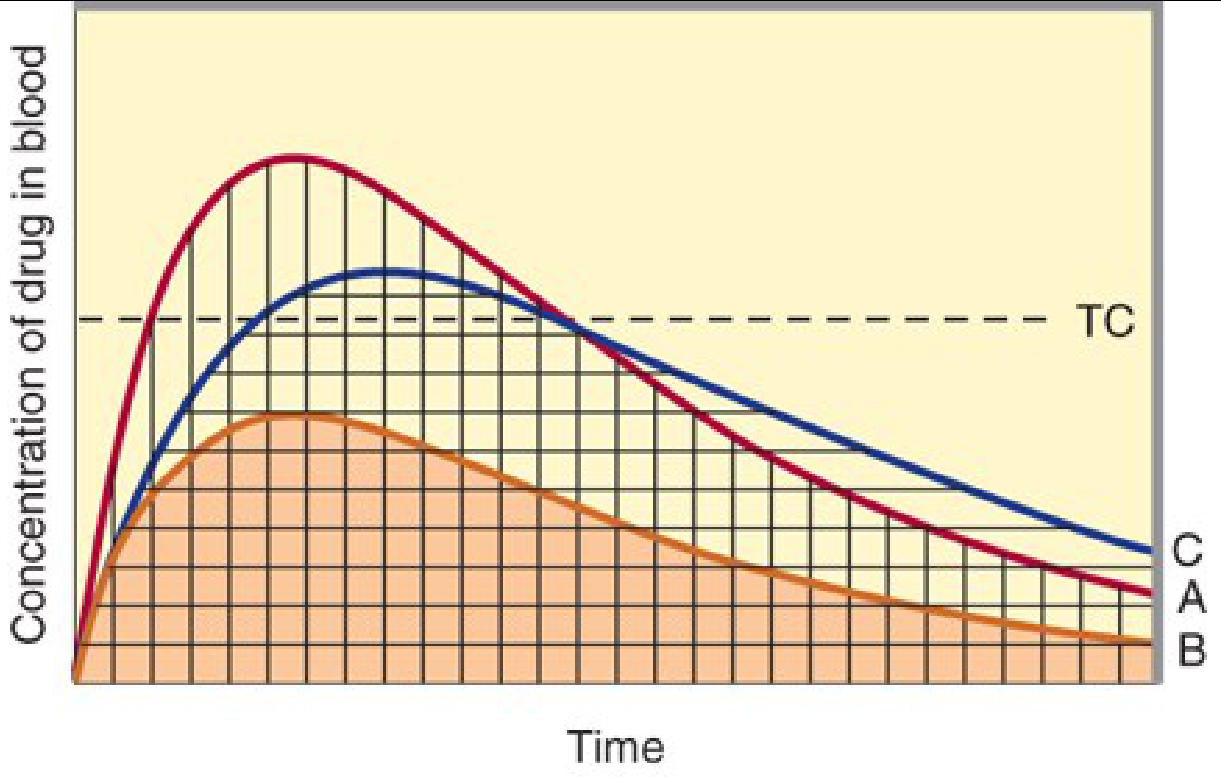
- Used when oral bioavailability is moderate (30-80%).
- The oral dose must be increased relative to the IV dose to maintain equivalent systemic exposure (same AUC).
- The AUC under both routes must be equal:
AUC(oral) = AUC(IV)
Formula
Concept: Salt Factor (S)
- If the oral formulation is a different salt or ester of the same drug, an additional correction factor S must be applied.
- Example: Aminophylline (IV) contains 85% theophylline by weight, so S = 0.85.
Worked Example (Aminophylline → Theophylline)
- A patient receives aminophylline IV infusion at 34 mg/hr.
- Convert to oral theophylline (F = 1.0, S = 0.85):
- Daily IV dose = 34 × 24 = 816 mg aminophylline/day
- Equivalent theophylline = 816 × 0.85 = 693.6 mg theophylline/day
- Prescribe: theophylline 350 mg PO q12h (sustained-release preferred to minimise peak-trough fluctuation)
Examples
| Drug | IV Dose | Oral Equivalent | Oral F (%) | Reason for Adjustment |
|---|---|---|---|---|
| Amiodarone | 1 g IV load | ~2-3 g PO load | ~30% | Poor absorption |
| Morphine | 10 mg IV | ~30 mg PO | ~33% | High hepatic first-pass |
| Propranolol | 1 mg IV | ~10-40 mg PO | ~25% | Extensive first-pass |
| Verapamil | 5 mg IV | ~80 mg PO | ~20-35% | High hepatic extraction |
- Katzung's Basic and Clinical Pharmacology, 16th Edition: "A major consequence of the low bioavailability of propranolol is that oral administration of the drug leads to much lower drug concentrations than are achieved after intravenous injection of the same dose."
Why oral bioavailability is < 100%: Two mechanisms
- Drug too hydrophilic (e.g., atenolol) or too lipophilic (e.g., acyclovir) to cross the gut wall
- Degradation in gastric acid (e.g., benzylpenicillin)
- Drugs with high ER (morphine, lidocaine, propranolol, isoniazid) undergo extensive first-pass loss, drastically reducing oral F.
- Lidocaine cannot be given orally at all because first-pass generates toxic metabolites.
Method 3: Therapeutic Substitution
Principle
- Used when no oral formulation of the IV drug exists, or the oral formulation is impractical.
- A pharmacologically equivalent drug from the same class with adequate oral bioavailability is substituted.
- Requires clinical judgement about equivalent efficacy and safety - not purely a pharmacokinetic calculation.
Examples
| IV Drug (no oral form) | Oral Substitute | Basis |
|---|---|---|
| Ceftriaxone (3rd-gen cephalosporin) | Cefixime PO or Amoxicillin-Clavulanate | Same class, similar spectrum |
| Ceftazidime (antipseudomonal) | Ciprofloxacin 750 mg PO BID | Equivalent antipseudomonal activity |
| IV amphotericin B | Fluconazole or Voriconazole PO | Same antifungal target |
| Gentamicin IV | Ciprofloxacin PO (for susceptible Gram-negatives) | Similar gram-negative coverage |
- This method is commonly used in antimicrobial stewardship programmes to reduce IV catheter days and hospital costs.
Method 4: AUC-Based / Pharmacokinetic Modeling Approach
Principle
- For drugs with narrow therapeutic indices (e.g., digoxin, theophylline, cyclosporin, tacrolimus, vancomycin), conversion must be guided by therapeutic drug monitoring (TDM).
- The goal is to match the steady-state AUC rather than just the dose.
Steps
- Calculate target steady-state concentration (Css) from the IV regimen.
- Calculate the required oral dose rate using: $$\text{Dose rate}{\text{oral}} = C{ss} \times CL / F$$
- After switching, measure plasma levels at appropriate time points (usually after 4-5 half-lives of the new regimen).
- Adjust oral dose based on measured levels.
Clinical Relevance
- Amiodarone: oral bioavailability ~30%; IV-to-oral loading protocols require weeks due to the drug's enormous volume of distribution and long half-life.
- Goodman & Gilman's: "This incomplete bioavailability is important in calculating equivalent dosing regimens when converting from intravenous to oral therapy."
- Digoxin: oral F varies (60-80%); TDM required after switch.
- Cyclosporin/Tacrolimus: extended-release oral formulations have slightly higher bioavailability than standard - dose reduction may be needed.
- Tietz Textbook of Laboratory Medicine: "Extended-release formulations afford delayed maximal concentrations with improved bioavailability leading to a slight reduction in dose to achieve equivalent AUC."
Summary Table
| Method | When Used | Dose Change | Example |
|---|---|---|---|
| Same-dose conversion | F ≥ 80-90% | None | Levofloxacin, fluconazole |
| Dose-equivalent conversion | F = 30-80% | Increase oral dose (÷ F) | Morphine, amiodarone, propranolol |
| Therapeutic substitution | No oral form exists | New drug, class-equivalent dose | Ceftriaxone → cefixime |
| TDM-guided conversion | Narrow therapeutic index | Empiric dose then adjust | Digoxin, cyclosporin, theophylline |
Key Formula to Remember
Explain the factors considered in the design of dosage regimen for paediatric patients. in a pointwise answer format
factors dosage regimen design paediatric patients pharmacokinetics
Factors Considered in the Design of Dosage Regimen for Paediatric Patients
I. Age-Based Classification
- Paediatric patients are first stratified by developmental stage, as each has distinct PK profiles:
| Group | Age |
|---|---|
| Preterm neonate | < 37 weeks gestation |
| Full-term neonate | 0-28 days |
| Infant | 1-12 months |
| Child | 1-12 years |
| Adolescent | 12-18 years |
- Physiologic processes influencing PK change most rapidly in the first weeks of life, so dosing intervals and doses that are appropriate for a 3-month-old may be inappropriate for a 3-day-old neonate.
II. Absorption
A. Blood Flow at Site of Administration (IM/SC)
- In neonates, absorption after intramuscular (IM) or subcutaneous injection depends on blood flow to the injection site.
- Sick preterm infants have very little muscle mass and often have diminished peripheral perfusion.
- Drug may pool in muscle and be absorbed slowly - but if perfusion suddenly improves (e.g., after resuscitation), a sudden surge in absorption can produce toxic plasma concentrations.
- Drugs particularly hazardous in this context: cardiac glycosides, aminoglycosides, anticonvulsants.
B. Gastrointestinal Function
-
Gastric pH: Neonates have a higher (more alkaline) gastric pH at birth, which falls over the first hours. Preterm infants secrete acid even more slowly. This affects stability and ionisation of drugs:
- Acid-labile drugs (e.g., penicillin G, ampicillin) are better absorbed in neonates due to higher pH.
- Weakly acidic drugs may have reduced absorption (e.g., phenobarbital, phenytoin).
-
Gastric emptying time: Prolonged in neonates (up to 6-8 hours), so drugs absorbed in the stomach are absorbed more completely, while drugs absorbed in the small intestine have a delayed onset.
-
Peristalsis: Irregular and slow in neonates - can lead to unpredictable and increased absorption of drugs normally absorbed in the small intestine. In diarrhoeal states, rapid peristalsis reduces absorption by decreasing intestinal contact time.
-
GI enzyme activity: Lower levels of α-amylase, pancreatic enzymes, and intestinal enzymes in neonates affect absorption of certain prodrugs and prodrug formulations.
-
Transdermal absorption: Greatly enhanced in neonates - the stratum corneum is thin, and the body surface area-to-weight ratio is much higher than in adults. This increases the risk of systemic toxicity from topically applied agents (e.g., corticosteroids, antiseptics like hexachlorophene).
-
- Katzung's Basic and Clinical Pharmacology, 16th Edition, Chapter 59
III. Distribution
-
Body water content: Total body water (TBW) is much higher in neonates (~75-80% of body weight vs ~60% in adults). This increases the volume of distribution (Vd) of hydrophilic drugs, requiring relatively higher loading doses per kg.
-
Body fat content: Neonates have less body fat (~15%) and this increases further through infancy. Lipophilic drugs have a smaller Vd in neonates but a larger Vd later in infancy and childhood.
-
Plasma protein binding: Neonates have:
- Lower concentrations of albumin and α₁-acid glycoprotein
- Qualitatively different albumin with reduced binding affinity
- Higher concentrations of fetal albumin (which binds drugs differently)
- Elevated bilirubin and free fatty acids that compete with drugs for binding sites (e.g., sulfonamides can displace bilirubin, causing kernicterus)
- Result: higher free drug fraction in neonates → greater pharmacological effect per unit dose
-
Blood-brain barrier: Less developed in neonates → drugs penetrate the CNS more readily. This is why morphine and other CNS-active drugs can cause respiratory depression at doses lower than expected in adults.
IV. Metabolism
Hepatic Enzyme Maturation
-
Hepatic microsomal enzyme activity (CYP450 system) is significantly reduced in neonates and undergoes progressive maturation:
- CYP3A4, CYP1A2, CYP2D6 - all reduced at birth, mature over months to years
- By 1-2 years, enzyme activity often exceeds adult levels (explaining why children sometimes need higher mg/kg doses than adults for certain drugs)
- Activity slows again during adolescence and reaches adult rates by late puberty
-
Chloramphenicol toxicity (Grey Baby Syndrome): Classic example of immature hepatic glucuronyl transferase activity in neonates - inability to conjugate chloramphenicol leads to toxic accumulation → cardiovascular collapse.
-
Caffeine vs. Theophylline: Neonates can methylate theophylline to caffeine (a reaction not seen in adults) due to different CYP isoenzyme expression.
-
Glucuronidation: Matures later than sulfation. Drugs that rely on glucuronidation (e.g., morphine, chloramphenicol, acetaminophen) are handled differently in neonates.
Comparison of Drug Half-Lives
- Many drugs have markedly prolonged half-lives in neonates due to reduced hepatic clearance:
| Drug | Half-life in Neonates | Half-life in Adults |
|---|---|---|
| Phenobarbital | 200 hr | 64-140 hr |
| Diazepam | 25-100 hr | 15-25 hr |
| Theophylline | 30 hr | 3-9 hr |
| Chloramphenicol | 26 hr | 4 hr |
| Lidocaine | 3.2 hr | 1.8 hr |
V. Excretion (Renal Elimination)
- GFR in neonates is markedly reduced (~2-4 mL/min/1.73 m² at birth vs ~127 mL/min in adults), largely due to low renal blood flow, low filtration pressure, and incomplete glomerular development.
- Tubular secretion and reabsorption also immature at birth.
- GFR doubles in the first 1-2 weeks and approaches adult values (corrected for surface area) by 6-12 months.
- Drugs eliminated renally have greatly prolonged half-lives in neonates (e.g., aminoglycosides, penicillin, digoxin) and require:
- Reduced doses
- Extended dosing intervals
- Therapeutic drug monitoring (TDM)
VI. Dose Calculation Methods
1. Weight-Based Dosing (mg/kg)
- Most common method in clinical practice
- Standard for most drugs: dose expressed as mg/kg body weight
- Limitation: in obese children, dosing on total body weight leads to overdosing; lean body weight should be used instead
2. Body Surface Area (BSA)-Based Dosing
- Most pharmacologically accurate method - correlates better with metabolic rate and organ function than weight or age
- Formula:
- BSA-based doses are more likely to be adequate; age/weight-based calculations tend to underestimate required dose.
| Weight (kg) | Age | BSA (m²) | % of Adult Dose |
|---|---|---|---|
| 3 | Newborn | 0.2 | 12% |
| 6 | 3 months | 0.3 | 18% |
| 10 | 1 year | 0.45 | 28% |
| 20 | 5.5 years | 0.8 | 48% |
| 30 | 9 years | 1.0 | 60% |
| 40 | 12 years | 1.3 | 78% |
| 50 | 14 years | 1.5 | 90% |
| 70 | Adult | 1.76 | 103% |
3. Age-Based Rules (Historical / Approximate)
- Young's rule: Dose = (Age in years / Age + 12) × Adult dose
- Fried's rule (infants < 1 yr): Dose = (Age in months / 150) × Adult dose
- These are imprecise and should not be used if the manufacturer provides a paediatric dose.
Important: The paediatric dose calculated by any method must never exceed the adult dose.
VII. Pharmacodynamic Considerations
- Receptor sensitivity: May differ in neonates - e.g., the ductus arteriosus is sensitive to prostaglandins and prostaglandin inhibitors (indomethacin) in ways not seen later in life.
- CNS immaturity: Neonates are more sensitive to CNS depressants (opioids, benzodiazepines) and more susceptible to respiratory depression and seizures.
- Bilirubin displacement: Certain drugs (sulfonamides, ceftriaxone in neonates) displace bilirubin from albumin, risking kernicterus (bilirubin encephalopathy).
VIII. Formulation and Adherence
- Dosage forms: Many drugs are not available in age-appropriate formulations (liquid suspensions, dispersible tablets). Crushing or splitting adult tablets introduces dosing errors.
- Palatability: Unpalatable formulations reduce adherence; flavouring agents are often added to paediatric preparations.
- Dosing frequency: Twice-daily regimens are preferred over thrice or four-times daily for better adherence.
- Devices: Oral syringes with calibrated markings are more accurate than household spoons for liquid dosing.
IX. Special Situations
- Prematurity: Preterm neonates have the most extreme PK deviations and warrant the most conservative dosing and the closest monitoring.
- Obesity: Increasing relevance; lean body weight should guide dosing of drugs that do not distribute into fat.
- Drug interactions and polypharmacy: Critically ill neonates often receive multiple drugs simultaneously - interactions may be unpredictable due to immature metabolic pathways.
- TDM (Therapeutic Drug Monitoring): Mandatory for narrow-index drugs (aminoglycosides, vancomycin, theophylline, digoxin, anticonvulsants) given the highly variable PK in this population.
Summary
| Factor | Key Issue in Paediatrics |
|---|---|
| Absorption | Higher gastric pH, slow GI motility, enhanced transdermal uptake |
| Distribution | High TBW → larger Vd for hydrophilic drugs; lower protein binding → more free drug |
| Metabolism | Immature CYP450 → prolonged t½; Grey Baby Syndrome; unpredictable drug effects |
| Excretion | Low GFR → reduced renal clearance; extended dosing intervals needed |
| Dose calculation | BSA-based most accurate; mg/kg most practical; never exceed adult dose |
| Pharmacodynamics | Altered receptor sensitivity; kernicterus risk; CNS vulnerability |
| Formulation | Age-appropriate forms, palatability, adherence devices |
| TDM | Essential for narrow therapeutic index drugs |
9. Why dosage adjustment is necessary in the obese patients. What are the pharmacokinetic parameters to be considered in the dosage adjustment for obese patients. in a pointwise answer format
dosage adjustment obese patients pharmacokinetic parameters volume distribution clearance obesity
Dosage Adjustment in Obese Patients
Part 1: Why Dosage Adjustment is Necessary in Obese Patients
1. Altered Body Composition
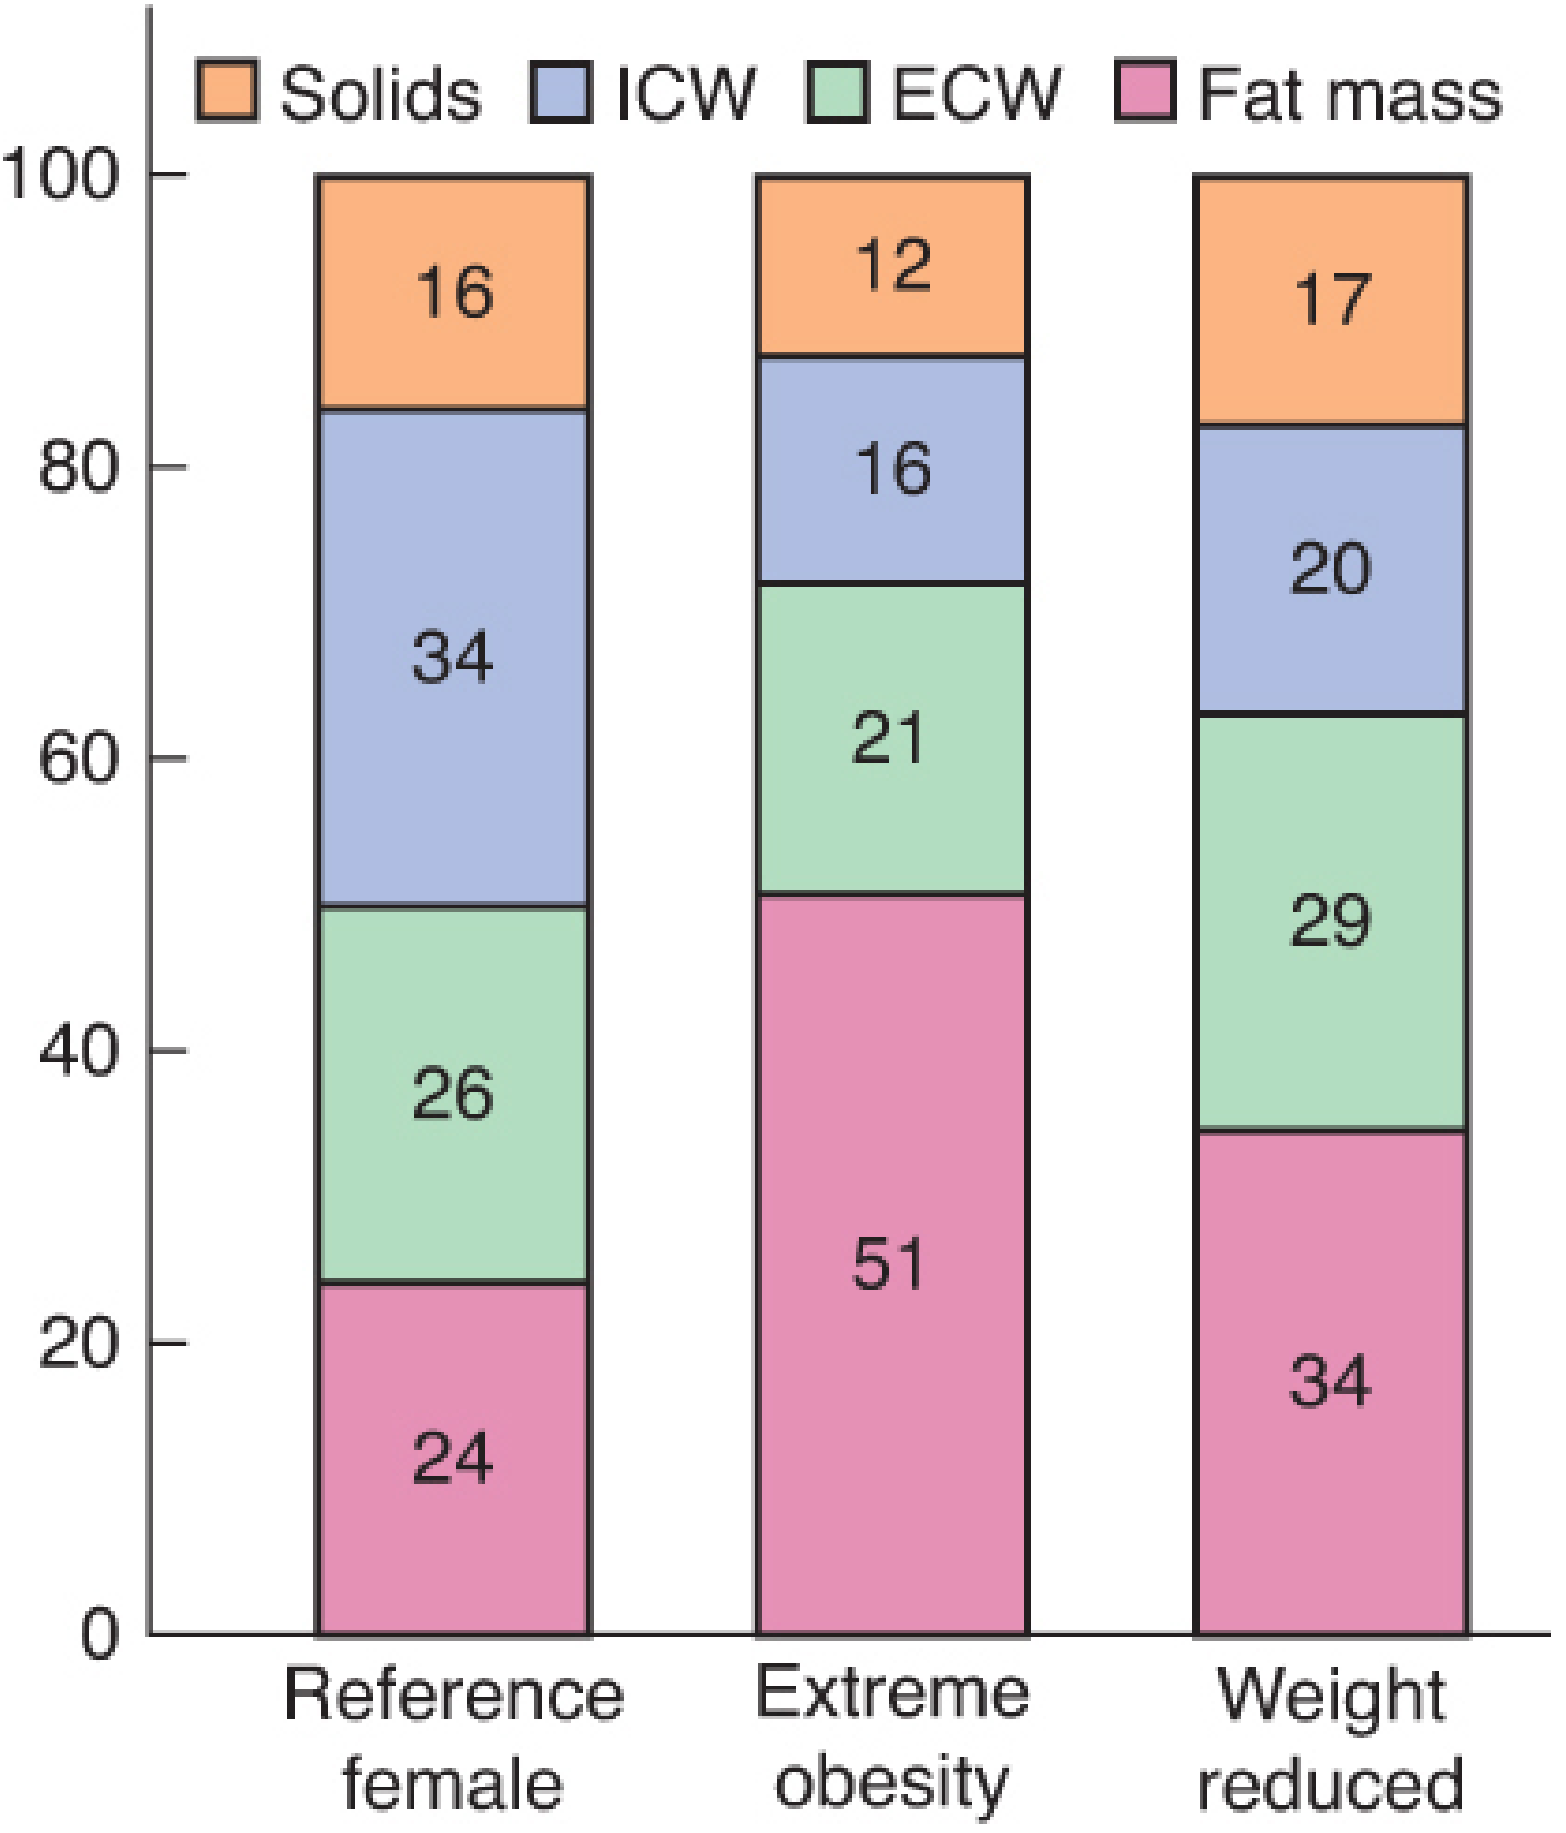
- In an obese person, fat mass increases dramatically (from ~24% to ~51% of body weight in extreme obesity), while the proportions of intracellular water (ICW) and solids decrease relatively.
- Lean body mass increases in absolute terms (more muscle to support excess weight) but decreases as a proportion of total body weight.
2. Risk of Overdosing with Standard mg/kg Dosing
- Using total body weight (TBW) for lipophilic drugs leads to excessive dosing because fat tissue, despite accumulating the drug, has poor blood flow - resulting in high initial plasma concentrations and then prolonged drug release from fat depots.
- A 136-kg patient does not require twice as much drug as a 68-kg patient of the same height.
3. Risk of Underdosing
- For drugs distributed mainly in lean tissues, dosing based on TBW is still incorrect - but in the opposite direction for highly hydrophilic drugs, where fat mass adds little to the volume of distribution.
- Dosing hydrophilic drugs on TBW can lead to subtherapeutic levels if lean mass is the actual determinant of distribution.
4. Unpredictable Accumulation and Prolonged Effects
- Highly lipophilic drugs (e.g., benzodiazepines, barbiturates) accumulate in fat stores. With repeated dosing, they are slowly released back into the bloodstream, prolonging drug effect well beyond the expected duration.
- This is particularly hazardous in the postoperative setting (respiratory depression from opioids, sedatives).
5. Altered Clearance
- Both hepatic and renal clearance are altered in obesity (see below), affecting maintenance dose requirements.
- Standard dosing intervals appropriate for normal-weight patients may lead to toxic accumulation or insufficient drug levels.
Part 2: Pharmacokinetic Parameters to Consider in Dosage Adjustment for Obese Patients
1. Volume of Distribution (Vd)
- Most significantly altered PK parameter in obesity.
- Vd is determined by the drug's lipophilicity (log P), protein binding, and the relative sizes of body compartments.
- Multiple factors alter Vd in obesity:
- Increased total body fat
- Increased lean body mass (absolute)
- Reduced total body water (as a proportion)
- Increased blood volume
- Increased cardiac output
- Altered protein binding
- Organomegaly (increased organ volumes)
- Elevated free fatty acids and triglycerides (compete for binding sites)
- Distribute extensively into adipose tissue
- Vd is markedly increased (e.g., diazepam Vd: 91 L in lean subjects vs 292 L in obese)
- Prolonged elimination half-life (t½) even when clearance is unchanged
- Examples: diazepam, midazolam, lorazepam, thiopental, propofol, fentanyl
- Distribute mainly in body water and lean tissues
- Vd is relatively unchanged or only modestly increased
- Loading doses should be based on ideal body weight (IBW) or lean body weight (LBW)
- Examples: aminoglycosides, penicillins, cephalosporins, digoxin (despite lipophilicity, actual Vd not proportionally increased)
Loading dose = Vd × target plasma concentration
- If Vd is increased (lipophilic drug) → loading dose must be based on an appropriate weight scalar
- If Vd is unchanged (hydrophilic drug) → loading dose based on IBW
2. Protein Binding
- Plasma albumin and total protein concentrations are not significantly changed by obesity.
- However, α₁-acid glycoprotein (which binds basic drugs) is increased in obesity.
- Elevated plasma concentrations of free fatty acids and triglycerides can competitively displace drugs from albumin binding.
- Hyperlipidaemia can increase plasma protein binding for some drugs → decreased free drug fraction → reduced pharmacological effect at a given total drug concentration.
- Net effect is drug-specific: some drugs show higher free fractions, others show reduced free fractions in obesity.
- Implication: For narrow therapeutic index drugs where free drug is monitored (e.g., phenytoin), the free fraction must guide dosing.
3. Drug Absorption (Oral Bioavailability)
- Despite increased splanchnic blood flow (which would be expected to enhance first-pass extraction), oral bioavailability is not significantly different in obese vs normal-weight subjects.
- However, gastric emptying and intestinal motility may be altered.
- Transdermal absorption may be affected by the depth of subcutaneous fat layer, altering patch pharmacokinetics.
- Subcutaneous/IM injections: Fat tissue has poor blood supply, so drugs injected into adipose tissue may have unpredictable, delayed, or erratic absorption.
4. Hepatic Clearance and Metabolism
- Liver volume and hepatic blood flow are increased in obesity → increased hepatic clearance for many drugs.
- Histological liver abnormalities (steatohepatitis, NAFLD) are common but usually do not reduce drug-metabolising capacity clinically.
- Generally unaffected or modestly altered by obesity
- CYP3A4 activity may be slightly reduced in morbid obesity
- Enhanced in obesity
- Drugs undergoing glucuronidation (e.g., acetaminophen, morphine, oxazepam, lorazepam) have increased clearance → may require higher maintenance doses or more frequent dosing
- Propofol undergoes conjugation correlated with TBW → maintenance infusions should be based on TBW
- Drugs with increased clearance in obesity (due to enhanced phase II or increased hepatic blood flow) → maintenance dose should be calculated on TBW or may need to be higher than for lean patients
- Drugs with unchanged clearance → maintenance dose based on LBW
5. Renal Clearance
- Obesity is associated with:
- Increased renal blood flow
- Increased GFR (glomerular hyperfiltration)
- Increased tubular secretion
- As a result, renally excreted drugs have increased clearance in obese patients.
- Drugs such as aminoglycosides and cimetidine that depend on renal excretion may require increased dosing or shorter dosing intervals.
- Standard creatinine-based equations (e.g., Cockcroft-Gault) may underestimate GFR in obese patients if not corrected with appropriate body weight scalar.
Note: In obese patients with obesity-related chronic kidney disease (late stage), this pattern reverses and renal clearance may be reduced.
6. Elimination Half-Life (t½)
- For highly lipophilic drugs: Vd is markedly increased with relatively stable clearance → prolonged t½
- This is the mechanistic basis for the prolonged sedation and respiratory depression seen after lipophilic drugs in obese patients
- Example: Diazepam t½ = 40 hrs in lean subjects vs 95 hrs in obese subjects (due to large increase in Vd, not decreased clearance)
7. Body Weight Scalars Used in Dose Calculation
| Weight Scalar | Formula | When to Use |
|---|---|---|
| Total Body Weight (TBW) | Actual measured weight (kg) | Succinylcholine, heparin, phase-II-metabolised drugs (propofol infusion) |
| Ideal Body Weight (IBW) | Men: 50 + 2.3×(height in inches − 60) kg; Women: 45.5 + 2.3×(height in inches − 60) kg | Hydrophilic drugs (aminoglycosides, penicillins, cephalosporins, digoxin, phenytoin, vecuronium, atracurium) |
| Lean Body Weight (LBW) | Men: (9270 × TBW) / (6680 + 216×BMI); Women: (9270 × TBW) / (8780 + 244×BMI) | Lipophilic drug loading doses (propofol induction, fentanyl, remifentanil, thiopental) |
| Corrected/Adjusted Body Weight (CBW) | IBW + 0.4 × (TBW − IBW) | Drugs with intermediate distribution (e.g., propofol infusion in some protocols); aminoglycoside dosing adjustment |
| Body Mass Index (BMI) | Weight (kg) / Height (m²) | Classification of obesity severity; not directly used for dosing |
8. General Dosing Rules Based on Drug Properties
| Drug Property | Vd Change | Clearance | Dosing Strategy |
|---|---|---|---|
| Highly lipophilic | Greatly increased | Unchanged or increased | Loading dose: LBW; Maintenance: TBW (if clearance increased) |
| Moderately lipophilic | Modestly increased | Variable | Loading dose: LBW or IBW + 20-40% correction |
| Hydrophilic | Little or no change | Increased (renal) | Loading and maintenance: IBW |
| Renally excreted | Unchanged | Increased | May need higher dose or shorter interval than lean patients |
| Phase II metabolised | Slightly increased | Increased | Maintenance doses closer to TBW-based |
9. Specific Drug Examples
| Drug | Dosing Basis in Obesity | Reason |
|---|---|---|
| Succinylcholine | TBW | Pseudocholinesterase activity increases with weight; large ECF compartment |
| Propofol induction | LBW | Rapid redistribution; CO is the main determinant of peak plasma concentration |
| Propofol infusion | TBW | Clearance and Vd at steady state correlate with body weight |
| Fentanyl | LBW | Clearance correlates with lean body weight; TBW dosing risks overdose |
| Midazolam, lorazepam | IBW | Avoid accumulation in fat depot; respiratory depression risk |
| Aminoglycosides | IBW (+correction) | Primarily hydrophilic; increased renal clearance; avoid TBW-based overdosing |
| Digoxin | IBW | Does not distribute significantly into fat despite lipophilicity |
| Vecuronium, atracurium | IBW | Distribution largely restricted to lean tissues |
| Benzodiazepines (long-acting) | TBW for loading, IBW for maintenance | High lipophilicity necessitates larger initial dose, but fat depot causes prolonged effect |
Summary
| PK Parameter | Effect of Obesity | Clinical Implication |
|---|---|---|
| Vd | Increased (lipophilic drugs) / unchanged (hydrophilic) | Adjust loading dose using appropriate weight scalar |
| Protein binding | α₁-acid glycoprotein increased; albumin unchanged | Monitor free drug levels for narrow-index drugs |
| Oral absorption | Largely unchanged | No adjustment usually needed |
| Hepatic metabolism (Phase II) | Enhanced | Maintenance dose may need to be higher or TBW-based |
| Renal clearance | Increased (GFR, tubular secretion) | Increase dose/frequency of renally cleared drugs |
| t½ (lipophilic drugs) | Prolonged | Longer dosing intervals; watch for accumulation |
Core principle: Use Vd to guide the loading dose, and clearance to guide the maintenance dose. When Vd and/or clearance increases, simple mg/kg (TBW) dosing without correction leads to either overdose or underdose depending on the drug's physicochemical properties.
10. The elimination half-life and Vd of tobramycin was reported to be 2.15 hours and 33.5% of body weight respectively. What is the dose for an 80 Kg individual if a steady state level of 2.5 microgram/ml is desired? Assume that the drug is given as IV bolus every 8 hours.