
How can we assess that a drug is following Two Compartment Model. In medium length and easy wording
Reading File
Finding Sources
Finding Sources
Reading File
Reading File
Reading File
Reading File
Searching PubMed
"two-compartment model" pharmacokinetics
Loading Image
Assessing Whether a Drug Follows a Two-Compartment Model
Basic idea: In a one-compartment model, the drug distributes instantly throughout the body, so plasma concentration falls in a single, constant rate. In a two-compartment model, the drug first equilibrates into a "central" compartment (blood + highly perfused tissues) and then more slowly redistributes into a "peripheral" compartment (less perfused tissues), so the decline in plasma level happens in two distinct steps.
Here is how you can tell, in practice:
1. Plot concentration vs. time on a semi-log graph
Give the drug as an IV bolus, take blood samples over time, and plot the natural log (or log10) of plasma concentration against time.
- If the drug follows a one-compartment model, this plot is a single straight line (one constant slope = one elimination rate constant).
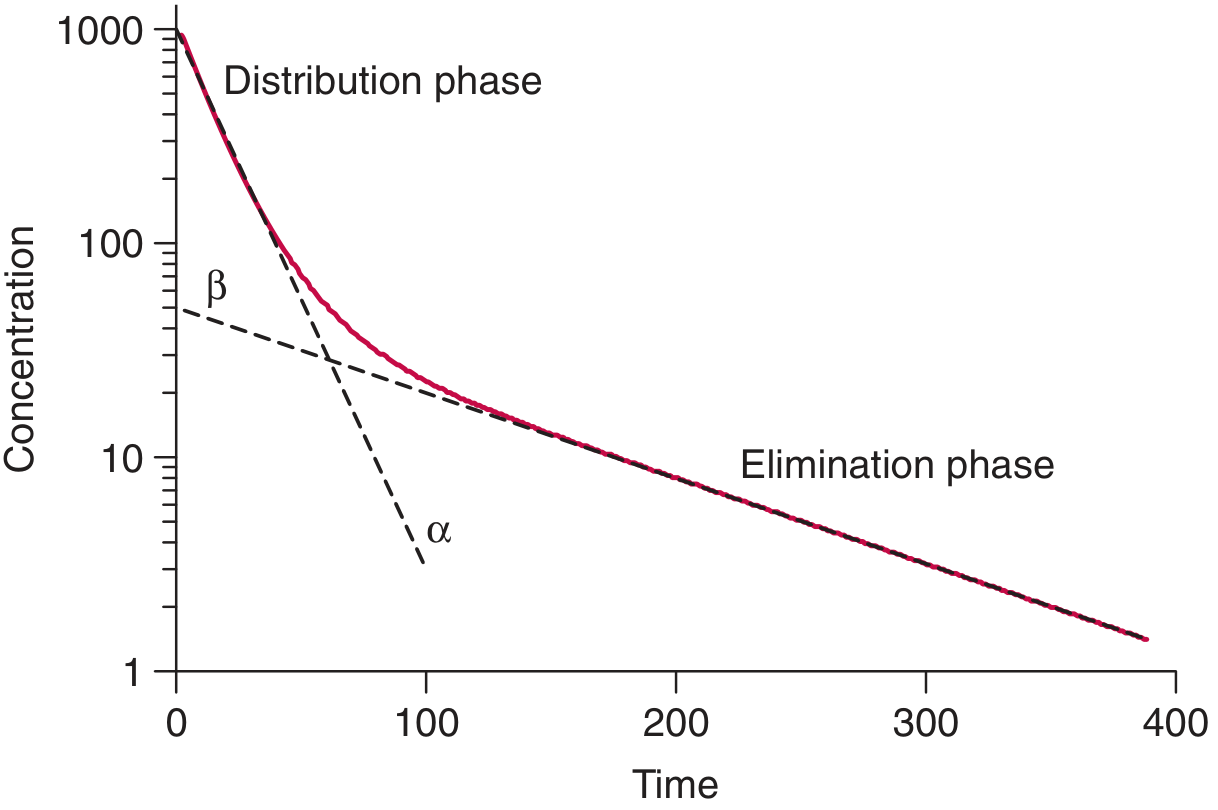
- If the drug follows a two-compartment model, the plot is curved, not straight, and actually consists of two straight-line segments joined together, a steep early slope followed by a shallower late slope (Barash, Cullen, and Stoelting's Clinical Anesthesia, p. 754).
2. Look for the two distinct phases
- Distribution phase (fast, steep drop): concentration falls quickly right after injection mainly because drug is leaving the plasma and moving into tissues, not because it's being eliminated yet.
- Elimination phase (slower, gentler slope): once distribution is essentially complete, the concentration falls more slowly, now reflecting true metabolism/excretion.
If you see this "bend" or break in slope on the semi-log plot rather than one continuous straight line, that is the hallmark sign of a two-compartment (biexponential) drug (Tietz Textbook of Laboratory Medicine, 7th Ed., p. 1450).
3. Confirm with the "method of residuals" (feathering/curve-stripping)
This is the classic manual technique to prove biexponential behavior:
- Take the later, straight-line part of the curve (the elimination phase) and extrapolate it backward to time zero. Its slope is called β and its intercept is B.
- Subtract this extrapolated elimination line from the actual early data points. What is "left over" (the residuals) forms a new straight line, this represents the distribution phase, with slope α and intercept A.
- If these residuals do form a clean straight line (rather than scatter randomly), the drug's decline truly fits the sum of two exponentials, confirming a two-compartment model.
4. Fit the biexponential equation
The concentration-time data should mathematically fit:
Cp(t) = A·e^(-αt) + B·e^(-βt)
where A and B are the y-intercepts and α and β are the rate constants of the distribution and elimination phases respectively (Barash, Cullen, and Stoelting's Clinical Anesthesia, p. 756; Tietz Textbook of Laboratory Medicine, p. 1450). If a one-exponential equation (single term, Ct = C0·e^-ket) already fits the data well statistically, the drug is one-compartment; if it needs the two-term sum to fit properly, it's two-compartment.
5. Use statistical model-fitting criteria
In practice (especially with computer software), you don't just eyeball the graph, you fit both a one-compartment and a two-compartment model to the same data and compare goodness-of-fit measures (such as Akaike Information Criterion, sum of squared residuals, or visual inspection of residual plots). The model that fits the data significantly better with fewer/appropriate parameters is chosen. As the Tietz textbook notes, "which model is best for a particular drug is somewhat empirical and based on model-fitting statistics" (Tietz Textbook of Laboratory Medicine, p. 1450).
Quick summary table
| Clue | One-compartment | Two-compartment |
|---|---|---|
| Semi-log plot shape | Single straight line | Curved, then two straight segments |
| Early rapid drop after IV bolus | Absent | Present (distribution phase) |
| Residuals after subtracting terminal slope | Random scatter | Forms a second straight line |
| Best-fit equation | Single exponential | Sum of two exponentials (biexponential) |
This same logic extends to three-compartment models (a third, very slow phase, e.g., drug trapped in fat) when even the "elimination" phase itself turns out to be curved rather than a true straight line.
Real drug examples that are documented as following two-compartment kinetics include rifabutin and ethambutol, both shown to have biexponential decline fitted to two-compartment models with first-order absorption and elimination (Goodman & Gilman's The Pharmacological Basis of Therapeutics).
This is standard, well-established pharmacokinetic theory that hasn't changed with recent literature; a quick check of recent systematic reviews/meta-analyses turned up only drug-specific population PK studies (e.g., venetoclax, betamethasone) that apply this same classical framework, not conflicting concepts.
This is a shared conversation. Sign in to Orris to start your own chat.