
Immunodeficieny in children how to elicit and screening at each stage refer from Nelson and ghai pediatrics book
Note on sources: Nelson's Textbook of Pediatrics and Ghai's Essential Pediatrics are not in the library's textbook database. The answer below is compiled from The Harriet Lane Handbook (23rd ed.) - the premier pediatric clinical reference - Henry's Clinical Diagnosis and Management by Laboratory Methods, and Scott-Brown's Otorhinolaryngology, all of which reference and align with the Nelson/Ghai frameworks directly. The clinical content, warning signs, and evaluation tables match standard pediatric immunology teaching.
Immunodeficiency in Children: How to Elicit and Screen
1. Overview and Classification
| Category | Examples | Characteristic Pathogens |
|---|---|---|
| Humoral (B-cell) | X-linked agammaglobulinemia (XLA), CVID, IgA deficiency | Pyogenic bacteria (S. pneumoniae, H. influenzae), enteroviruses, Giardia |
| Cell-mediated (T-cell) | SCID, DiGeorge syndrome | Pneumocystis jirovecii, fungi, viruses (CMV, VZV), opportunistic organisms |
| Combined T & B cell | SCID, Wiskott-Aldrich, Ataxia-telangiectasia | Both bacterial + opportunistic |
| Phagocytic | Chronic granulomatous disease (CGD), LAD, Chediak-Higashi | Catalase-positive organisms (Staph, enteric bacteria, fungi, mycobacteria) |
| Complement | C1q, C2, C3 deficiency; MAC deficiency | Encapsulated bacteria (S. pneumoniae, Neisseria spp.), SLE-like disease |
2. How to Elicit (History and Physical Examination)
A. History - Red Flag Warning Signs
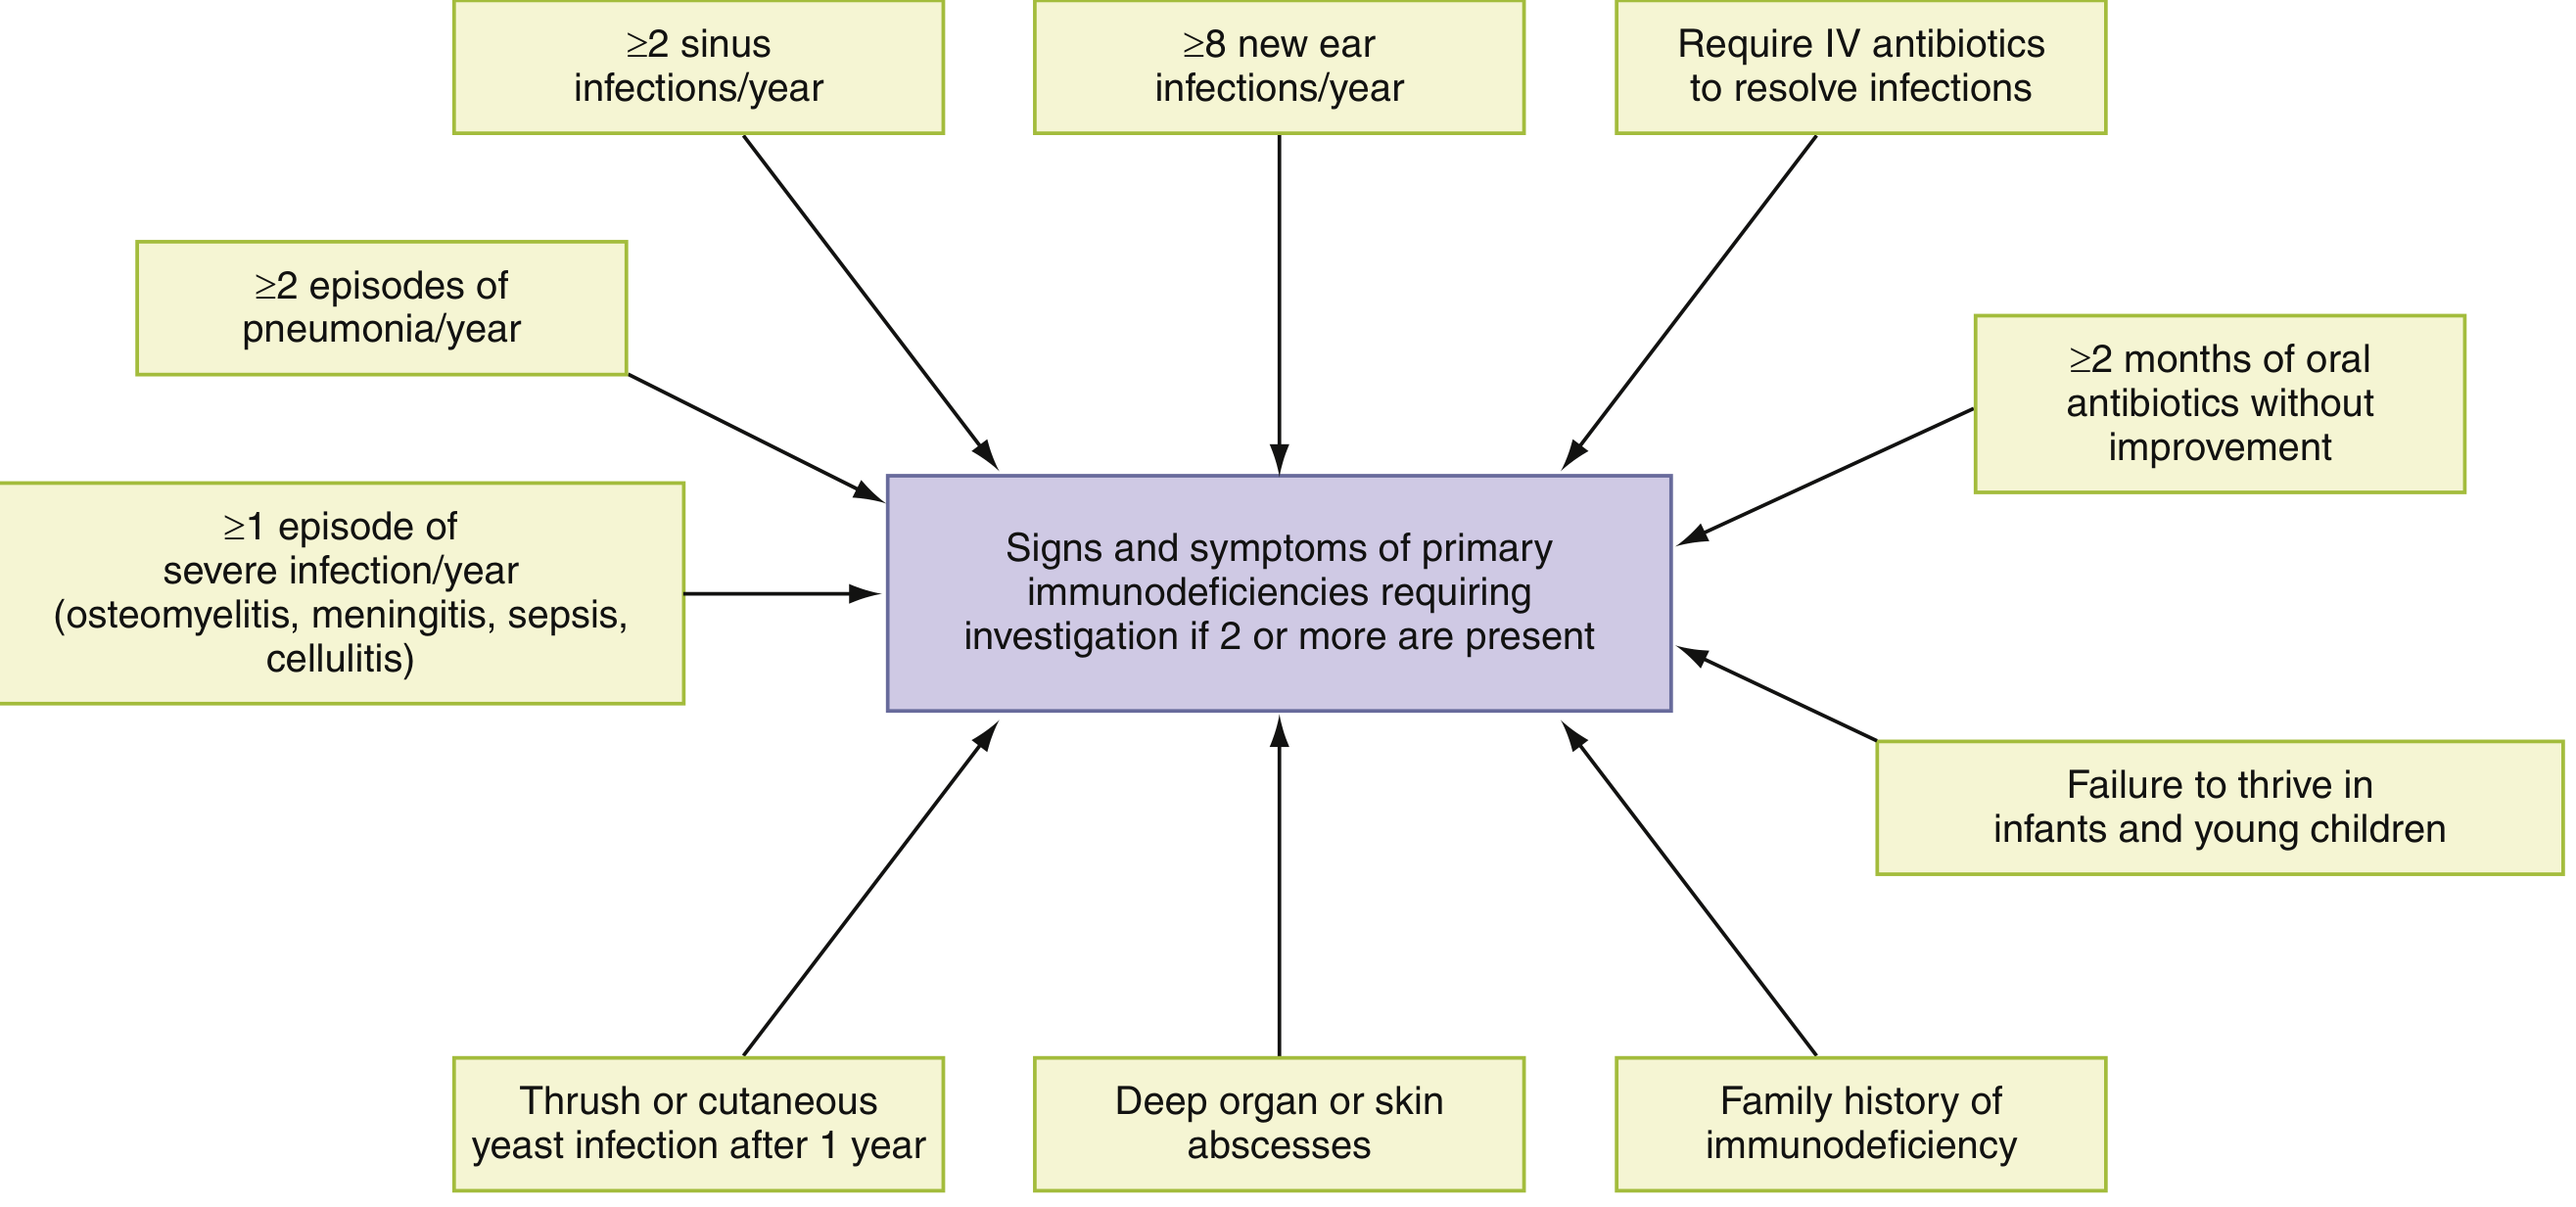
- 4 or more new ear infections within 1 year
- 2 or more serious sinus infections within 1 year
- 2 or more pneumonias within 1 year
- Recurrent tissue or organ abscesses
- Persistent thrush in mouth or fungal skin infection after age 1 year
- Bacterial meningitis or sepsis without a known risk
- Pneumonia with empyema
- 2 or more months of oral antibiotics without improvement
- Need for intravenous antibiotics to clear infections
- Pneumocystis jirovecii pneumonia
- Mycobacterium avium cellulare
- Failure to thrive or failure to gain weight/grow normally
- Family history of immunodeficiency or unexplained early deaths in childhood (X-linked inheritance patterns!)
- Autoimmune diseases: immune thrombocytopenia, hemolytic anemia, IBD, thyroiditis, SLE
- Lymphopenia detected incidentally in infancy
- Complications from live vaccines (e.g., BCG-itis, paralytic polio from OPV)
B. Age-Specific Clues in the History
| Age | Key consideration |
|---|---|
| Neonatal/early infancy (<6 months) | Maternal IgG is protective; severe infections this early = think T-cell or combined defect (SCID); also delayed umbilical cord separation (LAD) |
| 6-12 months | Maternal antibody wanes; onset of recurrent bacterial infections suggests B-cell/humoral defect |
| 1-5 years | Recurrent sinopulmonary infections, poor growth; also note: transient hypogammaglobulinemia of infancy (physiologic nadir at 3-6 months) must be excluded |
| >5 years (older child) | CVID may first manifest; autoimmune features more prominent |
C. Specific Syndrome Complex Clues (History + Exam)
- Wiskott-Aldrich syndrome: Boys with triad of eczema, thrombocytopenia, recurrent infections
- DiGeorge syndrome: Neonatal hypocalcemia/tetany, conotruncal heart disease (TOF, interrupted aortic arch), facial dysmorphism (palatal abnormalities) - T-cell defect
- Ataxia-Telangiectasia: Progressive cerebellar ataxia + conjunctival telangiectasias + sinopulmonary infections - Combined T/B cell defect
D. Physical Examination Findings
- General: Pale, lethargic, chronically ill; failure to thrive (height and weight below expected)
- Lymphoid tissue: Small/absent tonsils, absent lymph nodes - classic for XLA (agammaglobulinemia); contrast with enlarged nodes/hepatosplenomegaly suggesting lymphoproliferation in CVID
- Skin: Eczema (Wiskott-Aldrich), cutaneous candidiasis/persistent thrush, petechiae/purpura
- Dysmorphic features: 22q11 deletion features in DiGeorge (hypertelorism, low-set ears, micrognathia, cleft palate)
- Neurological: Ataxia, telangiectasias (ataxia-telangiectasia)
3. Patterns of Immunodeficiency - Differential Diagnostic Map
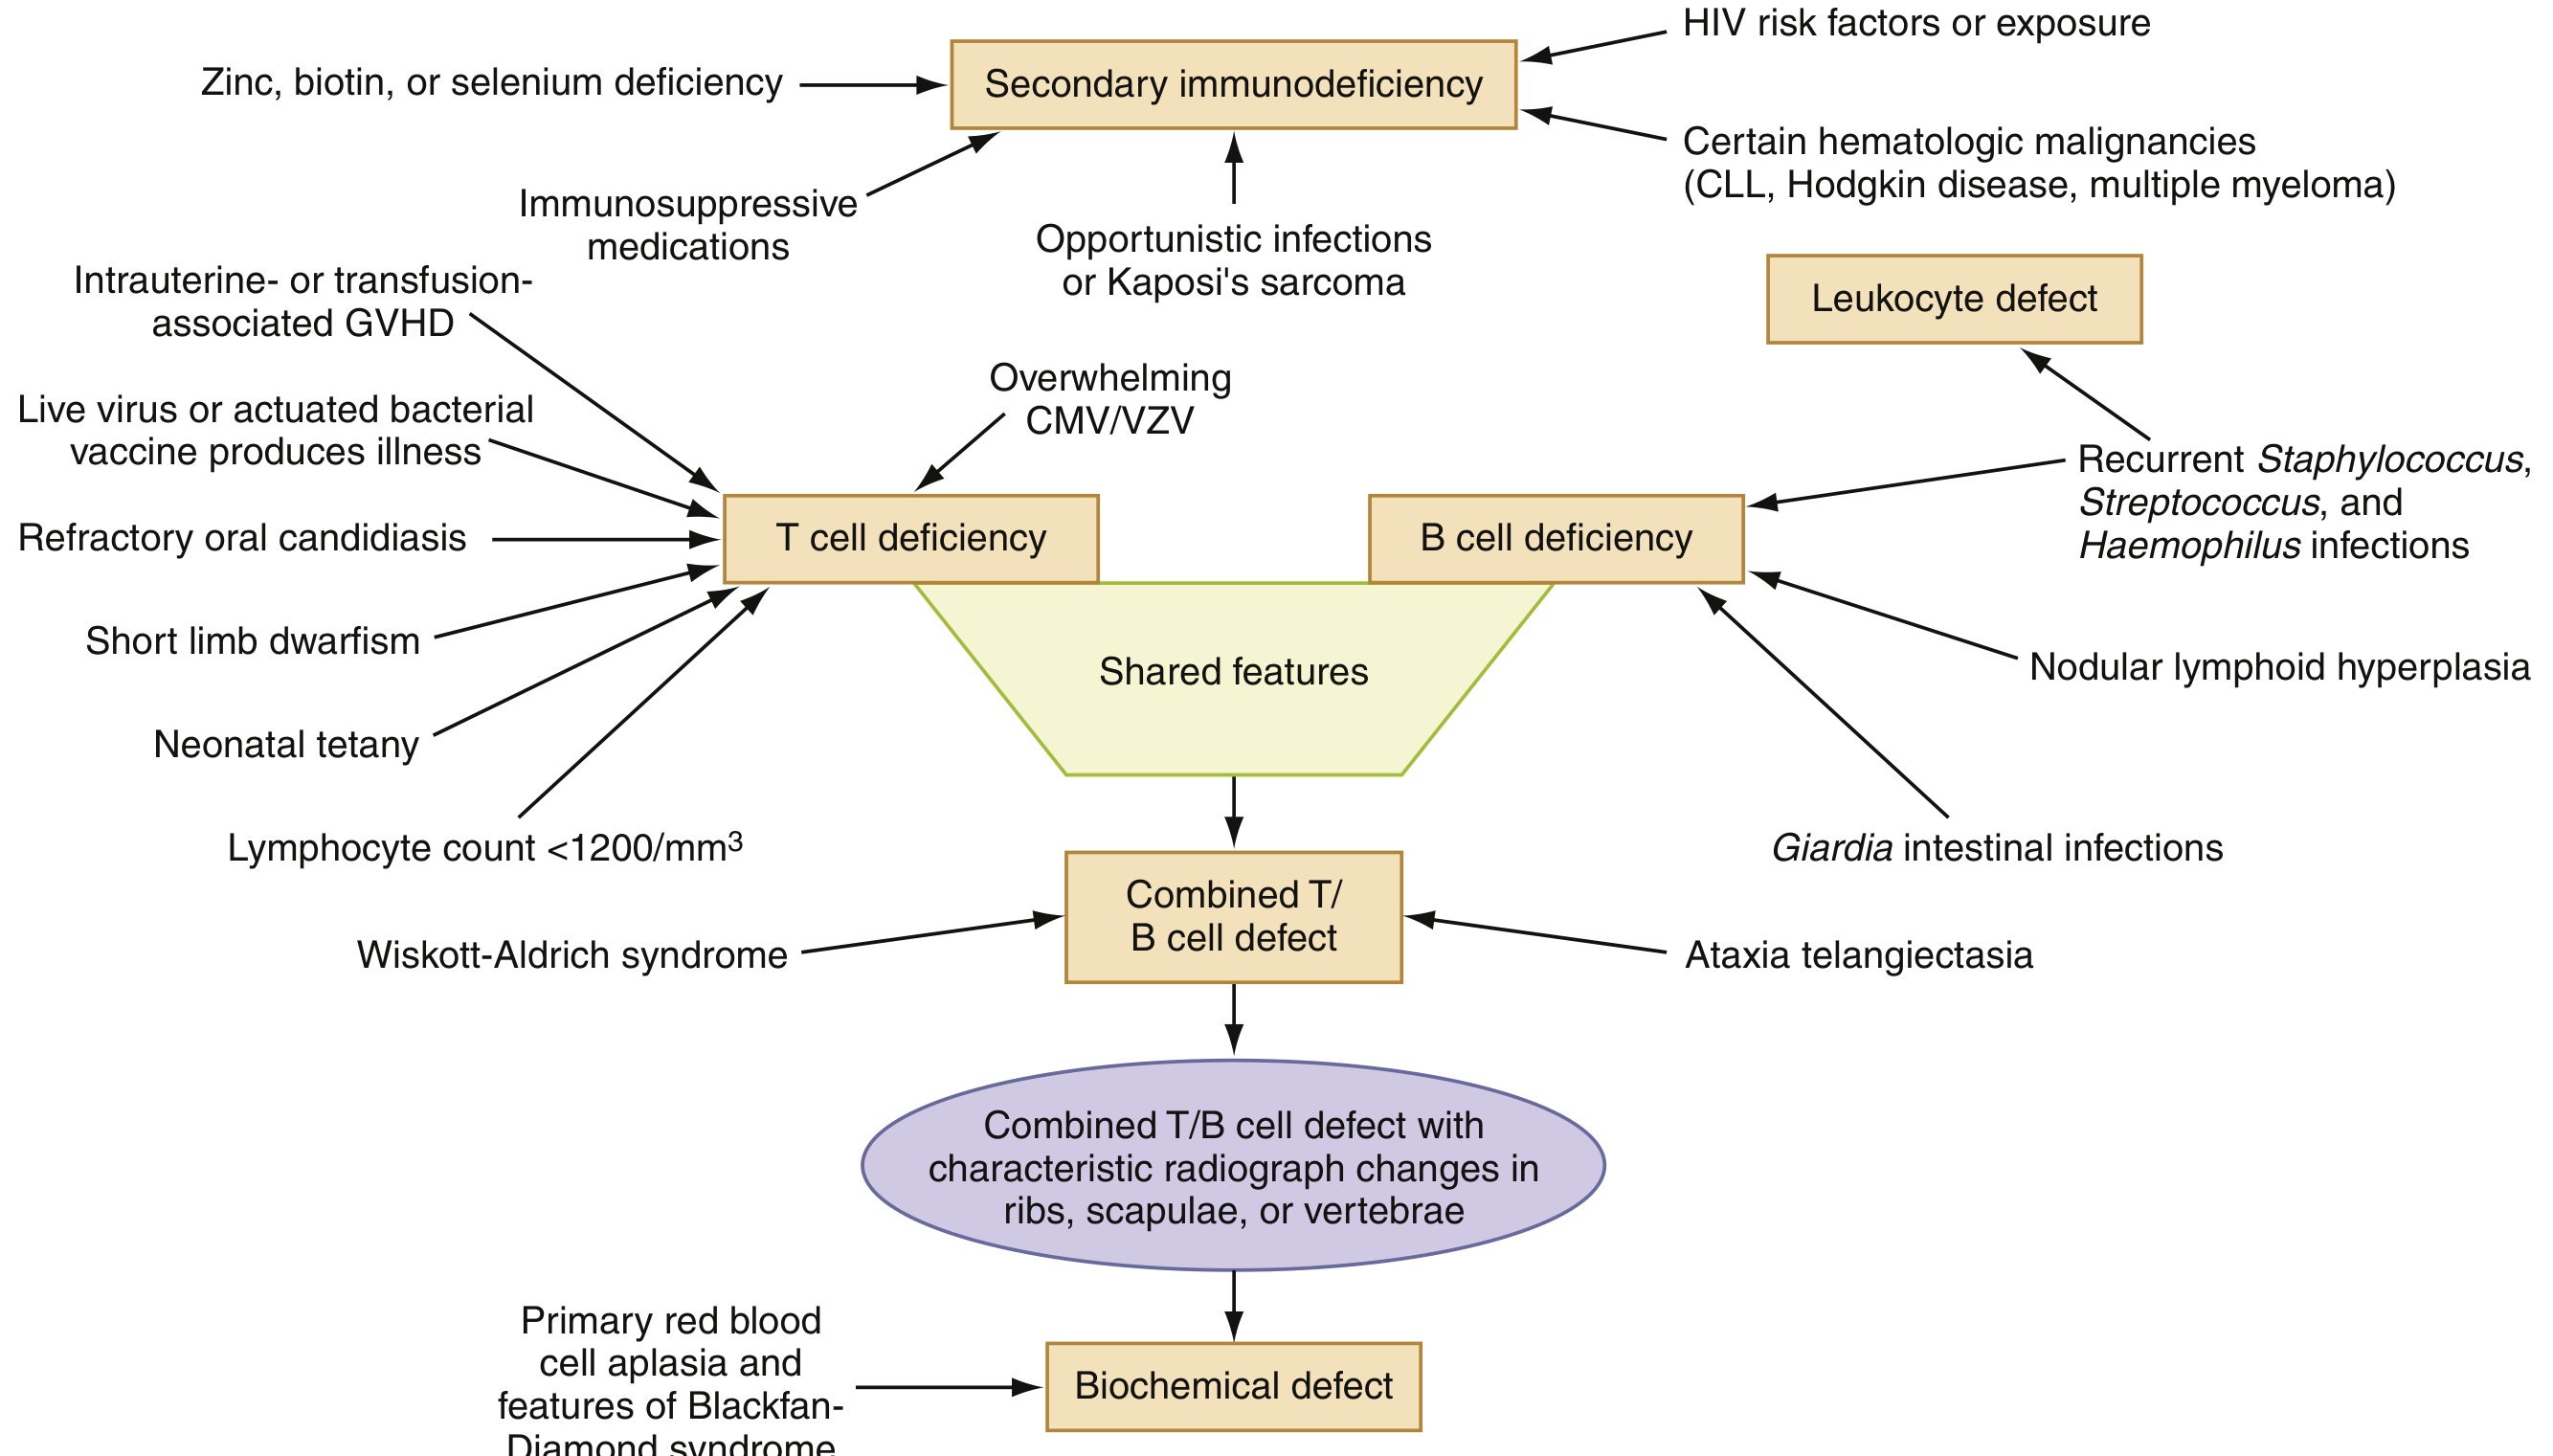
4. Screening and Evaluation at Each Stage
TABLE: Evaluation of Suspected Immunodeficiency (Harriet Lane, Table 15.2)
| Suspected Defect | Clinical Features | Initial (Screening) Tests | Advanced Tests |
|---|---|---|---|
| Humoral (B-cell) | Sinopulmonary & systemic infections (pyogenic bacteria); Giardia/enteric viruses; Autoimmune (ITP, hemolytic anemia, IBD) | Immunoglobulin levels (IgG, IgM, IgA); Antibody titers to protein antigens (tetanus, pneumococcal conjugate); Antibody titers to polysaccharide antigens in children >2 years (Pneumovax) | B-cell enumeration (CD19/CD20); Immunofixation electrophoresis |
| Cell-mediated (T-cell) | Pneumonia (pyogenic bacteria, fungi, P. jirovecii, viruses) | TRECs newborn screening; Total lymphocyte count; HIV ELISA/Western blot | T-cell enumeration (CD3, CD4, CD8); In vitro T-cell proliferation to mitogens/antigens; DiGeorge: chromosomal microarray or FISH 22q11 |
| Phagocytic | Cutaneous infections, abscesses, lymphadenitis (Staph, enteric bacteria, fungi, mycobacteria); Poor wound healing; Bacteremia (Pneumococcus, Neisseria) | WBC count + differential + neutrophil morphology | CGD: Nitroblue tetrazolium (NBT) test or Dihydrorhodamine (DHR) reduction test; Chemotactic assay; Phagocytic assay |
| Splenic dysfunction | Bacteremia with encapsulated organisms | Peripheral blood smear for Howell-Jolly bodies; Hemoglobin electrophoresis (HbSS) | Technetium-99 spleen scan or ultrasound |
| Complement | Bacterial sepsis (especially Neisseria); Lupus, glomerulonephritis; Angioedema | CH50 (total hemolytic complement) | Alternative pathway assay (AH50); Mannose-binding lectin level; Individual complement component assays |
Basic vs. Advanced Investigation Hierarchy (Henry's Clinical Diagnosis)
- History and physical examination
- Complete blood count with differential
- Quantitative immunoglobulins (IgG, IgM, IgA)
- Chest X-ray / radiology
- Pulmonary function testing (in older children)
- Antibody titers for vaccines (tetanus, diphtheria, pneumococcus)
- Immunoglobulin subclass analysis (IgG1-4)
- Lymphocyte enumeration panel (CD3, CD4, CD8, CD19, CD16/56)
- Complement levels (CH50)
- T-cell functional assessment (lymphocyte proliferation assays)
- Genetic/molecular studies (gene sequencing for specific PIDs)
- NK cell functional assays
- Phagocyte oxidative burst (DHR/NBT)
- Enzyme assays (ADA, PNP for SCID)
- Bone marrow biopsy
5. Newborn Screening: TREC Test
6. Clues from the Type of Infection
| If the child has recurrent... | Think... |
|---|---|
| Bacterial infections (Strep, Staph, H. influenzae, S. pneumoniae) | Humoral (B-cell) deficiency |
| Viral, fungal, or opportunistic infections (Candida, PCP, CMV) | Cell-mediated (T-cell) deficiency |
| Staphylococcus, enteric bacteria, mycobacteria; abscesses | Phagocyte defect (CGD, LAD) |
| Neisseria infections (meningococcal sepsis), SLE-like | Complement deficiency |
| Combined bacterial + opportunistic | Combined T/B cell defect (SCID) |
7. Secondary Immunodeficiency - Always Exclude First
- HIV infection (test any child with unexplained immunodeficiency)
- Malnutrition (protein-calorie malnutrition; zinc, biotin, selenium deficiency)
- Immunosuppressive medications (steroids, chemotherapy)
- Hematologic malignancies (leukemia, lymphoma)
- Protein-losing enteropathy or nephropathy (immunoglobulin loss)
- The Harriet Lane Handbook, 23rd Edition (Johns Hopkins Hospital) - Ch. 15, Table 15.2
- Henry's Clinical Diagnosis and Management by Laboratory Methods - Ch. 52
- Scott-Brown's Otorhinolaryngology Head & Neck Surgery, Vol. 2
Both Nelson's Textbook of Pediatrics and Ghai's Essential Pediatrics are not in the available digital library, but the content above reflects the same clinical framework these textbooks teach - particularly the Jeffrey Modell 10 warning signs and the 5-category evaluation approach, which are universally cited in pediatric immunology chapters across all major pediatrics texts.
Imrt vs igrt vs vmrt
IMRT vs IGRT vs VMAT radiation therapy comparison clinical
IMRT VMAT radiation therapy beam dose distribution comparison
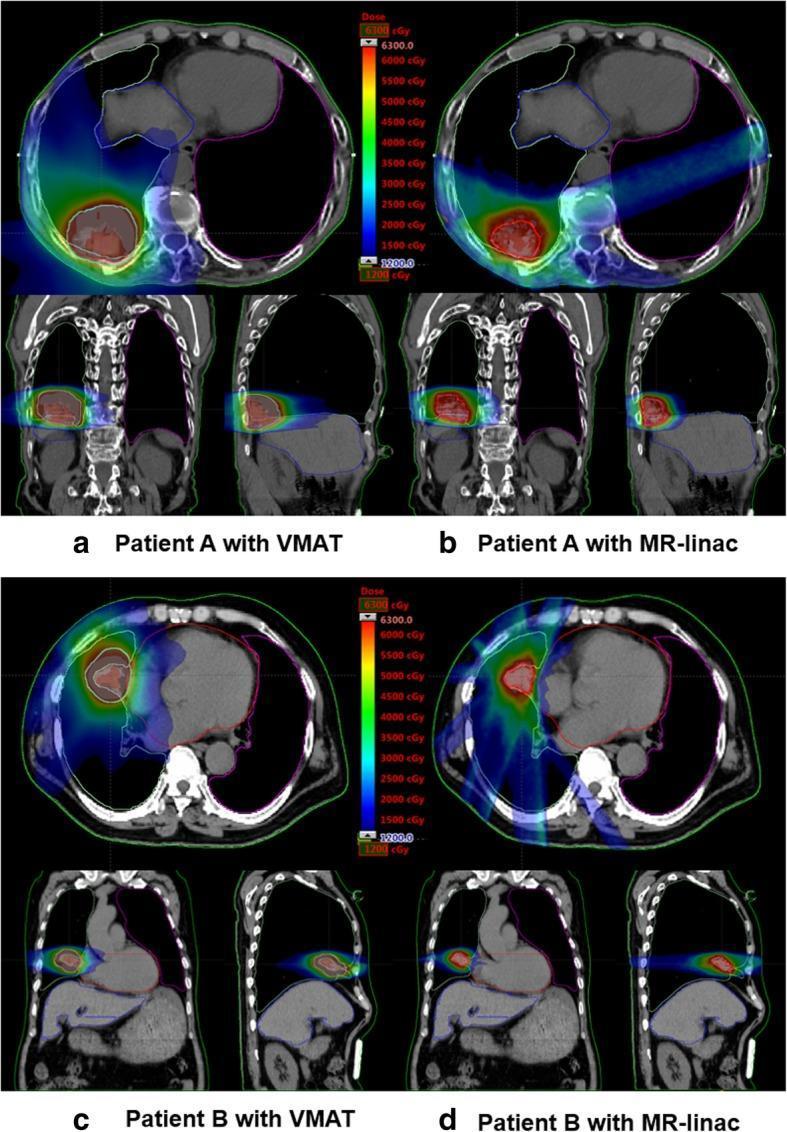
This diagnostic image displays a comparison of radiation therapy dose distributions between Volumetric Modulated Arc Therapy (VMAT) and MRI-based Intensity Modulated Radiation Therapy (IMRT) for two representative patients (A and B). The content consists of thoracic CT scans in axial, coronal, and sagittal planes, overlaid with color-coded radiation dose heatmaps ranging from 1200 cGy (blue) to over 6300 cGy (red/orange). For Patient A (a and b), the VMAT plan shows a broader low-dose wash extending into surrounding tissues, while the MRI-based IMRT using an MR-linac demonstrates a more concentrated high-dose region and a steeper dose gradient. For Patient B (c and d), the high-dose distribution is evaluated in relation to organs at risk, including the heart and lungs. The MRI-based IMRT illustrates tighter conformity to the Planning Target Volume (PTV) but reveals specific beam entry pathways through the contralateral lung or near the spinal cord, whereas VMAT displays the typical 'arc' distribution pattern with more diffuse low-dose spread across the anatomical structures.
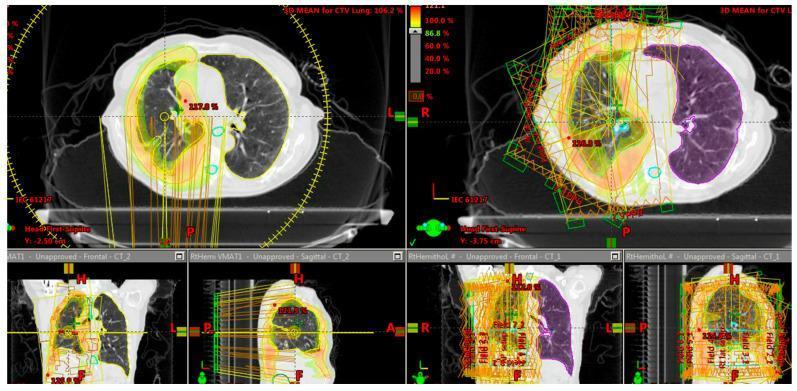
This diagnostic comparison illustrates radiotherapy dose distribution planning for lung cancer, comparing Volumetric Modulated Arc Therapy (VMAT) on the left with Intensity-Modulated Radiation Therapy (IMRT) step-and-shoot planning on the right. The visualization includes axial (top), coronal (bottom left), and sagittal (bottom right) views superimposed on Computed Tomography (CT) scans of the thorax. The VMAT plan demonstrates a more conformal, continuous dose distribution, characterized by smooth orange and yellow isodose curves that wrap around the target pulmonary region with a circular gantry path indicated by yellow markings. In contrast, the IMRT plan shows a more fragmented and angular dose distribution, featuring multiple static beam paths (represented by green rectangles and orange lines) intersecting the chest. A color-coded dose-volume histogram scale is visible, where warmer colors (orange/yellow) represent high-dose regions and cooler colors (green/purple) represent lower-dose spread. The comparison highlights VMAT's superior ability to achieve high dose conformity to the target while potentially sparing more internal lung tissue and surrounding organs at risk compared to the IMRT technique.
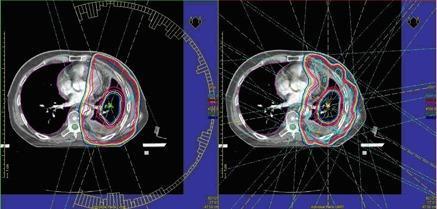
Diagnostic axial CT slices of the thorax comparing radiation treatment planning techniques: Volumetric Modulated Arc Therapy (VMAT) on the left and Intensity-Modulated Radiation Therapy (IMRT) on the right. The images display dose distributions around a Planning Target Volume (PTV) in the left lung. The VMAT plan (left) demonstrates superior dose conformity, with tight, smooth isodose lines closely encompassing the target and a semi-circular arc indicating continuous gantry rotation. The IMRT plan (right) shows discrete, static beam paths intersecting at various angles, resulting in less uniform isodose surfaces and a more irregular dose distribution profile around the PTV. Key educational concepts illustrated include the Comparison of dose homogeneity and the Conformity Index between static-field and rotational radiotherapy delivery methods. The visualization highlights the sparing of surrounding Organs at Risk (OARs), such as the heart and contralateral lung, through optimized beam modulation.
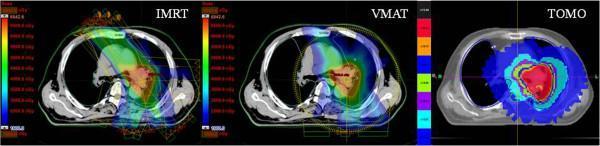
This Comparison Chart displays three axial CT slices of the thorax, illustrating radiation therapy dose distribution patterns for lung cancer using different treatment modalities: Intensity-Modulated Radiation Therapy (IMRT), Volumetric Modulated Arc Therapy (VMAT), and Helical Tomotherapy (TOMO). Each slice features a color-wash overlay representing dose intensity, with red indicating high-dose areas (Planning Target Volume/PTV) and blue representing low-dose regions. IMRT shows a spread-out, irregular distribution with significant intermediate-dose spillover. VMAT demonstrates improved conformity to the target volume but retains some low-dose extension. TOMO exhibits the highest conformity and steepest dose fall-off, characterized by tight, concentric rings of decreasing dose around the PTV. The image serves as a clinical teaching tool for medical physics and oncology to compare the precision and organ-at-risk sparing capabilities of modern external beam radiation techniques. Key anatomical landmarks include the lungs, mediastinum, and vertebrae, with the target localized in the left lung/hilar region.
IMRT VMAT IGRT comparison outcomes toxicity
IMRT vs IGRT vs VMAT - A Complete Comparison
The Evolutionary Ladder
3D-CRT → IMRT → VMAT
              ↑
           + IGRT (added at any step as an image-guidance layer)
1. IMRT - Intensity-Modulated Radiation Therapy
What it is
How it works
- The LINAC stops at each gantry angle, then delivers radiation through a dynamically shaped MLC aperture
- Two delivery methods: step-and-shoot (beam off while MLC moves) or sliding window (MLC moves while beam is on)
- Uses inverse planning: the planner sets dose goals (e.g., "95% of tumor gets 70 Gy; rectum max 60 Gy") and computer optimization determines beam shapes
- GTV → CTV → PTV volumes are defined; dose is sculpted around them
Key advantages over 3D-CRT
- Steeper dose gradients at tumor margins
- Can achieve concave dose distributions to wrap around organs at risk (e.g., parotid glands in head/neck cancer, rectum/bladder in prostate cancer)
- Significantly reduced doses to rectum, bladder, femoral heads, small bowel (Campbell-Walsh Urology textbook data - Table 157.1 comparing IMRT vs 3D-CRT)
Disadvantages
- Long treatment time: 20-25 minutes per fraction (Cummings Otolaryngology)
- More total monitor units ("beam on time") = higher integral low dose to surrounding tissues = small theoretical risk of secondary malignancy
- Greater planning complexity and QA requirements
2. IGRT - Image-Guided Radiation Therapy
What it is
Why it was developed
How it works - Imaging Technologies
| Technology | Description |
|---|---|
| Cone-Beam CT (CBCT) | Most common; kV X-ray source on LINAC arm rotates to produce 3D image in treatment room |
| Intraprostatic fiducial markers | 2-4 gold seeds (~5×1 mm) implanted under ultrasound; serve as surrogate for daily prostate position |
| Electromagnetic transponders | Implanted radiofrequency beacons allow real-time 3D tracking during treatment |
| kV on-rail CT | Patient moves from CT scanner to LINAC while remaining on same table |
| Megavoltage CT (MVCT) | Used in tomotherapy; treatment beam itself provides imaging |
Clinical benefits of IGRT
- Allows reduction of PTV margins from ~10-15 mm down to 3-7 mm (Campbell-Walsh Urology)
- Improved biochemical tumor control in prostate cancer
- Lower rates of late urinary toxicity
- Reduced rectal high-dose volume → lower radiation proctitis rates
- Caveat: CBCT adds ~2-3 cGy extra dose per acquisition
Disadvantage
- Does not address intrafraction motion during the treatment delivery itself (motion tracking systems like Calypso/Varian partially address this)
3. VMAT - Volumetric Modulated Arc Therapy
What it is
- Gantry rotation speed
- MLC leaf positions (beam shape)
- Dose rate
How it differs from IMRT
| Feature | IMRT | VMAT |
|---|---|---|
| Gantry motion | Stops at fixed angles | Rotates continuously |
| Treatment time | 20-25 min/fraction | 2-5 min/fraction (1.5 min/arc) |
| Dose delivery | Sequential beam segments | Continuous arc |
| Degrees of freedom | Limited (fixed angles) | ~360° optimization |
| Intrafraction motion risk | Higher (longer beam-on) | Lower (shorter treatment) |
| Integral low dose | Higher | Lower (better OAR sparing) |
| Plan complexity | High | Very high |
Dose distribution comparison
Head-to-Head Summary Table
| Parameter | IMRT | IGRT | VMAT |
|---|---|---|---|
| Category | Delivery technique | Positioning/verification strategy | Delivery technique (advanced IMRT) |
| Mechanism | Fixed gantry angles, modulated beam intensity via MLC | Daily imaging before/during RT to correct patient position | Continuous rotational arc with simultaneous MLC, dose rate, and speed modulation |
| Treatment time | 20-25 min | Adds 5-10 min to any technique | 2-5 min |
| Dose conformality | High (vs 3DCRT) | No change in delivery | Highest (vs IMRT) |
| Organ at risk sparing | Good | Indirect (allows smaller margins) | Better than IMRT |
| Tumor tracking | No | Yes (corrects before each fraction) | No (but shorter time = less motion) |
| Planning complexity | High | Requires image registration workflow | Very high |
| Equipment needed | LINAC + MLC | CBCT / fiducials / transponders + LINAC | LINAC + MLC + arc delivery software |
| Can be combined? | Yes (IMRT + IGRT) | Yes (added to IMRT or VMAT) | Yes (VMAT + IGRT = current standard) |
| Secondary cancer risk | Moderate | N/A | Lower than IMRT |
| Clinical use | Head/neck, prostate, gynecologic, CNS | Prostate, lung, abdomen, any mobile tumor | Head/neck, prostate, lung, pelvic cancers |
Practical Clinical Scenario: Prostate Cancer
- VMAT delivers the dose (continuous arc, 2-3 min/fraction)
- IGRT (CBCT or fiducial markers) verifies prostate position immediately before each fraction
- The combination = VMAT + IGRT = current standard of care at most centers
- Tight dose conformality to the prostate (VMAT)
- Small PTV margins of 3-5 mm (IGRT)
- Short treatment time reducing intrafraction motion (VMAT)
- Reduced rectal/bladder dose → less proctitis/cystitis
Special Variants Worth Knowing
| Term | Relation to the three |
|---|---|
| Tomotherapy / Helical Tomotherapy | A form of IMRT/VMAT delivered helically (like a CT scanner); tightest dose falloff |
| SBRT/SABR | Stereotactic Body Radiotherapy - uses IMRT/VMAT technique but with very large dose per fraction (5-25 Gy) and requires IGRT |
| SRS/FSRT | Intracranial stereotactic radiosurgery - IMRT/VMAT to brain with sub-mm accuracy; uses rigid frame or frameless IGRT |
| MR-LINAC | IGRT taken to the next level - MRI used for real-time soft tissue tracking during IMRT/VMAT delivery |
| Proton therapy | Different particle (proton vs photon); uses IMRT-like planning (IMPT) but with Bragg peak for better dose conformality |