
How catacholamine works
catecholamine adrenergic receptor signaling mechanism
![This pathophysiology diagram illustrates the role of the Beta-2 Adrenergic Receptor (ADRB2) in modulating inflammatory responses during Rhinovirus (RV) infection. The visual is divided into three primary sections: [1] depicts RV particles binding to Intercellular Adhesion Molecule 1 (ICAM-1) on the surface of airway epithelial cells (ECs). [2] demonstrates that ADRB2 activation inhibits the expression of ICAM-1 and the subsequent release of cytokines and chemokines from these epithelial cells. [3] focuses on systemic immune cell modulation, showing that ADRB2 signaling exerts inhibitory effects (indicated by red T-bars) on multiple cell types: in macrophages (Mφ), it suppresses TNF-α, IL-6, IL-1β, and various CCL chemokines; in mast cells (MC), it inhibits TNF-α, histamine, and leukotriene release; in CD4+ T cells, it suppresses IFN-γ production; and in CD8+ T cells, it blocks TNF-α, IFN-γ, and cytolytic activity. The diagram serves as an educational resource for understanding neuro-immune interactions and the therapeutic mechanism of beta-agonists in dampening virus-induced airway inflammation.](https://cdn.orris.care/cdss_images/pmc_clinical_VQA_bdc00632428101dee8d73e300a2b0ae2a72521d5b25266eddbef38d212ed1f84.jpg)
This pathophysiology diagram illustrates the role of the Beta-2 Adrenergic Receptor (ADRB2) in modulating inflammatory responses during Rhinovirus (RV) infection. The visual is divided into three primary sections: [1] depicts RV particles binding to Intercellular Adhesion Molecule 1 (ICAM-1) on the surface of airway epithelial cells (ECs). [2] demonstrates that ADRB2 activation inhibits the expression of ICAM-1 and the subsequent release of cytokines and chemokines from these epithelial cells. [3] focuses on systemic immune cell modulation, showing that ADRB2 signaling exerts inhibitory effects (indicated by red T-bars) on multiple cell types: in macrophages (Mφ), it suppresses TNF-α, IL-6, IL-1β, and various CCL chemokines; in mast cells (MC), it inhibits TNF-α, histamine, and leukotriene release; in CD4+ T cells, it suppresses IFN-γ production; and in CD8+ T cells, it blocks TNF-α, IFN-γ, and cytolytic activity. The diagram serves as an educational resource for understanding neuro-immune interactions and the therapeutic mechanism of beta-agonists in dampening virus-induced airway inflammation.
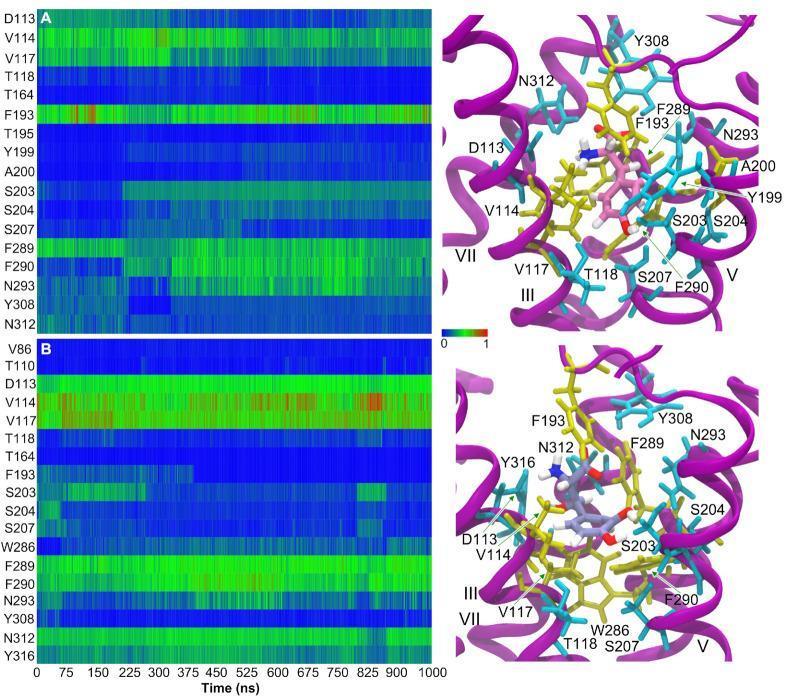
This composite educational graphic illustrates the molecular dynamics (MD) simulation results of L-DOPA and Droxidopa interacting with the human beta-2 adrenergic receptor (β2AR). On the left, two contact maps (A and B) quantify the normalized number of contacts between specific receptor residues and the respective ligands over a 1-microsecond (1000 ns) trajectory. The heatmaps use a color scale where blue represents low interaction and red indicates high interaction intensity. L-DOPA (A) shows significant persistence with residues F193 and F289, while Droxidopa (B) exhibits stronger sustained contacts with V114, F289, and N312. On the right, 3D structural snapshots depict the ligands docked within the binding pocket formed by the transmembrane helices (magenta ribbons). The receptor side chains are color-coded to distinguish chemical properties: hydrophilic residues are shown in cyan and hydrophobic residues in yellow. Labeled amino acids (e.g., D113, S203, N293) highlight the spatial arrangement and hydrogen bonding network essential for catecholamine binding. This material serves to teach the principles of pharmacological binding, receptor-ligand stability, and the structural basis of G protein-coupled receptor (GPCR) activation.
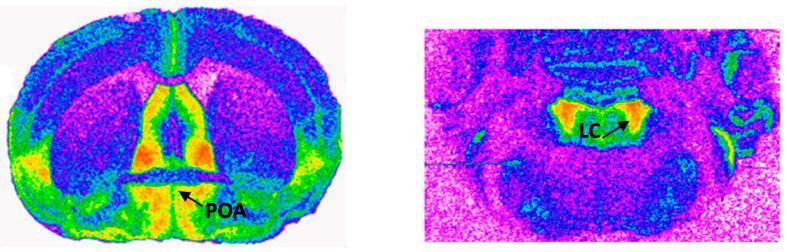
This figure presents two pseudocolor autoradiograms illustrating the distribution and density of alpha2-adrenergic receptors in rodent brain sections. The left image shows a coronal section at the level of the preoptic area (POA), where high receptor density is indicated by warm colors (red and orange) in a centrally located, elongated region along the ventral aspect. The surrounding neural tissue exhibits lower binding density, represented by cooler colors (green, blue, and purple). The right image displays a more posterior section at the level of the locus coeruleus (LC). In this section, high alpha2-adrenergic receptor density is concentrated in a compact, localized area within the LC itself, demarcated in bright orange and red. These images demonstrate neuroanatomical variations in receptor expression, with the POA showing a more diffuse ventral distribution compared to the highly focused concentration in the LC. Such visual data is essential for understanding catecholaminergic signaling pathways and the pharmacological mapping of adrenergic receptors in the central nervous system.
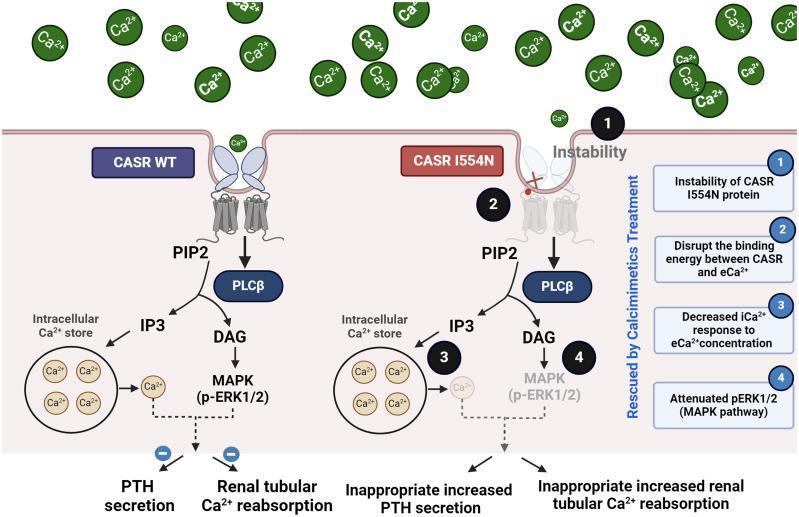
This pathophysiology diagram illustrates the molecular mechanism of the Calcium-Sensing Receptor (CASR) wild-type (WT) compared to the pathogenic I554N mutation. The left side (CASR WT) depicts normal signaling: extracellular calcium (eCa2+) binds to the intact receptor, activating the PLC̠ pathway (PIP2 to IP3 and DAG), which triggers intracellular calcium release and the MAPK (p-ERK1/2) pathway to inhibit Parathyroid Hormone (PTH) secretion and renal tubular calcium reabsorption. The right side (CASR I554N) highlights four pathological consequences: (1) protein instability, (2) disrupted binding energy between CASR and eCa2+, (3) decreased intracellular calcium (iCa2+) response, and (4) attenuated MAPK signaling. These defects lead to clinical manifestations of Familial Hypocalciuric Hypercalcemia type 1 (FHH1), specifically inappropriate increased PTH secretion and increased renal tubular calcium reabsorption. A vertical label indicates that this dysfunctional state can be 'Rescued by Calcimimetics Treatment.' The diagram serves as an educational tool for understanding G-protein coupled receptor (GPCR) dysfunction and calcium homeostasis disorders.