
Immunity
Reading File
The query "Immunity" is broad. Let me clarify what you need before diving deep.
Asking for Preferences
What aspect of immunity are you interested in?
Searching sources...
Finding Sources
Finding Sources
Good results. Now let me read the core immunology content from the best sources in parallel.
Reading File
Reading File
Reading File
Good material found. Let me now get the core content sections on innate and adaptive immunity from Robbins Pathology and Janeway's.
Finding Sources
Finding Sources
Reading File
Reading File
Let me get the actual core content sections from Robbins Pathologic Basis of Disease (the most comprehensive pathology textbook) on innate and adaptive immunity.
Finding Sources
Finding Sources
Reading File
Reading File
Excellent content found. I have rich material from multiple authoritative textbooks. Let me fetch the key diagram image too.
Loading Image
Reading File
I now have comprehensive, authoritative content. Here is the full overview:
Immunity: Innate vs. Adaptive
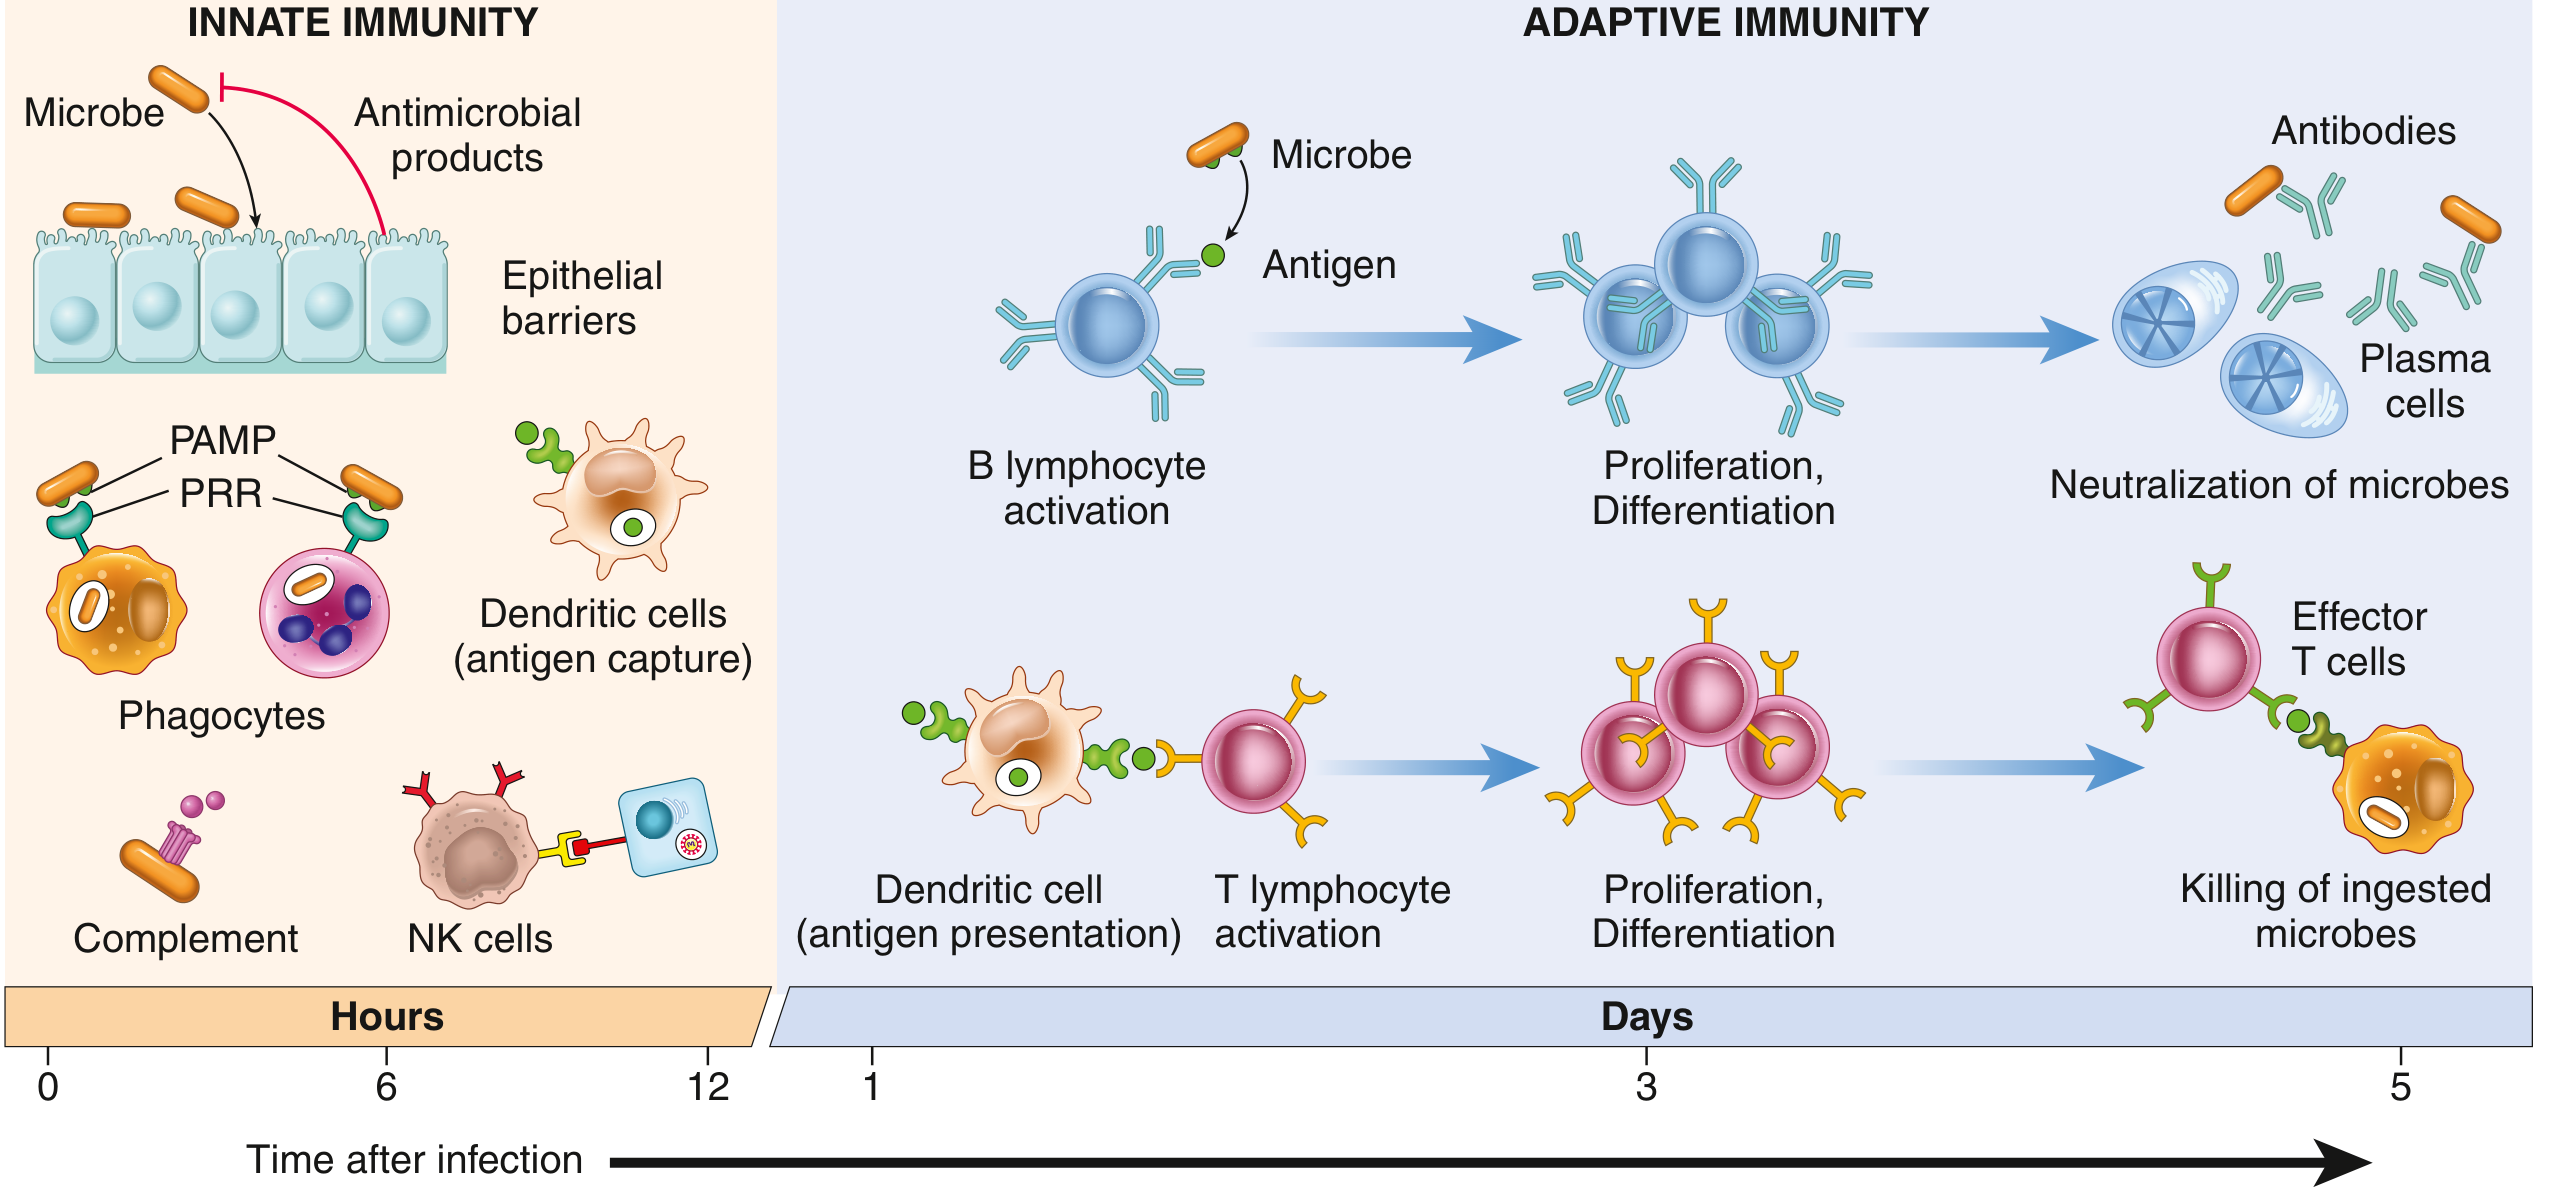
Fig. 5.1 - Principal components and kinetics of innate and adaptive immune responses (Robbins & Kumar Basic Pathology)
What Is Immunity?
The immune system exists to discriminate self from non-self and defend the body against microbial pathogens, toxins, and abnormal cells (e.g., tumors). It has two interconnected arms that operate on different timescales and use different strategies:
| Feature | Innate Immunity | Adaptive Immunity |
|---|---|---|
| Onset | Immediate (minutes to hours) | Delayed (days) |
| Specificity | Broad patterns (PAMPs, DAMPs) | Highly specific (single antigen) |
| Memory | None | Yes (long-lived memory cells) |
| Receptors | Germline-encoded (~100 receptors) | Somatically rearranged (10^7-10^9 clones) |
| Key cells | Neutrophils, macrophages, NK cells, DCs, ILCs | T lymphocytes, B lymphocytes |
| Humoral arm | Complement, defensins, acute-phase proteins | Antibodies (immunoglobulins) |
Innate Immunity
Innate immunity is always present and ready - it provides the first line of defense before adaptive responses can mobilize. - Robbins, Cotran & Kumar Pathologic Basis of Disease, p. 168
Components
1. Epithelial Barriers
The skin and mucosal surfaces of the GI and respiratory tracts act as mechanical barriers. Epithelial cells also produce antimicrobial molecules (e.g., defensins), and intraepithelial lymphocytes patrol these surfaces. - Robbins Pathologic Basis of Disease, p. 185
2. Phagocytic Cells
- Neutrophils: First to arrive at infection sites (recruited from blood within minutes to hours)
- Macrophages: Arise from blood monocytes (or tissue-resident precursors from yolk sac/fetal liver). Specialized resident macrophages include Kupffer cells (liver), microglia (brain), and alveolar macrophages (lung). They ingest and destroy pathogens.
- Both cell types sense microbes, engulf them via phagocytosis, and destroy them with reactive oxygen species, lysosomal enzymes, and other mechanisms.
3. Dendritic Cells (DCs)
Present in epithelia, lymphoid organs, and most tissues. DCs are sentinels: they capture protein antigens, sense microbes via pattern recognition receptors, produce cytokines (especially interferons), and present peptide antigens to T lymphocytes - bridging innate and adaptive immunity.
4. Natural Killer (NK) Cells
NK cells kill cells that have downregulated MHC I expression (a common viral and tumor evasion strategy). They also produce IFN-γ to activate macrophages. They are part of the innate lymphoid cell (ILC) family.
5. Innate Lymphoid Cells (ILCs)
Tissue-resident lymphocytes without T-cell receptors. Activated by cytokines rather than antigens. They are rapid sources of cytokines that help shape the subsequent adaptive response.
6. Plasma Proteins
- Complement system: A cascade of plasma proteins that opsonize microbes, recruit phagocytes, and directly lyse pathogens (via the membrane attack complex)
- Acute-phase proteins: C-reactive protein (CRP), mannose-binding lectin (MBL) - produced in the liver in response to inflammation
Pattern Recognition Receptors (PRRs)
The innate system does not recognize individual antigens. Instead, it uses ~100 receptors to detect a few thousand conserved molecular patterns: - Robbins & Kumar Basic Pathology, p. 132
- PAMPs (Pathogen-Associated Molecular Patterns): Conserved structures essential to microbial survival - LPS from gram-negative bacteria, peptidoglycan, flagellin, viral RNA/DNA
- DAMPs (Damage-Associated Molecular Patterns): Signals from injured/necrotic host cells (e.g., uric acid crystals, HMGB1, heat shock proteins)
Key PRR families:
- Toll-like receptors (TLRs): Plasma membrane TLRs recognize extracellular bacterial products (e.g., LPS); endosomal TLRs detect viral/bacterial nucleic acids after phagocytosis. TLR activation drives NF-κB - stimulating cytokines, interferons, and costimulatory molecules
- NOD-like receptors (NLRs): Cytosolic sensors; NLRP3 assembles the inflammasome, activating IL-1β and IL-18
- RIG-like receptors (RLRs): Detect viral RNA in the cytoplasm; trigger type I interferon production
- C-type lectin receptors: Recognize carbohydrates on fungal and bacterial surfaces
Reactions of Innate Immunity
Innate recognition produces: inflammation (via cytokines TNF, IL-1, IL-6, IL-12), antiviral defense (type I IFNs), and activation of DCs that initiate adaptive responses.
Adaptive Immunity
Adaptive (acquired) immunity is antigen-specific, depends on prior exposure, and generates immunological memory. It becomes progressively dominant over the innate response with time. - Goodman & Gilman's Pharmacological Basis of Therapeutics, p. 494
Two Arms of Adaptive Immunity
| Arm | Mediator | Targets | Mechanism |
|---|---|---|---|
| Humoral immunity | B lymphocytes → Antibodies | Extracellular microbes and toxins | Neutralization, opsonization, complement activation |
| Cell-mediated immunity | T lymphocytes | Intracellular microbes, cancer cells | Cytokine-driven macrophage activation (CD4+), direct cytotoxicity (CD8+) |
Key Cells
B Lymphocytes
- Mature in the bone marrow
- Express surface immunoglobulin as the B-cell receptor (BCR)
- When activated by antigen (+ T cell help), differentiate into plasma cells that secrete antibodies
- Also form memory B cells for rapid secondary responses
T Lymphocytes
- Mature in the thymus
- Express the T-cell receptor (TCR), which only recognizes peptide fragments presented by MHC molecules (unlike BCR, which binds whole antigens)
- Two main subsets:
- CD4+ helper T cells: Recognize antigen on MHC II (on APCs). Provide help to B cells and activate macrophages. Subsets include Th1 (activates macrophages via IFN-γ), Th2 (drives allergic responses via IL-4/5/13), Th17 (anti-fungal/bacterial defense via IL-17), and T-regulatory cells (suppress immune responses)
- CD8+ cytotoxic T lymphocytes (CTLs): Recognize antigen on MHC I (on all nucleated cells). Directly kill infected cells and tumor cells via perforin/granzyme mechanism
Antigen-Presenting Cells (APCs)
Dendritic cells, macrophages, and B cells. Process and present peptide antigens on MHC molecules to T cells. DCs are the most potent APCs for initiating naive T-cell responses.
MHC (Major Histocompatibility Complex)
- MHC I (HLA-A, B, C in humans): Expressed on all nucleated cells; presents endogenous (intracellular) peptides to CD8+ T cells
- MHC II (HLA-DR, DP, DQ): Expressed only on APCs; presents exogenous (phagocytosed) peptides to CD4+ T cells
Clonal Selection
Before antigen exposure, lymphocytes specific for many different antigens already exist in small numbers (~1 in 100,000 lymphocytes per antigen). When an antigen enters, it selectively activates the cells bearing the matching receptor - those cells then proliferate into a large clone of effector cells (clonal expansion). This is the basis of immunological specificity. - Robbins Pathologic Basis of Disease, p. 186
Phases of an Adaptive Response
- Antigen capture and presentation: DCs take up antigen, migrate to lymph nodes, present peptides to naive T cells
- Lymphocyte activation: Naive T and B cells recognize antigen + receive costimulatory signals → proliferate and differentiate
- Effector phase: Antibodies neutralize/opsonize microbes; effector T cells kill infected cells or activate macrophages
- Contraction: ~90% of effector cells die by apoptosis after infection is cleared
- Memory: Surviving memory T and B cells persist long-term, enabling faster and stronger responses to re-infection
How Innate and Adaptive Immunity Work Together
The two systems are deeply interdependent:
- Innate initiates, adaptive refines: Innate responses are active within hours; adaptive immunity dominates from day 3 onward
- DCs are the bridge: After sensing PAMPs/DAMPs, DCs upregulate MHC and costimulatory molecules (CD80/86) and migrate to lymph nodes to activate T cells - without this, adaptive responses fail
- Adaptive boosts innate: Antibodies and cytokines produced in adaptive responses opsonize microbes for phagocytosis and activate NK cells and macrophages
- Innate shapes the type of adaptive response: The cytokines produced during innate immunity (IL-12 drives Th1; IL-4 drives Th2; IL-6 + TGF-β drive Th17) determine the character of the adaptive response
Key Cytokines at a Glance
| Cytokine | Source | Main Function |
|---|---|---|
| IL-1, TNF, IL-6 | Macrophages, DCs | Pro-inflammatory; acute-phase response |
| IL-12 | Macrophages, DCs | Drives Th1 differentiation; activates NK cells |
| IFN-α/β (Type I) | DCs, infected cells | Antiviral defense; activates NK cells |
| IFN-γ (Type II) | Th1 cells, NK cells | Activates macrophages (killing intracellular pathogens) |
| IL-4, IL-5, IL-13 | Th2 cells | Drive B-cell class switching to IgE; allergic responses |
| IL-17 | Th17 cells | Recruit neutrophils; anti-fungal/extracellular bacterial defense |
| TGF-β, IL-10 | T-regulatory cells, macrophages | Suppress immune responses; prevent autoimmunity |
Sources: Robbins & Kumar Basic Pathology, p. 131-140 | Robbins, Cotran & Kumar Pathologic Basis of Disease, p. 168-193 | Goodman & Gilman's Pharmacological Basis of Therapeutics, p. 494 | Cellular and Molecular Immunology (Abbas et al.) | Janeway's Immunobiology 10e
Ventilation perfusion ration
Searching sources...
Finding Sources
Finding Sources
Excellent results from multiple authoritative sources. Now reading core content in parallel.
Reading File
Reading File
Reading File
Rich content retrieved. Now getting the V/Q mismatch section and the regional lung distribution diagram.
Reading File
Reading File
Finding Sources
I have all the key content. Let me fetch the most informative diagrams.
Loading Image
Loading Image
Reading File
I have all the content and diagrams needed for a complete, authoritative answer.
Ventilation-Perfusion Ratio (V/Q)
Definition
The ventilation-perfusion ratio (V/Q or V̇/Q̇) is the ratio of alveolar ventilation (V̇A, in L/min) to pulmonary blood flow (Q̇, in L/min). It quantifies how well the air supply to the alveoli matches the blood supply to the pulmonary capillaries. Perfect gas exchange requires close matching of the two. - Costanzo Physiology 7th Edition, p. 236
Normal V/Q = 0.8
This means alveolar ventilation is about 80% of cardiac output:
- Normal total alveolar ventilation ≈ 4 L/min
- Normal pulmonary blood flow (cardiac output) ≈ 5 L/min
- V/Q = 4/5 = 0.8
When V/Q is 0.8, PaO₂ = 100 mm Hg and PaCO₂ = 40 mm Hg (normal values). Any deviation causes impaired gas exchange. - Costanzo Physiology, p. 233
The Two Extremes: Dead Space and Shunt
The key to understanding V/Q is grasping the two physiological extremes:
| Condition | V/Q | Ventilation | Perfusion | Alveolar Gas | Effect |
|---|---|---|---|---|---|
| Dead space | = ∞ | Present | Absent | Equals inspired air (PO₂ 150, PCO₂ 0) | Wasted ventilation |
| Normal | = 0.8 | Present | Present | PO₂ 100, PCO₂ 40 | Ideal exchange |
| Shunt | = 0 | Absent | Present | Equals venous blood (PO₂ 40, PCO₂ 46) | Wasted perfusion |
- Dead space (V/Q = ∞): Ventilation with no blood flow. No gas exchange occurs. The alveolar air stays similar to inspired air. Classic example: pulmonary embolism. - Guyton & Hall Medical Physiology
- Shunt (V/Q = 0): Perfusion with no ventilation. Blood passes through without being oxygenated and mixes into systemic circulation as deoxygenated blood. Classic example: airway obstruction, right-to-left cardiac shunts. - Costanzo Physiology, p. 237
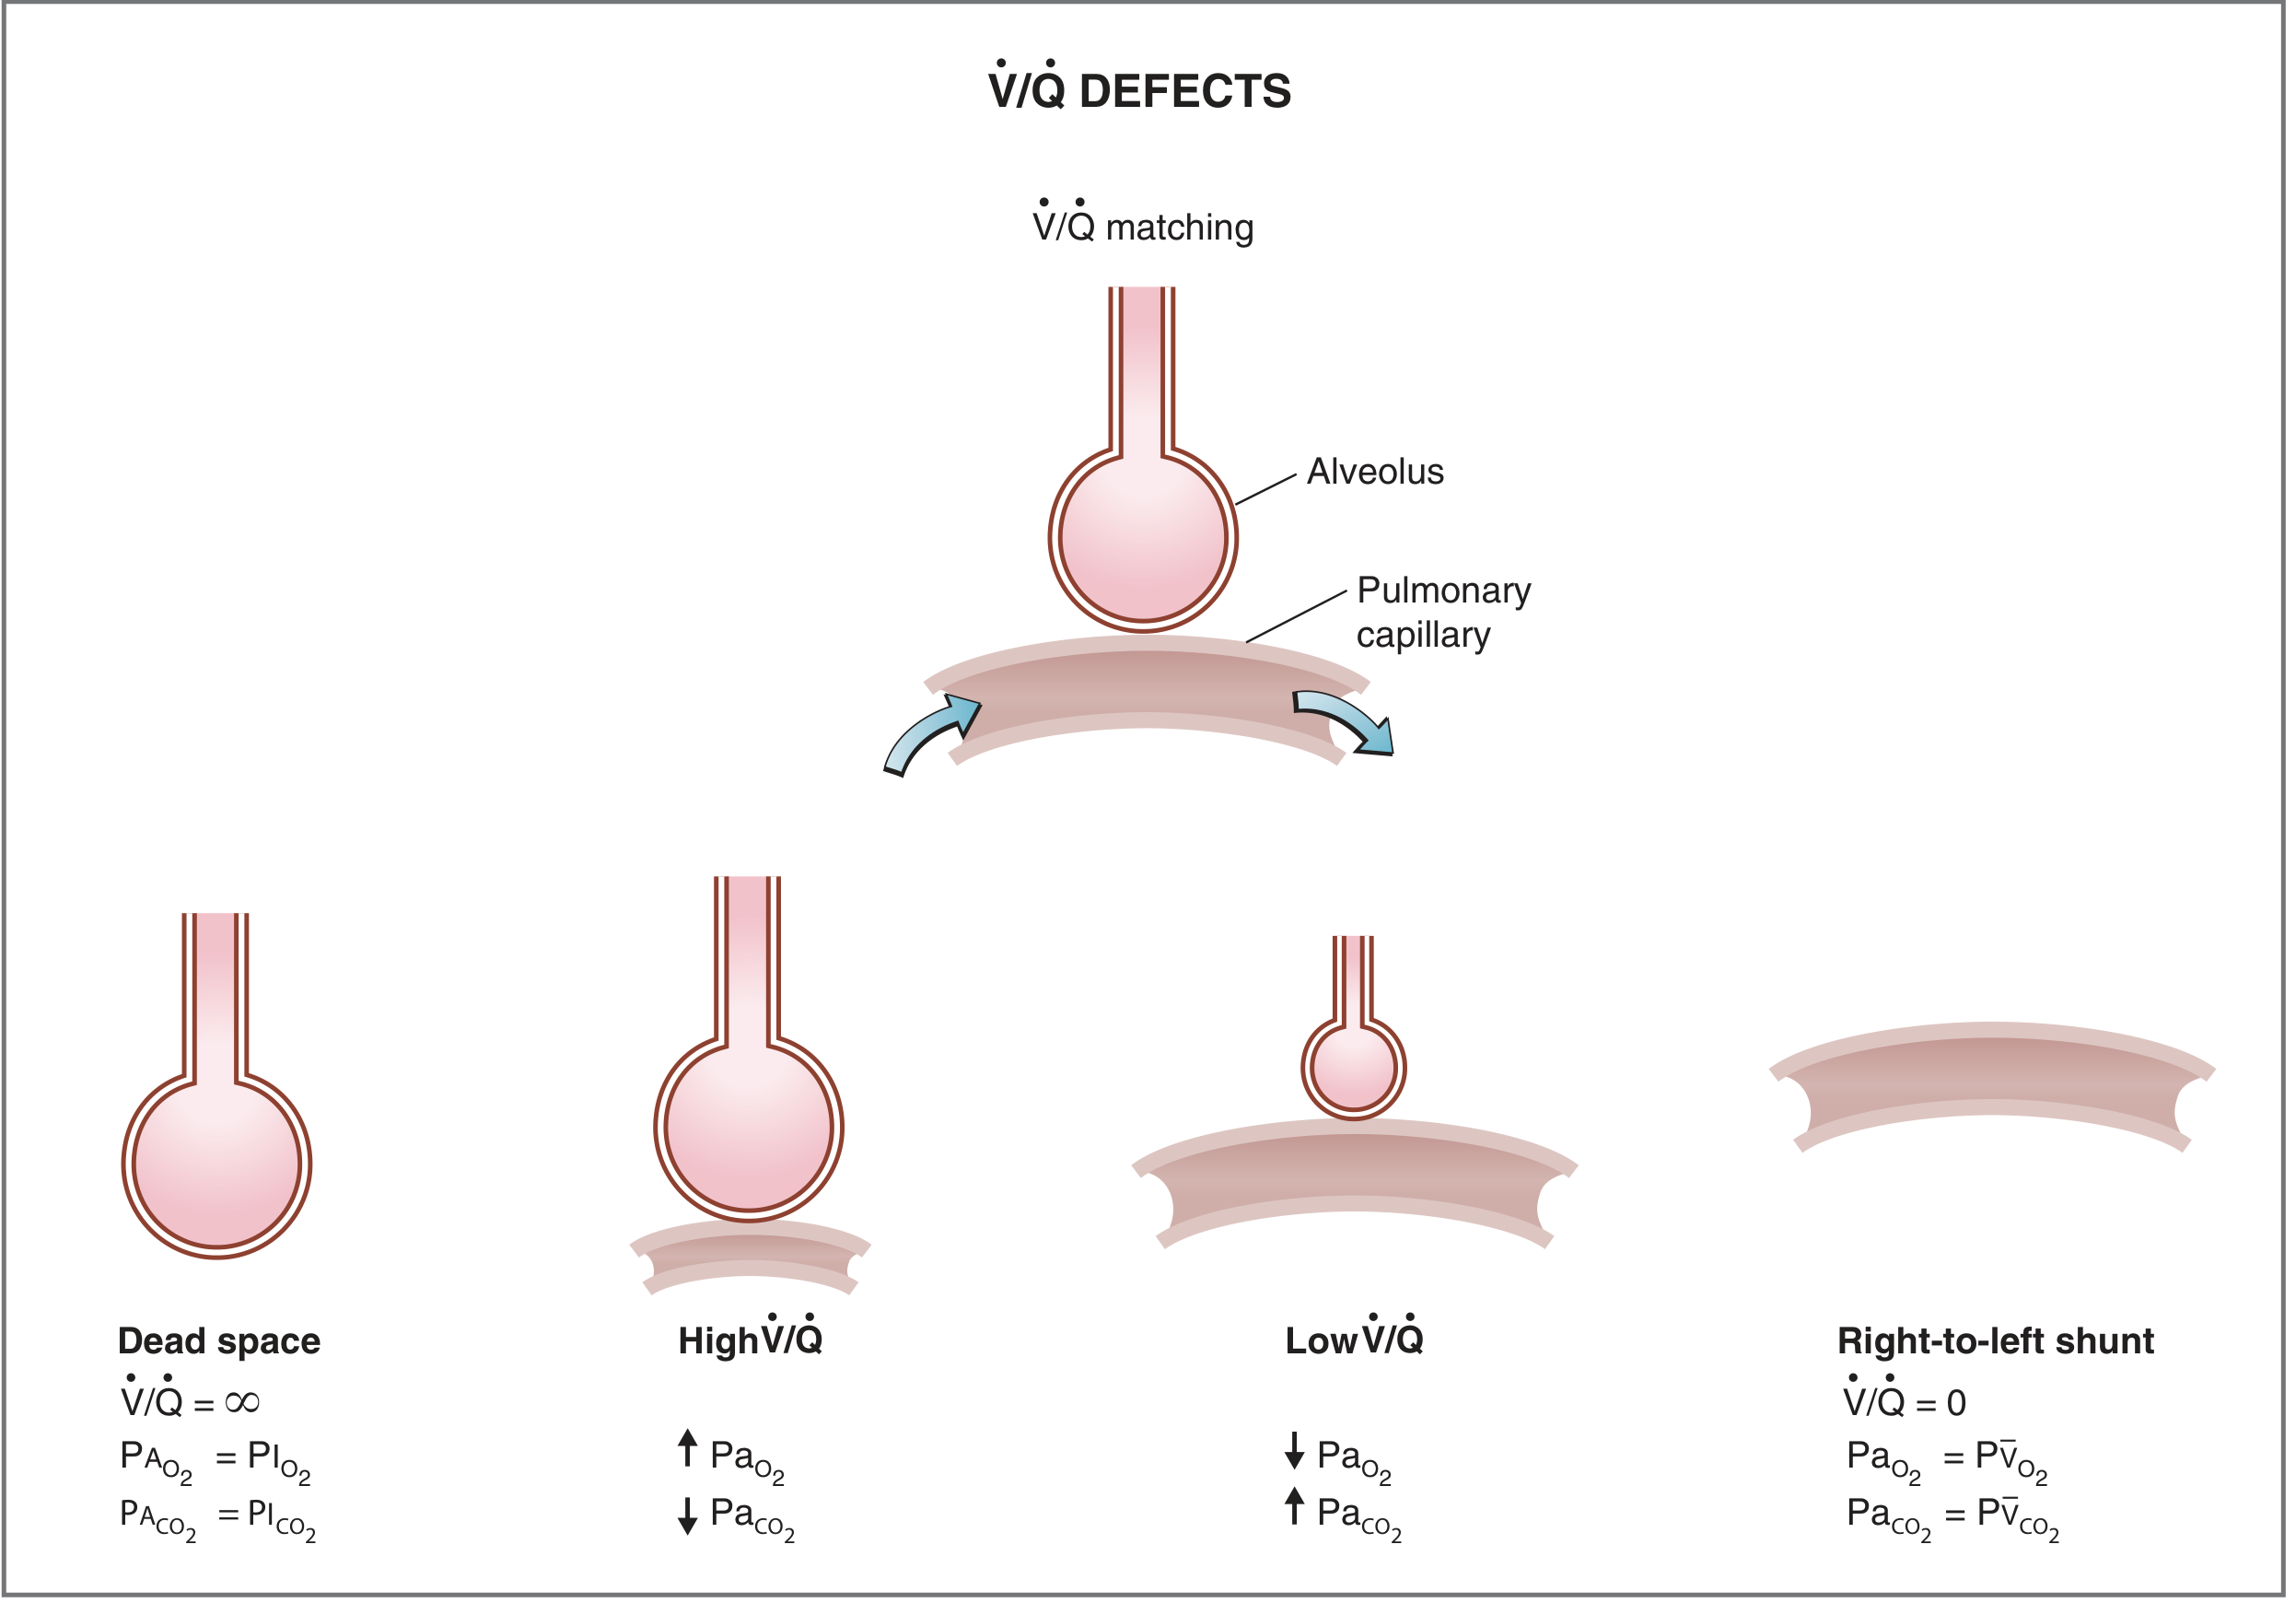
Fig. 5.30 - V/Q defects: from dead space (V/Q = ∞) to right-to-left shunt (V/Q = 0). (Costanzo Physiology 7th Ed.)
Regional Variation in the Upright Lung
V/Q is not uniform throughout the lung. In the upright position, gravity creates regional differences in both ventilation and perfusion - but the effect on perfusion is greater than on ventilation. This results in a gradient of V/Q from apex to base:
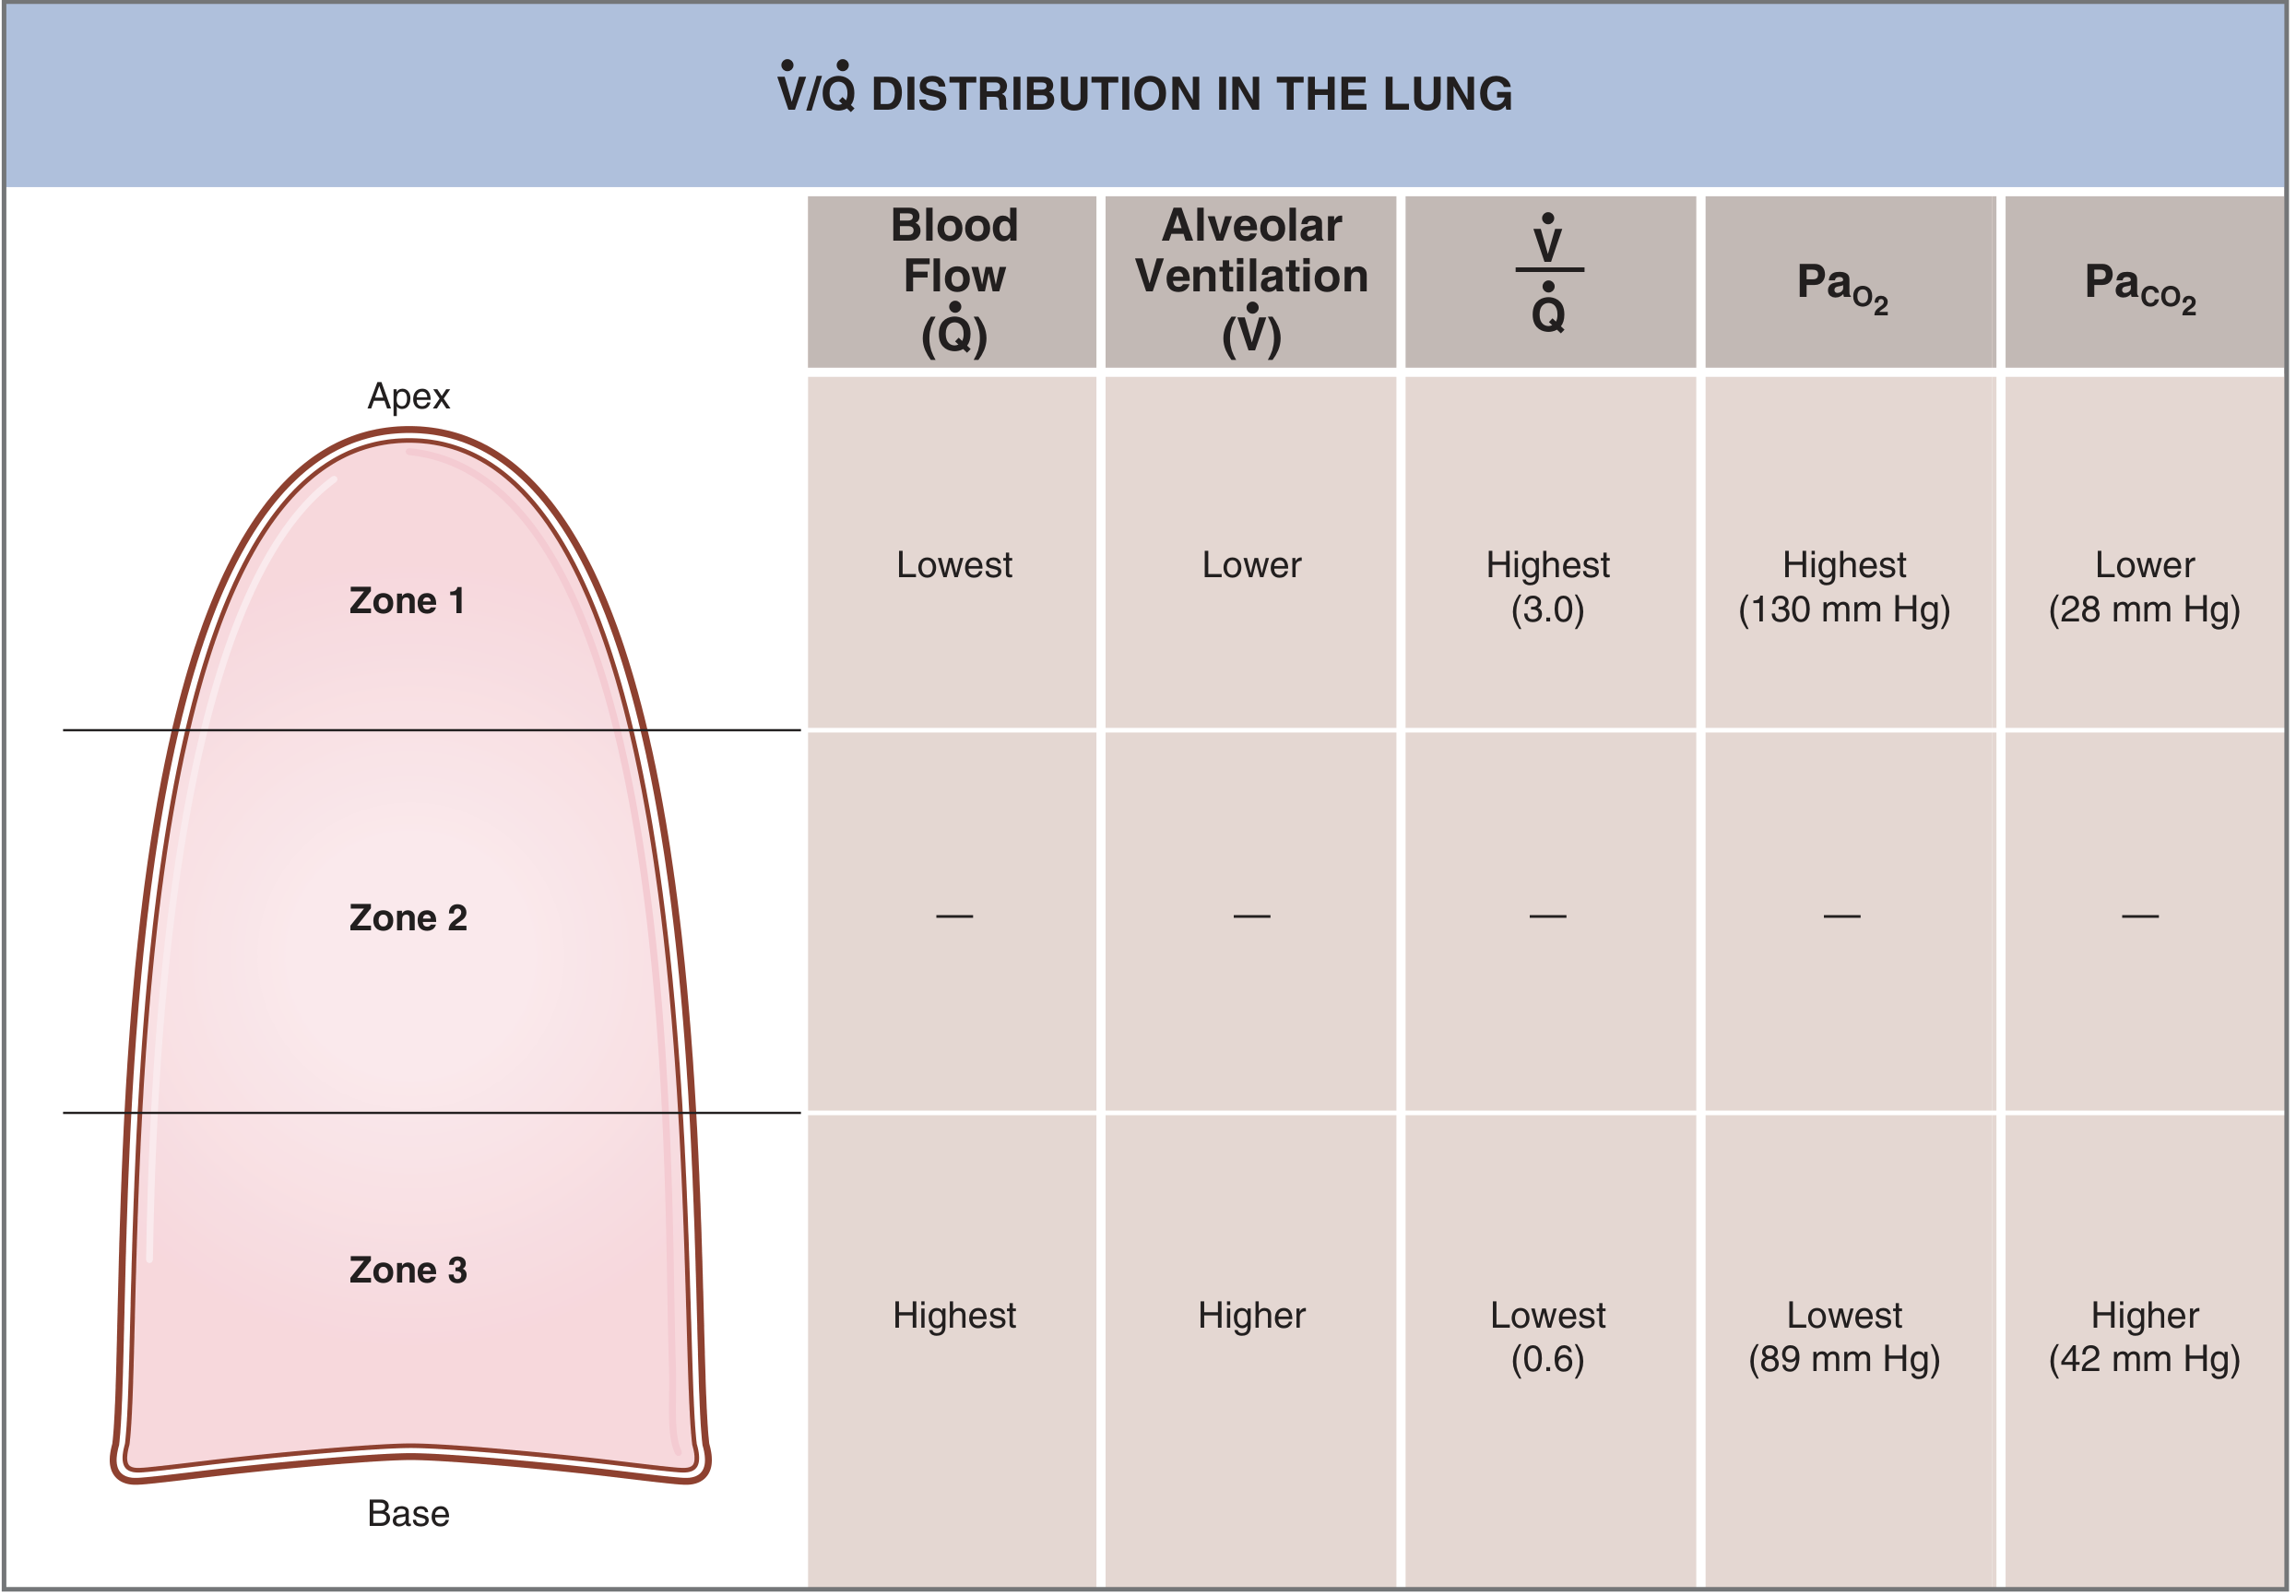
Fig. 5.28 - V/Q distribution in the three zones of the upright lung. (Costanzo Physiology 7th Ed.)
| Zone | Location | Blood Flow (Q̇) | Ventilation (V̇) | V/Q | PaO₂ | PaCO₂ |
|---|---|---|---|---|---|---|
| Zone 1 | Apex | Lowest | Lower | Highest (~3.0) | 130 mm Hg | 28 mm Hg |
| Zone 2 | Middle | Intermediate | Intermediate | ~0.8 (average) | ~100 mm Hg | ~40 mm Hg |
| Zone 3 | Base | Highest | Higher | Lowest (~0.6) | 89 mm Hg | 42 mm Hg |
Why? Blood flow is governed by gravity - the base of the lung has higher hydrostatic pressure so more blood pools there. Ventilation also increases toward the base (alveoli at the apex are already stretched at resting FRC and have less room to expand), but this increase is less steep than the change in perfusion. Therefore:
- Apex: relatively over-ventilated for its blood flow → high V/Q (behaves like dead space)
- Base: relatively over-perfused for its ventilation → low V/Q (behaves like shunt)
The average V/Q of 0.8 is a mixed value from all zones. - Costanzo Physiology, p. 234-235
Effect of V/Q on Gas Tensions
The alveolar PO₂ and PCO₂ in any lung unit are determined primarily by its V/Q ratio:
- ↑ V/Q → more ventilation relative to blood flow → alveolar air blown off → PO₂ rises, PCO₂ falls
- ↓ V/Q → less ventilation relative to blood flow → gas accumulates from metabolism → PO₂ falls, PCO₂ rises
Regional PO₂ differences across zones are much larger than PCO₂ differences, because:
- O₂ and CO₂ have very different dissociation curve shapes
- Hemoglobin is nearly fully saturated at normal PO₂, so even high-V/Q zones cannot over-compensate for low-V/Q zones on the O₂ side
- CO₂ dissociation is more linear, allowing high-ventilation areas to blow off extra CO₂ and partially compensate
This is why V/Q mismatch causes hypoxemia more readily than hypercapnia - the normal compensatory response (increased ventilation) can correct CO₂ but cannot fully restore O₂. - Murray & Nadel's Textbook of Respiratory Medicine, p. 603
Physiological Dead Space and Physiological Shunt
In a healthy upright lung, the apex (high V/Q) contributes physiological dead space and the base (low V/Q) contributes physiological shunt. These are normal:
- Physiological dead space ≈ anatomical dead space (airways, ~150 mL) + alveolar dead space (over-ventilated alveoli)
- Physiological shunt < 10% of cardiac output in health
During exercise, cardiac output increases, blood flow to the apex rises, and the V/Q gradient flattens - making gas exchange more efficient. - Guyton & Hall Medical Physiology
V/Q Mismatch in Disease
| Disease | Mechanism | Dominant Defect |
|---|---|---|
| Pulmonary embolism | Clot obstructs blood flow to ventilated alveoli | ↑ Dead space (high V/Q) |
| Pneumonia / pulmonary edema | Alveoli filled with fluid, no ventilation | ↓ Shunt (low V/Q or V/Q = 0) |
| COPD / emphysema | Bronchial obstruction (↓ ventilation) + alveolar wall destruction (↓ perfusion) | Both dead space AND shunt |
| Asthma | Bronchoconstriction → uneven ventilation | Low V/Q areas (shunt-like) |
| ARDS | Widespread alveolar flooding/collapse | True shunt (V/Q = 0) |
In COPD, some regions have severe physiological shunt and others have severe physiological dead space, sometimes reducing lung gas exchange effectiveness to as little as one-tenth of normal - the most prevalent cause of pulmonary disability today. - Guyton & Hall Medical Physiology, p. 520
Key Clinical Point: Response to Supplemental O₂
This distinguishes dead space/V/Q mismatch from true shunt:
- V/Q mismatch (low V/Q, not zero): hypoxemia responds to supplemental O₂, because some ventilation is present to deliver O₂ to the alveolus
- True shunt (V/Q = 0): hypoxemia does not respond to 100% O₂, because blood bypasses ventilated alveoli entirely and is never exposed to the inspired O₂
Sources: Guyton & Hall Textbook of Medical Physiology, p. 515-520 | Costanzo Physiology 7th Edition, p. 233-237 | Murray & Nadel's Textbook of Respiratory Medicine | Sabiston Textbook of Surgery
In short answer type
Ventilation-Perfusion Ratio (V/Q)
Definition: The ratio of alveolar ventilation (V̇A) to pulmonary blood flow (Q̇).
Normal value = 0.8 (ventilation ~4 L/min ÷ cardiac output ~5 L/min)
The Two Extremes
| Condition | V/Q | Cause | Example |
|---|---|---|---|
| Dead space | = ∞ | Ventilation, no perfusion | Pulmonary embolism |
| Shunt | = 0 | Perfusion, no ventilation | Pneumonia, airway obstruction |
Regional Distribution (Upright Lung)
- Apex (Zone 1): V/Q ~3.0 → high PO₂ (130 mmHg), low PCO₂ (28 mmHg) - behaves like dead space
- Base (Zone 3): V/Q ~0.6 → low PO₂ (89 mmHg), high PCO₂ (42 mmHg) - behaves like shunt
Reason: Gravity reduces perfusion more than ventilation at the apex.
Effect of Changing V/Q
- ↑ V/Q → PO₂ rises, PCO₂ falls
- ↓ V/Q → PO₂ falls, PCO₂ rises
Key Clinical Point
V/Q mismatch causes hypoxemia more than hypercapnia because:
- High-V/Q zones cannot compensate for O₂ loss (Hb already near-saturated)
- CO₂ is more readily blown off by hyperventilation
O₂ response test:
- Low V/Q mismatch → responds to supplemental O₂
- True shunt (V/Q = 0) → does NOT respond to 100% O₂
Clinical
The query "Clinical" in the context of V/Q ratio - let me get the clinical correlations from the textbooks.
Finding Sources
Finding Sources
Reading File
Reading File
Reading File
Loading Image
V/Q Ratio - Clinical Correlations
V/Q Mismatch is the Most Common Cause of Hypoxemia
Low V/Q (perfusion exceeding ventilation) is the single most common cause of hypoxemia in clinical practice. Almost every lung disease worsens V/Q matching. - Murray & Nadel's Textbook of Respiratory Medicine
Five Physiological Causes of Hypoxemia
| Cause | V/Q Pattern | A-a Gradient | Responds to O₂? |
|---|---|---|---|
| V/Q mismatch | Low V/Q | ↑ | Yes |
| Shunt | V/Q = 0 | ↑ | No (minimal) |
| Hypoventilation | Normal V/Q | Normal | Yes |
| Diffusion limitation | Variable | ↑ | Yes |
| Low inspired O₂ | Normal | Normal | Yes |
The first three explain the vast majority of hypoxemia in clinical/perioperative settings. Diffusion limitation is rarely clinically significant at sea level. - Miller's Anesthesia 10e
The Critical Clinical Test: Response to Supplemental O₂
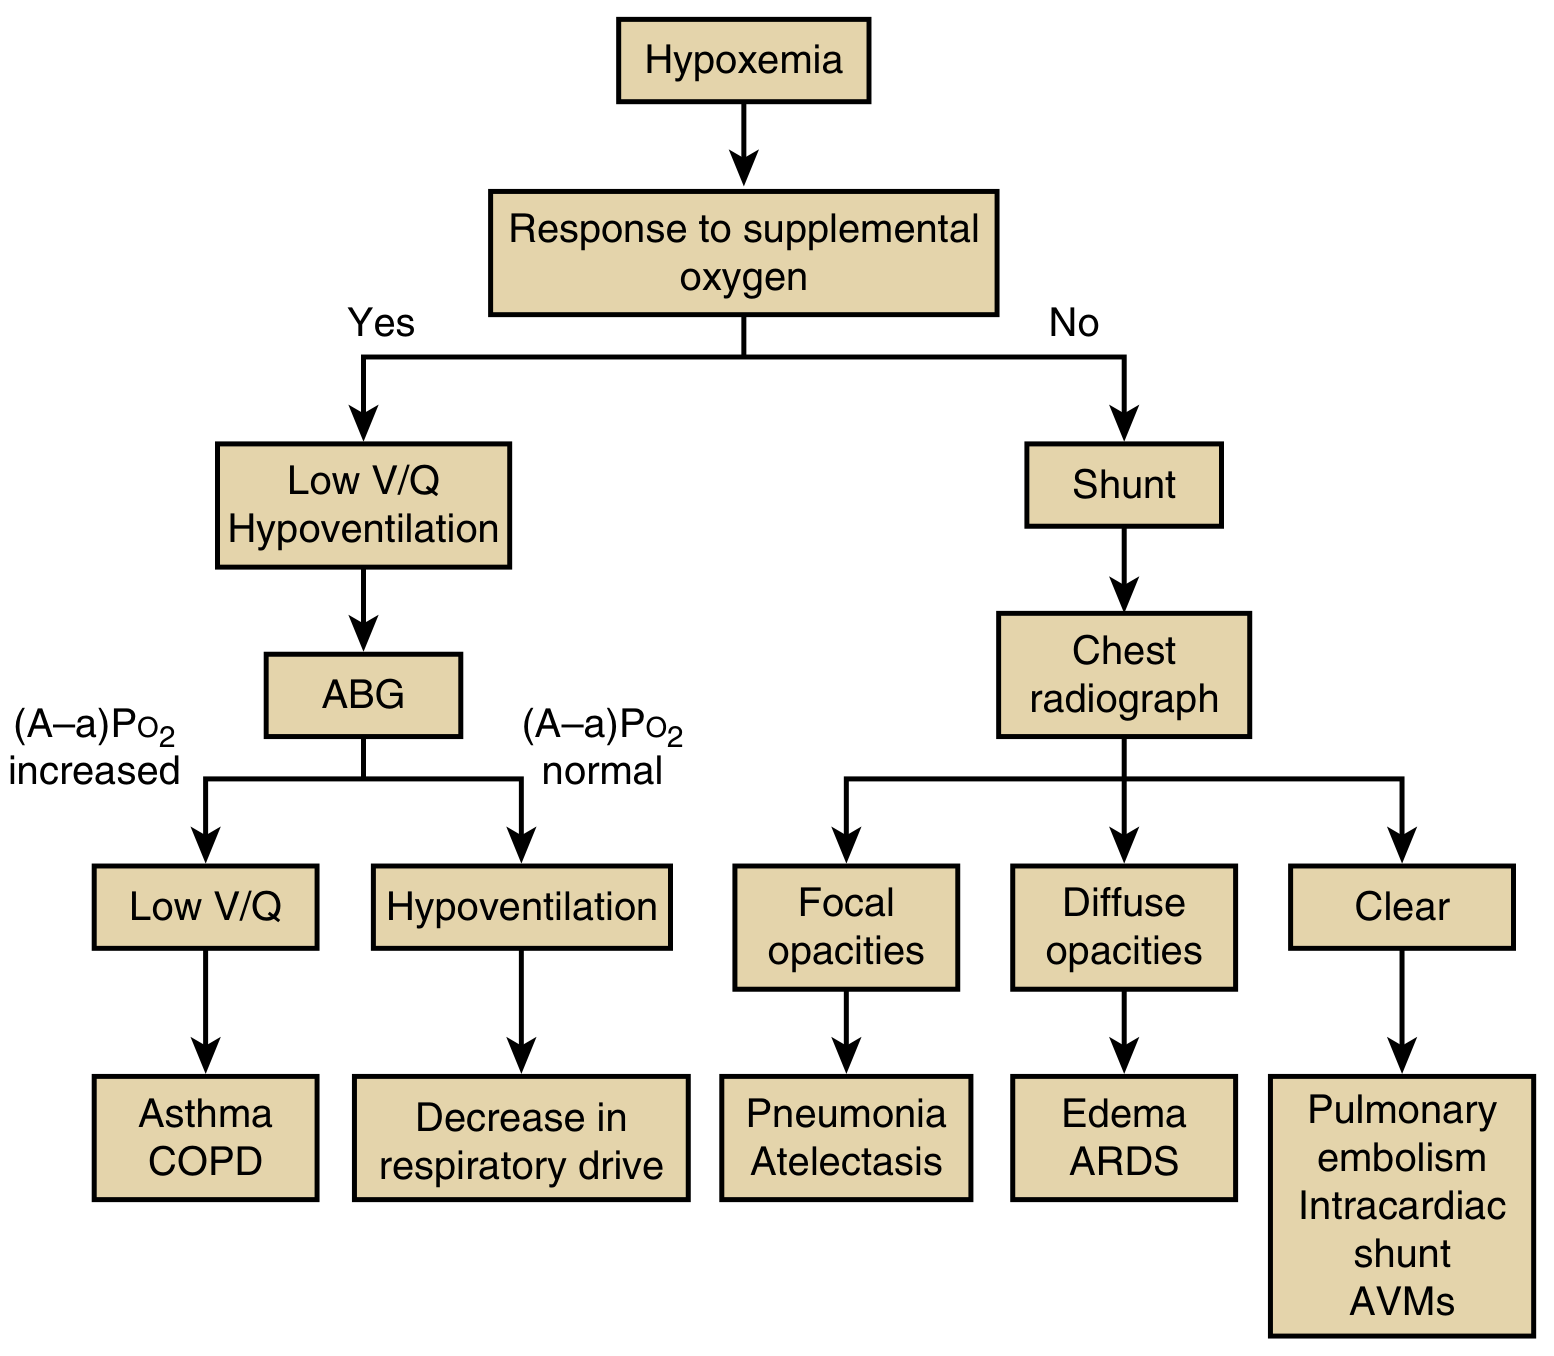
Fig. 44.3 - Algorithm for distinguishing major clinical causes of hypoxemia (Murray & Nadel's Respiratory Medicine)
Responds well to O₂ → Low V/Q or hypoventilation
- Check ABG: elevated A-a gradient = low V/Q (asthma, COPD); normal A-a gradient = hypoventilation
Does NOT respond to O₂ → Shunt
- Chest X-ray: focal opacities = pneumonia/atelectasis; diffuse opacities = pulmonary edema/ARDS; clear = pulmonary embolism, intracardiac shunt, AVMs
Disease-by-Disease Breakdown
1. COPD / Emphysema
- Bronchial obstruction → alveoli beyond obstruction unventilated → low V/Q approaching 0 (shunt)
- Alveolar wall destruction → ventilation with no blood flow → high V/Q (dead space)
- Both defects coexist - gas exchange can fall to 1/10 of normal
- Classic ABG: hypoxemia with hypercapnia (PaCO₂ ↑)
2. Asthma
- Bronchoconstriction creates regional low V/Q areas
- Hypoxemia responds to O₂ (some ventilation still present)
- With severe attack: PaCO₂ initially ↓ (hyperventilation), then ↑ (fatigue/obstruction) - a rising PaCO₂ in asthma = danger sign
3. Pulmonary Embolism (PE)
- Clot blocks perfusion → high V/Q / dead space in affected region
- Adjacent areas receive redirected blood flow → low V/Q in other regions
- Net effect: V/Q mismatch + increased dead space
- ABG: hypoxemia, hypocapnia (compensatory hyperventilation), elevated A-a gradient
- Does NOT cause shunt (unless massive PE raises right heart pressure and opens a patent foramen ovale)
4. Pneumonia / Lobar Consolidation
- Alveoli filled with fluid/pus → no ventilation but perfusion continues → true shunt (V/Q = 0)
- Hypoxemia poorly responsive to supplemental O₂
- Chest X-ray: focal consolidation
5. ARDS (Acute Respiratory Distress Syndrome)
- Widespread alveolar flooding + collapse → large true shunt
- Refractory hypoxemia despite high FiO₂ - hallmark of ARDS
- Managed with PEEP (recruits collapsed alveoli, converts shunt to low V/Q)
6. Obesity / Atelectasis
- Low lung volumes → compression of basal alveoli → low V/Q at bases
- Worsens supine (gravity-dependent collapse)
- Common cause of post-operative hypoxemia
7. General Anesthesia
- V/Q mismatch worsens due to: reduced FRC, diaphragm shift, atelectasis formation
- Increases physiological shunt from <5% to ~10-15% of cardiac output
The A-a Gradient: Key Bedside Tool
A-a PO₂ gradient = PAO₂ - PaO₂
Normal ≈ 5-15 mm Hg (increases with age: ~2.5 × age/4)
| Finding | Interpretation |
|---|---|
| Hypoxemia + normal A-a gradient | Hypoventilation (alveoli are fine, not enough air moved) |
| Hypoxemia + elevated A-a gradient | V/Q mismatch, shunt, or diffusion limitation |
PEEP and V/Q in Mechanical Ventilation
Positive End-Expiratory Pressure (PEEP) is the primary tool to treat shunt physiology:
- Recruits collapsed/flooded alveoli → restores ventilation to perfused units
- Converts V/Q = 0 (shunt) to low V/Q → now responds to supplemental O₂
- Over-distension with high PEEP can create high V/Q dead space in other regions
Sources: Murray & Nadel's Textbook of Respiratory Medicine | Miller's Anesthesia 10e | Goldman-Cecil Medicine | Guyton & Hall Medical Physiology
What is abg
Searching sources...
Finding Sources
Finding Sources
Finding Sources
Reading File
Reading File
Reading File
Reading File
Finding Sources
I have excellent material. Here is a complete, clear answer:
Arterial Blood Gas (ABG)
What Is an ABG?
An Arterial Blood Gas (ABG) is a blood test taken from an artery (usually the radial artery at the wrist) that directly measures the partial pressures of oxygen and carbon dioxide in the blood, along with pH. It is the gold standard for assessing oxygenation, ventilation, and acid-base status. - Murray & Nadel's Textbook of Respiratory Medicine
Parameters Measured
| Parameter | What It Measures | Normal Value |
|---|---|---|
| pH | Acidity/alkalinity of blood | 7.35 - 7.45 |
| PaO₂ | Partial pressure of oxygen in arterial blood | 80 - 100 mm Hg |
| PaCO₂ | Partial pressure of carbon dioxide | 35 - 45 mm Hg |
| HCO₃⁻ | Bicarbonate (calculated) | 22 - 26 mEq/L |
| SaO₂ | Oxygen saturation of hemoglobin (calculated) | 95 - 100% |
| Base excess (BE) | Metabolic component; how much acid/base deviation | -2 to +2 mEq/L |
Other values often included: lactate, hemoglobin, electrolytes (Na⁺, K⁺, Cl⁻). - Tintinalli's Emergency Medicine
Why Arterial (Not Venous)?
Arterial blood reflects the gas content after it has passed through the lungs - before any tissue gas exchange occurs. This gives a true picture of how well the lungs are functioning. Venous blood has already given up O₂ and taken on CO₂ from tissues, so it cannot assess pulmonary oxygenation. - Tintinalli's Emergency Medicine
How to Interpret an ABG - Step-by-Step
Step 1: Look at pH
- < 7.35 = Acidosis
- > 7.45 = Alkalosis
Step 2: Identify the Primary Disorder
| pH | PaCO₂ | HCO₃⁻ | Disorder |
|---|---|---|---|
| ↓ | ↑ | Normal | Respiratory Acidosis |
| ↑ | ↓ | Normal | Respiratory Alkalosis |
| ↓ | Normal | ↓ | Metabolic Acidosis |
| ↑ | Normal | ↑ | Metabolic Alkalosis |
Rule: PaCO₂ moves same direction as pH change in metabolic disorders; opposite in respiratory disorders.
Step 3: Check for Compensation
The body always tries to bring pH back to normal:
| Primary Disorder | Compensation | Timing |
|---|---|---|
| Respiratory acidosis | Kidneys retain HCO₃⁻ | 2-5 days (chronic) |
| Respiratory alkalosis | Kidneys excrete HCO₃⁻ | 2-5 days (chronic) |
| Metabolic acidosis | Lungs hyperventilate → ↓ PaCO₂ | Minutes to hours |
| Metabolic alkalosis | Lungs hypoventilate → ↑ PaCO₂ | Hours (max PaCO₂ ~55 mm Hg) |
Key rule: Compensation brings pH toward normal but never fully corrects it (pH does not overshoot 7.40).
Step 4: Assess Oxygenation
- PaO₂ < 80 mm Hg = Hypoxemia
- Calculate A-a gradient = PAO₂ - PaO₂ (normal ~5-15 mm Hg)
- Normal A-a gradient with hypoxemia → hypoventilation
- Elevated A-a gradient → V/Q mismatch, shunt, or diffusion limitation
Common Clinical ABG Patterns
| Clinical Situation | pH | PaCO₂ | HCO₃⁻ | PaO₂ |
|---|---|---|---|---|
| COPD exacerbation | ↓ | ↑↑ | ↑ (compensated) | ↓ |
| Asthma (severe) | ↓ | ↑ (late/dangerous sign) | Normal/↑ | ↓ |
| Pulmonary embolism | ↑ | ↓ | ↓ | ↓ |
| Pneumonia/ARDS | ↓ | ↓ (early) | Normal | ↓↓ |
| DKA | ↓ | ↓ (Kussmaul breathing) | ↓↓ | Normal |
| Anxiety/hyperventilation | ↑ | ↓ | ↓ | Normal/↑ |
Technique
- Sample drawn from radial artery (preferred), brachial, or femoral
- Collected anaerobically in heparin-coated syringe (air bubbles falsely ↑ PO₂, ↓ PCO₂)
- Analyzed immediately or placed on ice (delay causes ↑ PCO₂, ↓ PO₂, ↓ pH due to ongoing cellular metabolism) - Fishman's Pulmonary Diseases, p. 1200
ABG vs. Pulse Oximetry
| ABG | Pulse Oximetry | |
|---|---|---|
| Measures | PaO₂, PaCO₂, pH, HCO₃⁻ | SpO₂ only |
| Detects hypoventilation | Yes (via PaCO₂) | No (especially on supplemental O₂) |
| Detects CO poisoning | Yes (carboxyhemoglobin) | No (falsely normal) |
| Invasive | Yes | No |
Critical point: Pulse oximetry cannot detect hypoventilation in a patient on supplemental O₂ - SpO₂ stays normal even as PaCO₂ rises dangerously. ABG is essential in this scenario. - Murray & Nadel's Respiratory Medicine
Sources: Fishman's Pulmonary Diseases & Disorders | Tintinalli's Emergency Medicine | Murray & Nadel's Textbook of Respiratory Medicine | Rosen's Emergency Medicine
Cystometrogram
Searching sources...
Finding Sources
Finding Sources
Reading File
Reading File
Reading File
Loading Image
Reading File
Reading File
I have comprehensive content. Here is the full answer:
Cystometrogram (CMG)
Definition
A cystometrogram (CMG), or cystometry, is the graphical record of the pressure-volume relationship of the bladder during filling. It is the core component of urodynamic studies (UDS) and evaluates bladder sensation, compliance, capacity, and detrusor function. - Smith & Tanagho's General Urology, 19th Ed.
Key Pressures Measured
| Pressure | Symbol | How Measured |
|---|---|---|
| Intravesical pressure | Pves | Urethral or suprapubic catheter in bladder |
| Abdominal pressure | Pabd | Rectal (or vaginal) balloon catheter |
| Detrusor pressure | Pdet | Calculated: Pdet = Pves - Pabd |
Pdet is the true pressure generated by the detrusor muscle alone, corrected for any rises caused by coughing, straining, or movement. - Campbell-Walsh-Wein Urology
Normal Cystometrogram Curve
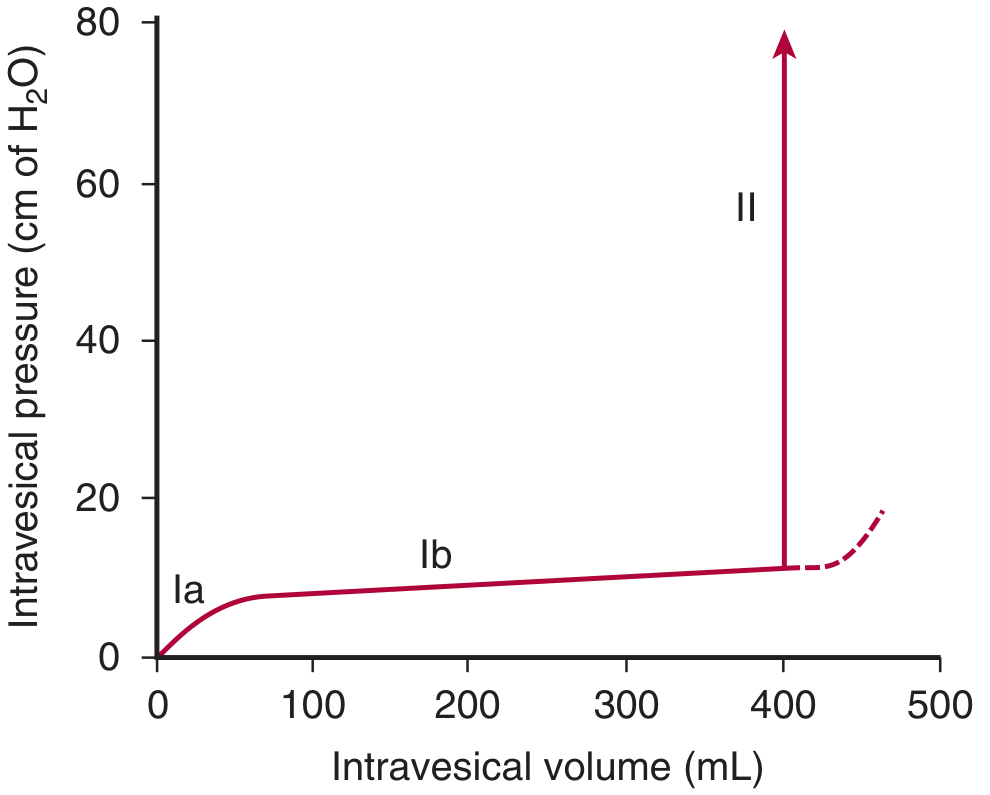
Normal cystometrogram. Ia = initial slight rise; Ib = long flat segment; II = sharp rise at micturition. (Ganong's Review of Medical Physiology)
The curve has three segments:
| Segment | Description | Explanation |
|---|---|---|
| Ia | Small initial rise in pressure | First increments of volume cause slight stretch |
| Ib | Long, nearly flat segment (the accommodation phase) | Bladder wall viscoelasticity + Law of Laplace (tension ↑ but radius ↑ too, so pressure stays low) |
| II | Sudden sharp rise | Micturition reflex triggered; detrusor contraction |
Normal sensations during filling:
- First sensation: ~150 mL
- First desire to void: ~75% of capacity
- Strong desire / maximum cystometric capacity: ~400-500 mL
What Is Assessed During CMG
1. Bladder Sensation
| Finding | Significance |
|---|---|
| Normal | Urge felt at expected volumes |
| Increased / early urgency | Overactive bladder, cystitis, bladder pain syndrome |
| Reduced / absent | Neurogenic bladder (diabetic neuropathy, spinal cord injury) |
2. Detrusor Overactivity (DO)
- Involuntary detrusor contractions during filling phase = detrusor overactivity
- Should NOT be present during normal filling
- If neurological cause: neurogenic detrusor overactivity (spinal cord injury, MS)
- If no cause found: idiopathic detrusor overactivity
- Associated with urgency, urge incontinence
- Note: DO can be absent in up to 50% of symptomatic patients
3. Compliance
Compliance = ΔV / ΔPdet (expressed in mL/cm H₂O)
- Normal compliance: Bladder fills to large volumes with minimal pressure rise (bladder is "accommodating")
- Low compliance (stiff bladder): Pressure rises steeply with small volumes
- Causes: radiation cystitis, chronic outlet obstruction, neurogenic bladder, fibrosis
- Danger: high intravesical pressures damage upper urinary tract (hydronephrosis, renal failure)
- High compliance: Seen in atonic/areflexic bladder (may fill to very large volumes)
4. Bladder Capacity
- Normal maximum cystometric capacity: 300-600 mL
- Reduced capacity: Overactive bladder, radiation cystitis, interstitial cystitis, TB bladder
- Increased capacity: Underactive/areflexic detrusor, chronic obstruction
Abnormal CMG Patterns
| Pattern | Finding on CMG | Clinical Cause |
|---|---|---|
| Detrusor overactivity | Involuntary Pdet rises during filling | OAB, neurogenic bladder (SCI, MS) |
| Low compliance | Steep Pdet rise with filling | Radiation, fibrosis, neurogenic |
| Areflexic / acontractile bladder | No contraction at all; large capacity | Lower motor neuron lesion, DM neuropathy |
| Uninhibited neurogenic bladder | Early, uninhibited contractions | Upper motor neuron lesion (stroke, MS) |
| Stress incontinence | Leakage with ↑ Pabd (cough) but no Pdet rise | Urethral sphincter weakness |
Technique / How It Is Done
- Bladder is emptied first via urethral catheter
- A filling catheter (6-8 Fr) is inserted into the bladder; a second catheter with balloon is placed per rectum for Pabd
- Bladder is filled with saline or contrast at standard rate: 30-100 mL/min in adults
- Patient reports sensations throughout (first sensation, first desire, strong desire, urgency)
- Patient is asked to cough periodically - confirms catheter placement (pressure spike seen on both Pves and Pabd simultaneously, with no rise in Pdet)
- Filling continues until maximum cystometric capacity or until the patient voids/leaks
- After filling: pressure-flow study of voiding phase follows
CMG in Context: Full Urodynamic Study
CMG is part of the complete urodynamic study which also includes:
- Uroflowmetry (flow rate vs. time)
- Post-void residual (PVR)
- Electromyography (EMG) of pelvic floor/external sphincter
- Urethral pressure profile (UPP)
- Pressure-flow studies (during voiding)
- Video urodynamics (VUD) - adds fluoroscopy for anatomic correlation
Clinical Indications for Cystometry
- Unexplained incontinence before surgery
- Neurogenic bladder (spinal cord injury, MS, DM, Parkinson's)
- Refractory overactive bladder
- Recurrent UTIs (assess residual/compliance)
- Prior to anti-incontinence surgery
- Bladder dysfunction in children (congenital anomalies, myelomeningocele)
Sources: Smith & Tanagho's General Urology 19th Ed. | Campbell-Walsh-Wein Urology | Ganong's Review of Medical Physiology 26th Ed. | Bradley & Daroff's Neurology in Clinical Practice
Cellular immunity in flowchart
Finding Sources
Finding Sources
Reading File
Finding Sources
Reading File
Finding Sources
Reading File
Finding Sources
I now have all the content needed. Here is cellular immunity as a detailed flowchart:
Cellular Immunity - Flowchart
ANTIGEN ENTERS BODY
(intracellular pathogen, virus, tumor cell, transplant)
         │
         ▼
ANTIGEN PRESENTING CELLS (APCs)
(Dendritic Cells — most potent; also Macrophages, B cells)
         │
    ┌────┴────┐
    │         │
    ▼         ▼
Exogenous    Endogenous
antigen      antigen
(phagocytosed)(made inside cell)
    │         │
    ▼         ▼
Presented on  Presented on
MHC CLASS II  MHC CLASS I
(on APCs)     (on ALL nucleated cells)
    │         │
    ▼         ▼
Recognized by  Recognized by
CD4+ T cell    CD8+ T cell
(TCR + CD4)    (TCR + CD8)
SIGNAL 1 + SIGNAL 2 Required for T Cell Activation
         NAIVE T CELL
              │
    ┌─────────┴──────────┐
    │ Signal 1            │ Signal 2
    │ TCR binds           │ Costimulation
    │ peptide-MHC         │ CD28 (T cell)
    │                     │   +
    │                     │ CD80/86 (B7)
    │                     │ on APC
    └─────────┬───────────┘
              │
              + Signal 3 (Cytokines from APC, e.g. IL-1, IL-2, IL-12)
              │
              ▼
       T CELL ACTIVATED
     (proliferates via IL-2)
              │
    ┌─────────┴────────────┐
    ▼                      ▼
CD4+ T Cell            CD8+ T Cell
(Helper)               (Cytotoxic)
CD4+ T Cell Branch — Helper T Cells
ACTIVATED CD4+ NAIVE T CELL
              │
    ┌─────────┴──────────────────────┐
    │ Cytokine milieu determines fate │
    └─────────┬──────────────────────┘
              │
    ┌─────────┼───────────┬─────────────┐
    ▼         ▼           ▼             ▼
   Th1       Th2         Th17          T-reg
(IL-12,    (IL-4,      (IL-6+        (TGF-β,
 IFN-γ)    IL-2)       TGF-β)         IL-2)
    │         │           │             │
    ▼         ▼           ▼             ▼
Secretes  Secretes    Secretes      Secretes
IFN-γ,    IL-4,5,10, IL-17,21,22   IL-10,
TNF-α     IL-13                    TGF-β
    │         │           │             │
    ▼         ▼           ▼             ▼
Activates Promotes    Recruits      Suppresses
Macrophages B cells    Neutrophils   immune response
→ kills    → IgE,IgG  → antifungal  → prevents
intracell   → allergy  /extracell    autoimmunity
microbes    response   bacteria
CD8+ T Cell Branch — Cytotoxic T Lymphocytes (CTLs)
ACTIVATED CD8+ NAIVE T CELL
         │
         + Help from CD4+ Th1 cells (IL-2, CD40L)
         │
         ▼
  CLONAL EXPANSION
  (proliferation)
         │
         ▼
  EFFECTOR CTL (CD8+)
         │
         ▼
  Migrates to site of infection/tumor
         │
         ▼
  Recognizes peptide on MHC CLASS I
  of infected/tumor cell
         │
    ┌────┴────────────┐
    ▼                 ▼
PERFORIN/         FAS PATHWAY
GRANZYME          (FasL on CTL
PATHWAY           binds Fas on
    │              target cell)
    ▼                 │
Perforin pores        ▼
in target        Fas → Caspase
cell membrane    activation
    +                 │
Granzymes enter       ▼
target cell      APOPTOSIS of
    │            target cell
    ▼
Caspase cascade
→ APOPTOSIS
(target cell dies)
    │
    ▼
CTL SURVIVES → kills multiple targets
Final Outcomes of Both Pathways
         BOTH ARMS LEAD TO:
                │
    ┌───────────┴────────────┐
    ▼                        ▼
ELIMINATION OF          MEMORY T CELLS
PATHOGEN/TUMOR          (long-lived)
                              │
                         ┌────┴─────┐
                         ▼          ▼
                    Memory CD4+  Memory CD8+
                    T cells      T cells
                         │          │
                         ▼          ▼
                    Rapid, potent response
                    on re-exposure to same antigen
                    (faster, more intense = secondary response)
Summary Table
| Feature | CD4+ (Helper) | CD8+ (Cytotoxic) |
|---|---|---|
| MHC restriction | Class II | Class I |
| APCs involved | DCs, Macrophages, B cells | All nucleated cells |
| Key cytokines received | IL-12, IL-4, IL-6 | IL-2 (from CD4+ Th) |
| Key cytokines secreted | IFN-γ, IL-2, IL-4, IL-17 | IFN-γ, TNF |
| Killing mechanism | Cytokine activation of macrophages | Perforin/granzyme, FasL |
| Main targets | Extracellular pathogens (via macrophages), B cell help | Intracellular pathogens, tumor cells, transplants |
| Contraction | ~90% apoptose after antigen cleared | ~90% apoptose after antigen cleared |
| Memory | Memory CD4+ T cells | Memory CD8+ T cells |
Sources: Cellular and Molecular Immunology (Abbas et al.) | Sabiston Textbook of Surgery | Roitt's Essential Immunology | Cellular and Molecular Immunology Ch. 9-11
According to guyton
Searching sources...
Finding Sources
Finding Sources
Finding Sources
Finding Sources
Reading File
Finding Sources
Reading File
Loading Image
Reading File
Loading Image
Here is cellular immunity as a flowchart, strictly according to Guyton and Hall Textbook of Medical Physiology:
Cellular Immunity — According to Guyton & Hall
Key Diagram (Fig. 35.8 - Guyton)
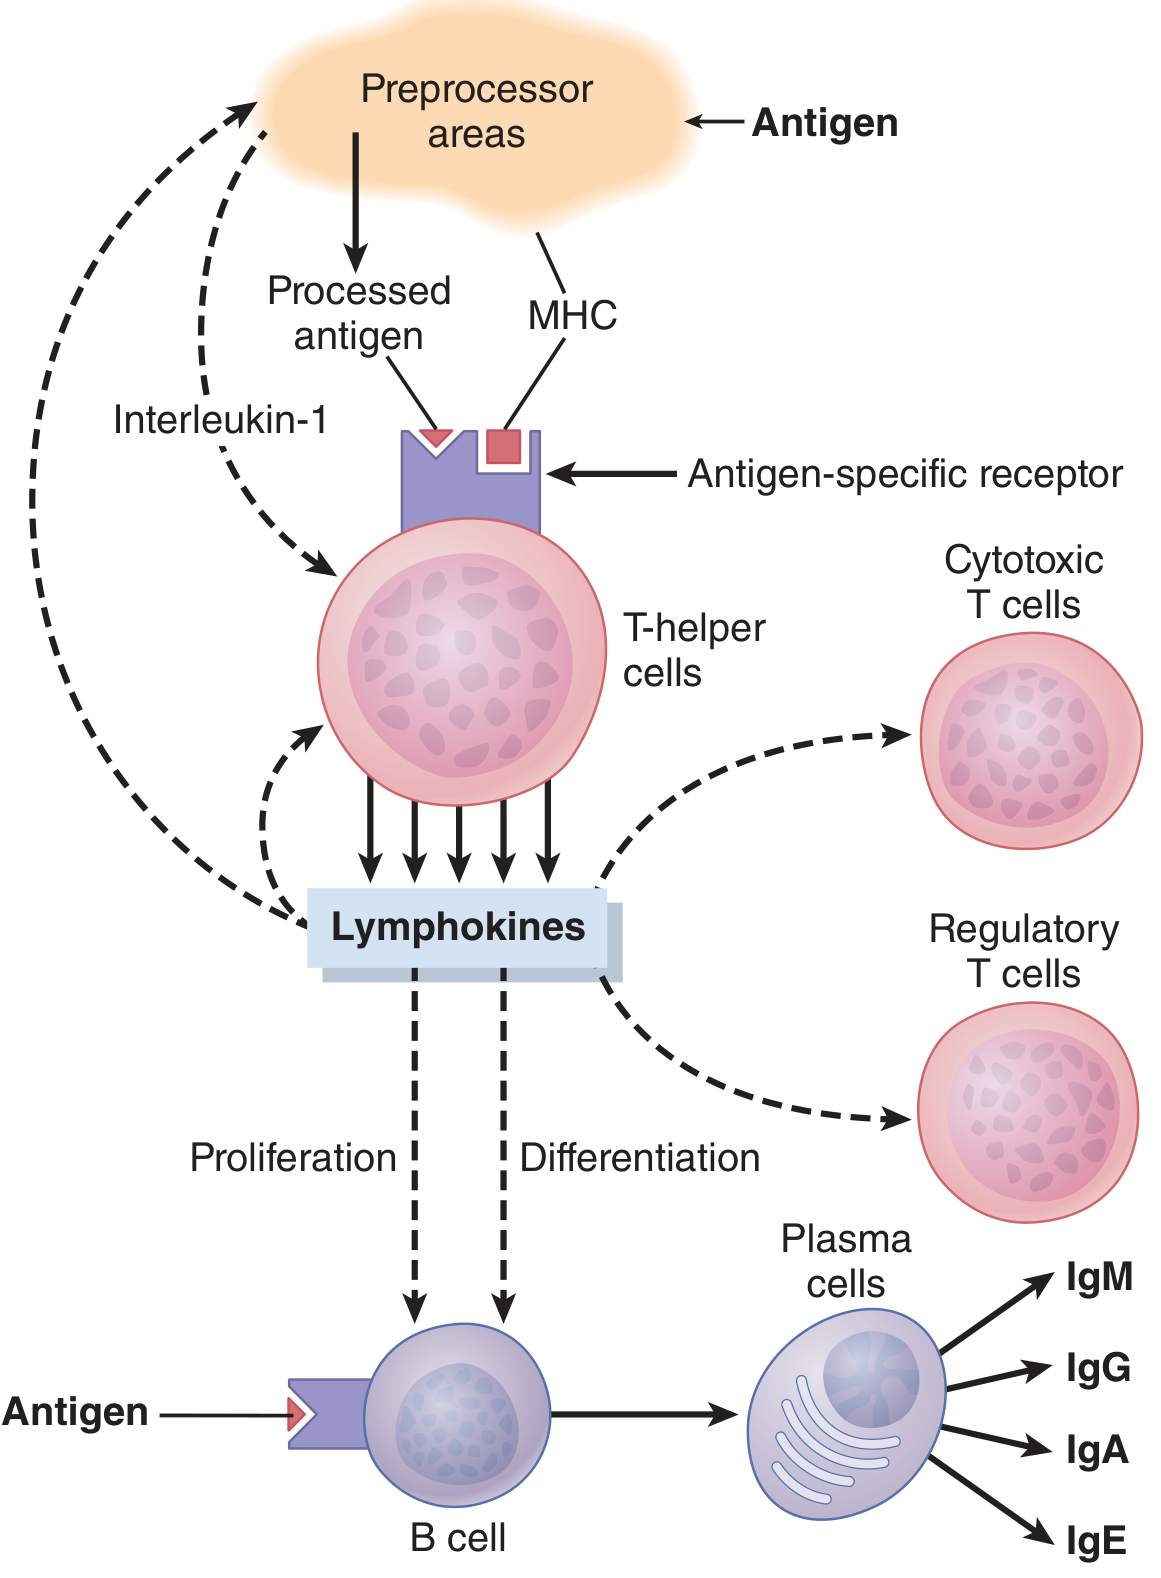
Fig. 35.8 - Regulation of the immune system, emphasizing the pivotal role of T-helper cells (Guyton & Hall)
T Cell Activation (Fig. 35.7)
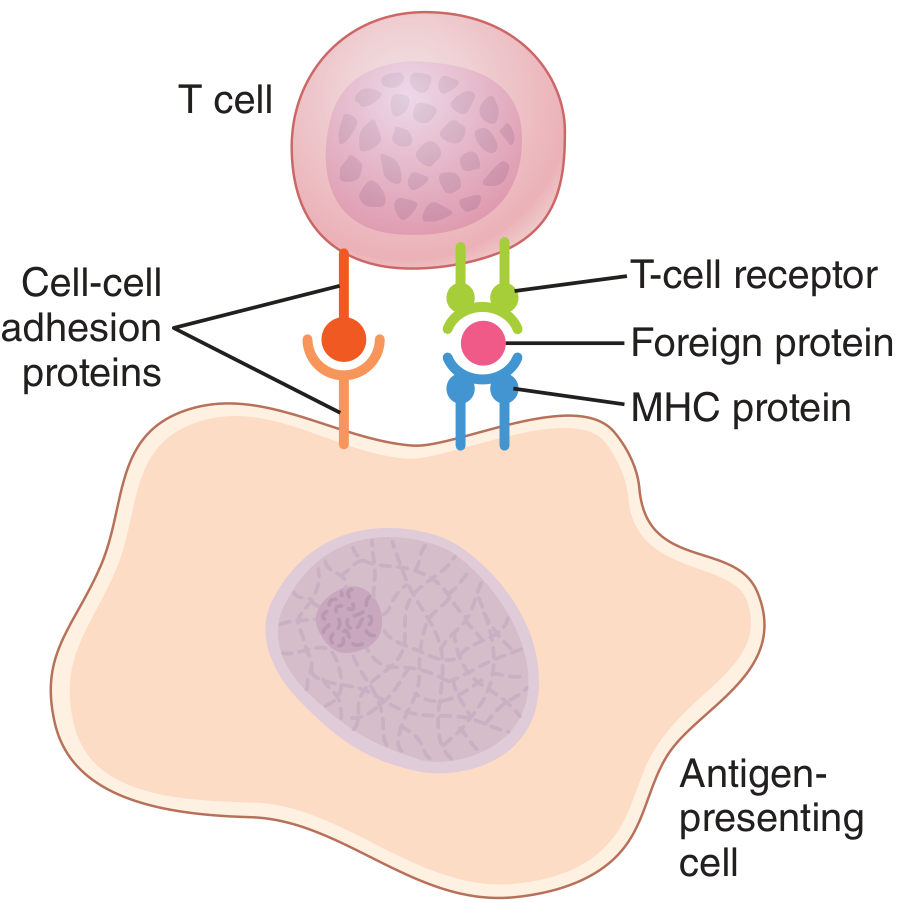
Fig. 35.7 - T cell activation requires TCR binding to antigen-MHC complex on APC (Guyton & Hall)
Flowchart
ANTIGEN ENTERS BODY
        │
        ▼
ANTIGEN-PRESENTING CELLS (APCs)
(Macrophages, B Lymphocytes, Dendritic Cells)
[Dendritic cells = most potent APC]
        │
        ▼
Antigen processed and bound to
MHC PROTEINS on APC surface
        │
   ┌────┴────┐
   ▼         ▼
MHC I      MHC II
(→ CD8+    (→ CD4+
cytotoxic)  helper/regulatory)
   │         │
   └────┬────┘
        │
        ▼
T CELL RECEPTOR (TCR) on T lymphocyte
binds antigen-MHC complex
+ Cell-cell adhesion proteins stabilize binding
        │
        + APC secretes INTERLEUKIN-1
        │  (amplifies T-helper activation)
        ▼
T-HELPER CELL ACTIVATED (CD4+)
[>75% of all T cells — "major regulator of virtually
 all immune functions" — Guyton]
        │
        ▼
T-HELPER CELL RELEASES LYMPHOKINES
(Cytokines/Interleukins)
        │
   ┌────┼──────────────┬────────────────┐
   ▼    ▼              ▼                ▼
 IL-2  IL-4,5,6   IFN-γ, GM-CSF   Chemotactic
                                   factors
Three Downstream Arms (Guyton's Classification)
Arm 1 — Cytotoxic T Cells (CD8+)
T-Helper lymphokines (esp. IL-2)
        │
        ▼
CYTOTOXIC T CELL CLONE ACTIVATED
("Killer cells" — CD8+)
        │
        ▼
Binds tightly to target cell
(infected cell / cancer cell / transplant cell)
        │
        ▼
Releases PERFORINS
(hole-forming proteins →
 punch holes in target cell membrane)
        │
        ▼
Fluid rushes into attacked cell
+ Cytotoxic substances injected directly
        │
        ▼
TARGET CELL SWELLS → DISSOLVES
(Cell death)
        │
        ▼
CTL pulls away → kills MORE cells
(one CTL kills multiple targets)
Arm 2 — T-Helper Lymphokine Actions
LYMPHOKINES from T-Helper cells
        │
   ┌────┼──────────────┐
   ▼    ▼              ▼
B-cell  Macrophage   IL-2 feedback
stimulation activation   on T-helper
(IL-4,5,6)              cells itself
   │    │              (amplification)
   ▼    ▼
Plasma  Macrophages
cells   become more
→ IgM,  efficient
  IgG,  phagocytes
  IgA,
  IgE
Arm 3 — Regulatory T Cells (CD4+ Tregs)
LYMPHOKINES stimulate
REGULATORY T CELLS (Tregs / Suppressor T cells)
        │
        ▼
SUPPRESS cytotoxic and helper T cell activity
        │
   ┌────┴────────────────┐
   ▼                     ▼
Prevents excessive      Prevents
immune reactions        AUTOIMMUNITY
→ protects own tissues  (immune tolerance)
T-Helper Cell Subsets (Guyton Table 35.1)
| Subset | Induced by | Lymphokines Produced | Major Immune Reaction |
|---|---|---|---|
| Th1 | IFN-γ, IL-12 | IFN-γ, IL-2, TNF-α, GM-CSF | Macrophage activation; IgG production |
| Th2 | IL-4 | IL-4, IL-5, IL-6, IL-10, IL-13 | IgE production; mast cell & eosinophil activation |
| Th17 | TGF-β, IL-1, IL-6, IL-23 | IL-17, IL-22 | Neutrophil & monocyte recruitment |
Memory T Cells (Guyton)
T CELL CLONE ACTIVATED
        │
        ├──→ EFFECTOR T CELLS (immediate response)
        │
        └──→ MEMORY T CELLS
                  │
                  ▼
          Preserved in lymphoid tissue
          throughout the entire body
                  │
          On re-exposure to same antigen:
                  ▼
          FASTER + MORE POWERFUL response
          than first exposure
Guyton's Key Points on Cellular Immunity
- T-helper cells are the master regulators - without their lymphokines, "the remainder of the immune system is almost paralyzed"
- Cytotoxic T cells (killer cells) use perforins to punch holes in target cell membranes → cell swells and dissolves
- One CTL can kill multiple targets - it moves on after punching holes
- Lymphokines serve as amplifiers - IL-2 feeds back to stimulate more T-helper cells
- HIV destroys T-helper cells → leaves the body "almost totally unprotected against infectious disease" → AIDS
- Memory T cells spread throughout ALL lymphoid tissue → explain faster secondary immune responses
Source: Guyton and Hall Textbook of Medical Physiology, Chapter 35 - Resistance of the Body to Infection: Leukocytes, Granulocytes, Monocyte-Macrophage System, and Inflammation
This is a shared conversation. Sign in to Orris to start your own chat.